. 2024 Nov 6;32(11):3895-3914.
doi: 10.1016/j.ymthe.2024.09.025. Epub 2024 Sep 23.

Single-cell RNA sequencing reveals anti-tumor potency of CD56+ NK cells and CD8+ T cells in humanized mice via PD-1 and TIGIT co-targeting

Affiliations

Single-cell RNA sequencing reveals anti-tumor potency of CD56+ NK cells and CD8+ T cells in humanized mice via PD-1 and TIGIT co-targeting

Wai Nam Liu et al. Mol Ther. .

Abstract

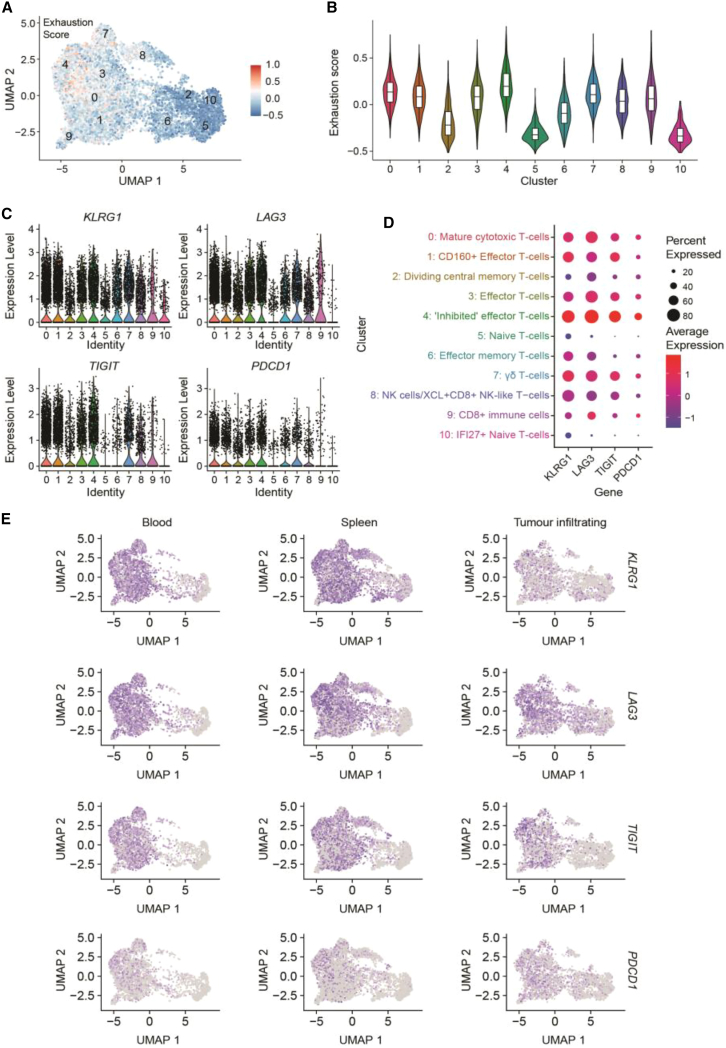
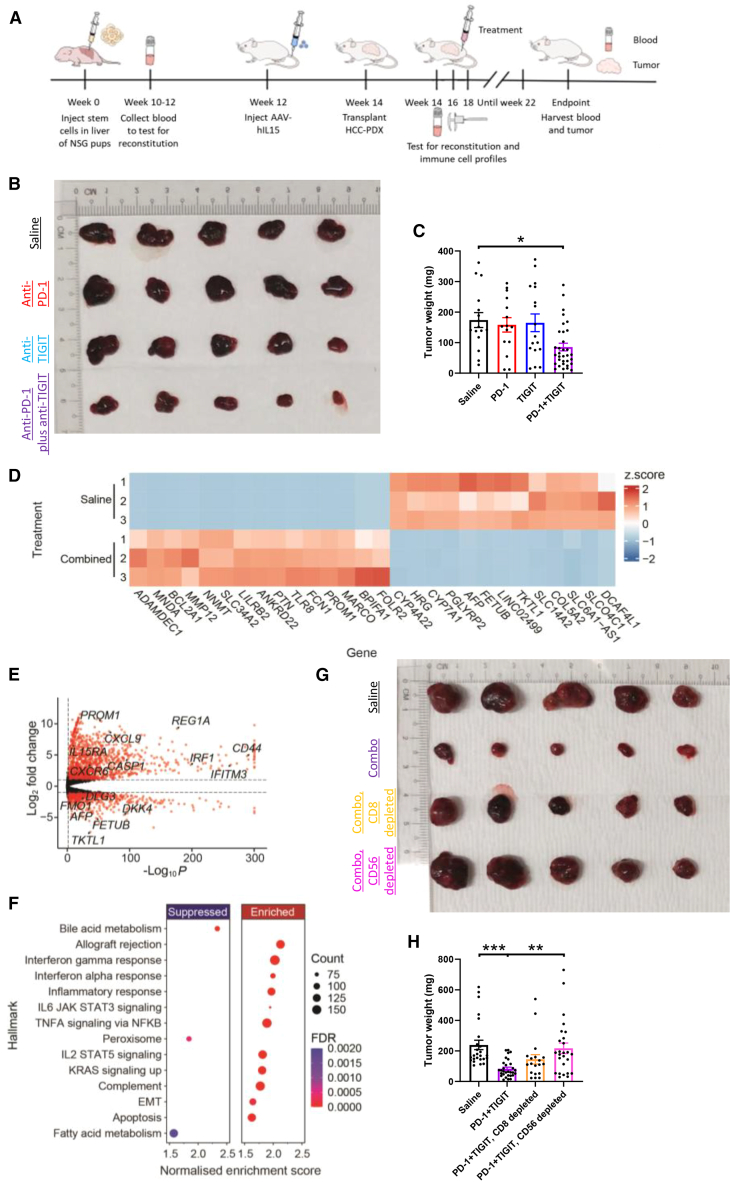
In solid tumors, the exhaustion of natural killer (NK) cells and cytotoxic T cells in the immunosuppressive tumor microenvironment poses challenges for effective tumor control. Conventional humanized mouse models of hepatocellular carcinoma patient-derived xenografts (HCC-PDX) encounter limitations in NK cell infiltration, hindering studies on NK cell immunobiology. Here, we introduce an improved humanized mouse model with restored NK cell reconstitution and infiltration in HCC-PDX, coupled with single-cell RNA sequencing (scRNA-seq) to identify potential anti-HCC treatments. A single administration of adeno-associated virus carrying human interleukin-15 reinstated persistent NK cell reconstitution and infiltration in HCC-PDX in humanized mice. scRNA-seq revealed NK cell and T cell subpopulations with heightened PDCD1 and TIGIT levels. Notably, combination therapy with anti-PD-1 and anti-TIGIT antibodies alleviated HCC burden in humanized mice, demonstrating NK cell-dependent efficacy. Bulk-RNA sequencing analysis also revealed significant alterations in the tumor transcriptome that may contribute to further resistance after combination therapy, warranting further investigations. As an emerging strategy, ongoing clinical trials with anti-PD-1 and anti-TIGIT antibodies provide limited data. The improved humanized mouse HCC-PDX model not only sheds light on the pivotal role of NK cells but also serves as a robust platform for evaluating safety and anti-tumor efficacy of combination therapies and other potential regimens, complementing clinical insights.

Keywords: hepatocellular carcinoma patient-derived xenografts; humanized mice; immune checkpoint inhibitors; single-cell RNA sequencing; tumor-infiltrating NK cells; tumor-infiltrating T cells.


Conflict of interest statement

Declaration of interests Q.C. is the scientific cofounder of two biotech companies.

Figures

None
Graphical abstract
Figure 1
Figure 1
AAV-hIL15 restores NK cell reconstitution in humanized mice Humanized mice were intravenously injected with AAV-hIL15 or AAV-GFP. (A) Schematic description showing the methodology to generate humanized mice and workflow to restore NK cell reconstitution. (B–D) Blood samples were collected at different time points from both groups (n = 6 per group). The percentage of chimerism (B), percentage of human CD56+ NK cells relative to human CD45+ immune cells (C), and number of NK cells (D) in circulation were determined by flow cytometry. (E) Surface expressions of NK cell-specific markers on PBMC-NK cells and B-NK cells under the gate of human CD45+, CD3, and CD56+ subsets. Cells stained with isotype controls (blue histogram) and indicated PE-conjugated antibodies (red histogram) were examined by flow cytometry. (F–I) Equal numbers of PBMC-NK cells (5 × 104 cells/well, n = 4) and B-NK cells (5 × 104 cells/well, n = 4) were cocultured with K-562 cells, either at the indicated E:T ratio (F) or at a 1:1 ratio of E:T (G–I). (F) Percentage of NK cell cytotoxicity toward K-562 cells. (G) Extent of apoptosis, indicated by the enrichment factor. (H) CD107a expression was determined in anti-CD56-labeled NK cells after stimulation by K-562 cells. (I) Net release of IFN-γ from PBMC-NK cells (5 × 104 cells/well) and B-NK cells (5 × 104 cells/well) after stimulation by K-562 cells. Data are expressed as means ± SEM. ∗p < 0.05, ∗∗p < 0.01, ∗∗∗p < 0.001. Wilcoxon test (B and C); two-tailed paired Student’s t test (D and G–I). AAV-GFP, adeno-associated virus carrying GFP; AAV-hIL15, adeno-associated virus carrying human interleukin-15; B-NK, circulating natural killer cells in humanized mice; E:T ratio, effector-cell to target-cell ratio; IFN-γ, interferon gamma; PBMC-NK, natural killer cells from human peripheral blood mononuclear cells.
Figure 2
Figure 2
AAV-hIL15 increases NK cell infiltration in HCC-PDX in humanized mice Humanized mice were intravenously injected with AAV-hIL15 or AAV-GFP, followed by the transplantation of HCC-PDX established from five different donors. (A) Schematic description illustrating the injection of AAV-hIL15 and transplantation of HCC-PDX into humanized mice, typically resulting in visible tumors (reaching a size of 3 mm in one dimension) within 1–2 weeks. (B–E) HCC-PDX (PDX-1, PDX-2, and PDX-3) were harvested from hIL15-humice and GFP-humice. (B) Representative FACS plots showing the presence of CD16+CD56+ NK cells and CD16CD56+ NK cells in hIL15-humice and GFP-humice under the gate of CD45+ and CD3 subsets. The percentage of total CD56+ NK cells (C), CD16+CD56+ NK cells (D), and CD16CD56+ NK cells (E) in tumors from hIL15-humice (n = 18) and GFP-humice (n = 15) was determined using flow cytometry. (F–I) HCC-PDX (PDX-1, PDX-4, and PDX-5) were harvested from hIL15-humice and GFP-humice. The number of tumor-infiltrating hCD45+ immune cells (F), total CD56+ NK cells (G), CD16+CD56+ NK cells (H), and CD16CD56+ NK cells (I) in hIL15-humice (n = 12) and GFP-humice (n = 12) was determined by trypan blue exclusion assay and flow cytometric analysis. (J and K) HCC-PDX (PDX-1, PDX-2, and PDX-3) were harvested from hIL15-humice and GFP-humice. (J) Representative FACS plots showing the presence of CD4+ T cells and CD8+ T cells in hIL15-humice and GFP-humice under the gate of CD45+, CD3+, and CD56 subsets. (K) The percentage of CD3+ T cells in tumors from hIL15-humice (n = 25) and GFP-humice (n = 19) was determined by flow cytometry. (L–N) HCC-PDX (PDX-1, PDX-4, and PDX-5) were harvested from hIL15-humice and GFP-humice. The number of CD3+ T cells (L), CD4+ T cells (M), and CD8+ T cells (N) from hIL15-humice (n = 12) and GFP-humice (n = 12) was determined by trypan blue exclusion assay and flow cytometric analysis. Data are expressed as means ± SEM. ∗p < 0.05, ∗∗∗p < 0.001. Two-tailed unpaired Student’s t test (C and E); Mann-Whitney test (D, F–I, and K–N). AAV-GFP, adeno-associated virus carrying GFP; AAV-hIL15, adeno-associated virus carrying human interleukin-15; FACS, fluorescence-activated cell sorting; GFP-humice, AAV-GFP-injected humanized mice; HCC-PDX, hepatocellular carcinoma patient-derived xenografts; hIL15-humice, AAV-hIL15-injected humanized mice; NK, natural killer.
Figure 3
Figure 3
Single-cell analysis of CD56+ NK cells and CD8+ T cells in humanized mice Humanized mice were intravenously injected with AAV-hIL15, followed by the transplant of HCC-PDX (PDX-1). (A) Schematic description of the process for preparing single-cell suspensions. Blood samples, spleens, and tumors were harvested from hIL15-humice bearing HCC-PDX, followed by dead cell removal, mouse cell depletion, and isolation of CD56-positive and CD8-positive cells. (B) UMAP displaying initial clustering of all CD56+ NK cells and CD8+ T cells. (C) Feature plots illustrating the separation of clusters into NCAM1+ cells and CD8A+ cells representing the CD56+ NK cells and CD8+ T cells, respectively. (D) UMAP of CD56+ NK cell subpopulations with the identity of clusters labeled as: (0) activated CD56+ NK cells, (1) cytotoxic CD16+ NK cells, (2) inhibited CD16+ NK cells, (3) CD56bright NK cells, (4) dividing CD56bright cells, (5) CD56brightCD161+ NK cells, (6) proliferating NK cells, and (7) NKT cells. (E) Dot plot of CD56+ cell marker genes detailing average expression and percentage of cells expressing each marker gene at the transcript level. (F) Proportions of each CD56+ NK cell cluster in blood samples, spleens, and tumors. (G) UMAP of CD8+ T cell subpopulations with the identity of clusters labeled as: (0) mature cytotoxic T cells, (1) CD160+ effector T cells, (2) dividing central memory T cells, (3) effector T cells, (4) inhibited effector T cells, (5) naive T cells, (6) effector memory T cells, (7) γδ-T cells, (8) NK cells/XCL+ CD8+ NK-like T cells, (9) CD8+ immune cells, and (10) IFI27+ naive T cells. (H) Dot plot of CD8+ cell marker genes detailing average expression and percentage of cells expressing each marker gene at the transcript level. (I) Proportions of each CD8+ T cell cluster in blood samples, spleens, and tumors. AAV-hIL15, adeno-associated virus carrying human interleukin-15; γδ, gamma delta; HCC-PDX, hepatocellular carcinoma patient-derived xenografts; hIL15-humice, AAV-hIL15-injected humanized mice; NK, natural killer; UMAP, Uniform Manifold Approximation and Projection.
Figure 4
Figure 4
Single-cell analysis of exhaustion in NK cells (A) Feature plot detailing overall exhaustion score in NK cells. AddModuleScore was calculated from genes upregulated in exhaustion, including: KLRG1, TIGIT, PDCD1, LAG3, CTLA4, FAS, CD244, CD160, NR4A1, TOX, TOX2, EOMES, PRDM1, DNMT1, and GZMB. (B) Violin plot detailing overall exhaustion score in NK cells utilizing the same genes above. Boxplot represents median and interquartile range. Violin plots (C) and dot plot (D) detailing expression of the inhibitory receptors KLRG1, LAG3, TIGIT, and PDCD1 in each CD56+ NK cell subcluster. (E) Feature plots detailing the expression of these inhibitory receptors in CD56+ NK cells from blood samples, spleens, and tumors. NK, natural killer; UMAP, Uniform Manifold Approximation and Projection.
Figure 5
Figure 5
Single-cell analysis of exhaustion in T cells (A) Feature plot detailing overall exhaustion score in T cells. AddModuleScore was calculated from genes upregulated in exhaustion, including: KLRG1, TIGIT, PDCD1, LAG3, HAVCR2, CTLA4, FAS, CD244, CD160, NR4A1, TOX, TOX2, EOMES, PRDM1, DNMT1, and GZMB. (B) Violin plot detailing overall exhaustion score in T cells utilizing the same genes above. Boxplot represents median and interquartile range. Violin plots (C) and dot plot (D) detailing expression of the inhibitory receptors KLRG1, LAG3, TIGIT, and PDCD1 in each CD8+ T cell subcluster. (E) Feature plots detailing the expression of the inhibitory receptors in CD8+ T cells from blood samples, spleens, and tumors. UMAP, Uniform Manifold Approximation and Projection.
Figure 6
Figure 6
Synergistic anti-tumor response to anti-PD-1 and anti-TIGIT antibodies in HCC-PDX-bearing hIL15-humice in an NK cell-dependent manner (A) Schematic description of combination therapy in HCC-PDX-bearing hIL15-humice. (B–C) hIL15-humice were transplanted with HCC-PDX. Once tumors reached 3 mm in one dimension, mice were treated with saline (n = 16), anti-PD-1 antibody (n = 15), anti-TIGIT antibody (n = 17), and anti-PD-1 plus anti-TIGIT antibodies (n = 33). (B) Representative image of tumors. (C) Tumor weights are shown. Data are combined from three independent experiments using PDX derived from three patients (PDX-1, PDX-2, and PDX-3). (D) Heatmap of the 15 most downregulated and upregulated genes from PDX-1 following combination therapy (n = 3) compared with saline treatment (n = 3). Transcripts expression was Z score normalized, and heatmap was clustered according to Euclidean distance. (E) Volcano plot showing differentially expressed genes (red) and genes not reaching the decision threshold or Benjamini-Hochberg adjusted p value < 0.05 (black). (F) Fast gene set enrichment analysis was performed using the hallmark dataset from MSigDB. Normalized enrichment scores were calculated to account for differences in gene set sizes. Dot size represents the number of genes in the pathway, and color indicates the FDR. (G–H) Depletion of CD8+ T cells or CD56+ NK cells was performed prior to HCC-PDX transplant in hIL15-humice. Upon reaching 3 mm tumor size, mice received saline (n = 25), anti-TIGIT plus anti-TIGIT antibodies (n = 30), anti-TIGIT plus anti-TIGIT antibodies with CD8+ T cell depletion (n = 19) and anti-TIGIT plus anti-TIGIT antibodies with CD56+ NK cell depletion (n = 26). (G) Representative image of tumors. (H) Tumor weights are shown. Data are combined from three independent experiments using PDX derived from three patients (PDX-1, PDX-2, and PDX-3). Data are expressed as means ± SEM. ∗p < 0.05, ∗∗p < 0.01, ∗∗∗p < 0.001. Kruskal-Wallis test (C and H). AAV-hIL15, adeno-associated virus carrying human interleukin-15; FDR, false discovery rate; HCC-PDX, hepatocellular carcinoma patient-derived xenografts; hIL15-humice, AAV-hIL15-injected humanized mice; NK, natural killer.

Similar articles

Cited by

References

    1. Sung H., Ferlay J., Siegel R.L., Laversanne M., Soerjomataram I., Jemal A., Bray F. Global cancer statistics 2020: GLOBOCAN estimates of incidence and mortality worldwide for 36 cancers in 185 countries. CA Cancer J. Clin. 2021;71:209–249. - PubMed
    1. Chimed T., Sandagdorj T., Znaor A., Laversanne M., Tseveen B., Genden P., Bray F. Cancer incidence and cancer control in Mongolia: Results from the National Cancer Registry 2008-12. Int. J. Cancer. 2017;140:302–309. - PubMed
    1. Huang A., Yang X.R., Chung W.Y., Dennison A.R., Zhou J. Targeted therapy for hepatocellular carcinoma. Signal Transduct. Targeted Ther. 2020;5:146. - PMC - PubMed
    1. Tang W., Chen Z., Zhang W., Cheng Y., Zhang B., Wu F., Wang Q., Wang S., Rong D., Reiter F.P., et al. The mechanisms of sorafenib resistance in hepatocellular carcinoma: theoretical basis and therapeutic aspects. Signal Transduct. Targeted Ther. 2020;5:87. - PMC - PubMed
    1. Hiam-Galvez K.J., Allen B.M., Spitzer M.H. Systemic immunity in cancer. Nat. Rev. Cancer. 2021;21:345–359. - PMC - PubMed

MeSH terms