. 2024 Nov;11(43):e2402082.
doi: 10.1002/advs.202402082. Epub 2024 Sep 24.

Constitutive Androstane Receptor Regulates Germ Cell Homeostasis, Sperm Quality, and Male Fertility via Akt-Foxo1 Pathway

Affiliations

Constitutive Androstane Receptor Regulates Germ Cell Homeostasis, Sperm Quality, and Male Fertility via Akt-Foxo1 Pathway

Mélusine Monrose et al. Adv Sci (Weinh). 2024 Nov.

Abstract

Male sexual function can be disrupted by exposure to exogenous compounds that cause testicular physiological alterations. The constitutive androstane receptor (Car) is a receptor for both endobiotics and xenobiotics involved in detoxification. However, its role in male fertility, particularly in regard to the reprotoxic effects of environmental pollutants, remains unclear. This study aims to investigate the role of the Car signaling pathway in male fertility. In vivo, in vitro, and pharmacological approaches are utilized in wild-type and Car-deficient mouse models. The results indicate that Car inhibition impaired male fertility due to altered sperm quality, specifically histone retention, which is correlated with an increased percentage of dying offspring in utero. The data highlighted interactions among Car, Akt, Foxo1, and histone acetylation. This study demonstrates that Car is crucial in germ cell homeostasis and male fertility. Further research on the Car signaling pathway is necessary to reveal unidentified causes of altered fertility and understand the harmful impact of environmental molecules on male fertility and offspring health.

Keywords: Foxo1; constitutive androstane receptor; repro‐toxicity; spermatogonia; xenobiotic.


Conflict of interest statement

The authors declare no conflict of interest.

Figures
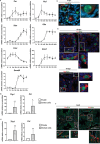
Figure 1
Figure 1
Constitutive androstane receptor is expressed in mouse testes. A) Testicular relative mRNA accumulations, normalized to β‐actin, of Car and somatic cell markers Star (Leydig) and Fshr (Sertoli) as well as germ cell markers Plzf (undifferentiated spermatogonia), G9a (undifferentiated/differentiating spermatogonia), Dmc1 (spermatocyte) and Smad6 (spermatid) at 1, 3, 10, 20, 30, 40, 90, and 180‐d‐old. n = 5 per age. B) Thy1 and Car mRNA accumulations normalized to β ‐actin in Thy1+ cells or eluates isolated from 6‐d‐old C57Bl6J males. n = 7 per group. The Thy1‐ unsorted cell group was arbitrarily set at 1. Data are expressed as the means ± SD. T‐test statistical analysis; *p < 0.05 and **p < 0.01 versus Thy1‐ unsorted cell group. C) Thy1 and Car mRNA accumulations normalized to β ‐actin in Thy1+ cells or eluates isolated from 3‐month‐old adult C57Bl6J males. n = 10. The Thy1‐ unsorted cell group was arbitrarily set at 1. Data are expressed as the means ± SD. T‐test statistical analysis; **p < 0.01. versus Thy1‐ unsorted cell group D‐F) Representative testis micrographs of 3 d‐postnatal (dpn), 10 dpn, or adult (8 months) Wt males stained for Car (red) and for undifferentiated spermatogonia marker Plzf (green) or for differentiating spermatogonia marker G9a (Green). White stars indicate the co‐stained cells. ns: nonspecific. The white squares delimit the area that has been enlarged. The experiment was performed on three different male mice.
Figure 2
Figure 2
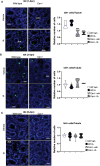
Car inhibition alters Id4+ spermatogonia population A) (Left panel) Representative testis micrographs of 1‐d‐old vehicle or IA‐treated Wt and Car−/− males stained for Id4. (Right panel) Quantification of the number of Id4 positive cells per seminiferous tubule in testes of Wt or Car−/− males treated with vehicle or IA. n = 5 per group. The blue line indicates the median of the group. Numbers were normalized to vehicle‐treated Wt group, which was arbitrarily set at 1. B) (Left panel) Representative testis micrographs of 3‐d‐old vehicle or IA‐treated Wt and Car−/− males stained for Id4. (Right panel) Quantification of the number of Id4 positive cells per seminiferous tubule in testes of Wt or Car−/− males treated with vehicle or IA. n = 5 per group. The blue line indicates the median of the group. Numbers were normalized to vehicle‐treated Wt group, which was arbitrarily set at 1. C) (Left panel) Representative testis micrographs of 5‐d‐old vehicle or IA‐treated Wt and Car−/− males stained for Id4. (Right panel) Quantification of the number of Id4 positive cells per seminiferous tubule in testes of Wt or Car−/− males treated with vehicle or IA. n = 20 per groups for Wt and n = 15 per groups for Car−/− males. The blue line indicates the median of the group. Numbers were normalized to vehicle‐treated Wt group, which was arbitrarily set at 1. In all panels, Veh: vehicle and IA: Inverse agonist. Two‐way ANOVA followed by Holm‐Sidak's test was used for multiple comparisons. *p < 0.05; ***p < 0.001 versus vehicle‐treated Wt males.
Figure 3
Figure 3
Car inhibition alters the Plzf+ spermatogonia population. A) (Left panel) Representative micrographs of 5‐d‐old IA‐treated Wt or Car−/− testis stained for Plzf. (Right panel) Quantification of the number of Plzf positive cells per seminiferous tubule in testes of Wt or Car−/− males treated with vehicle or IA. n = 30 per group for Wt and n = 20 per group for Car−/− males. The blue line indicates the median for each group. Numbers were normalized to vehicle‐treated Wt group, which was arbitrarily set at 1. B) (Left panel) Representative micrographs of 10‐d‐old IA‐treated Wt or Car−/− testis stained for Plzf. (Right panel) Quantification of the number of Plzf positive cells per seminiferous tubule in testes of Wt or Car−/− males treated with vehicle or IA. n = 30 per group for Wt and n = 20 per group for Car−/− males. The blue line indicates the median for each group. Numbers were normalized to vehicle‐treated Wt group, which was arbitrarily set at 1. C) (Left panel) Representative testis micrographs of 15‐d‐old vehicle or IA‐treated Wt and Car−/− males stained for Plzf. (Right panel) Quantification of the number of PLZF positive cells per seminiferous tubule in testes of Wt or Car−/− males treated with vehicle or IA. n = 5 per group. The blue line indicates the median for each group. Numbers were normalized to vehicle‐treated Wt group, which was arbitrarily set at 1. In all panels, Veh: vehicle and IA: Inverse agonist. Two‐way ANOVA followed by Holm‐Sidak's test for multiple comparisons. *p < 0.05; ***p < 0.001 versus vehicle‐treated Wt males.
Figure 4
Figure 4
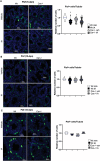
CAR inhibition alters Id4+ cell localization in neonatal mouse testis. A) (Left panel) Representative micrographs of 5‐d‐old IA‐treated Wt and Car−/− testis stained for Id4. The white stars indicate ectopic cells. (Right panel) Quantification of the number of Id4 positive ectopic cells per seminiferous tubule in testes of Wt or Car−/− males treated with vehicle or IA. n = 20 per group for Wt and n = 15 per group for Car−/− males. The blue line indicates the median for each group. Numbers were normalized to vehicle‐treated Wt group, which was arbitrarily set at 1. B) (Left panel) Representative micrographs of 10‐d‐old IA‐treated Wt and Car−/− testis stained for Id4. The white stars indicate ectopic cells. (Right panel) Quantification of the number of Id4 positive ectopic cells per seminiferous tubule in testes of Wt or Car−/− males treated with vehicle or IA. n = 30 per group for Wt and n = 20 per group for Car−/− males. The blue line indicates the median for each group. Numbers were normalized to vehicle‐treated Wt group, which was arbitrarily set at 1. In all panels, Veh: vehicle and IA: Inverse agonist. Two‐way ANOVA followed by Holm‐Sidak's test for multiple comparisons. *p < 0.05 versus vehicle‐treated Wt males. Veh: vehicle and IA: Inverse agonist.
Figure 5
Figure 5
CAR inhibition alters Plzf+ cell localization in neonatal mouse testis. A) (Top panel) Representative micrographs of 5‐d‐old IA‐treated Wt and Car−/− testis stained for Plzf. The white stars indicate ectopic cells. White square indicates enlarged area. (Bottom panel) Quantification of the number of Plzf positive ectopic cells per seminiferous tubule in 5‐dpn testis of Wt or Car−/− males treated with vehicle or IA. n = 20 per group for Wt and n = 15 per group for Car−/− males. The blue line indicates the median for each group. Numbers were normalized to vehicle‐treated Wt group, which was arbitrarily set at 1. B) (Top panel) Representative micrographs of 10‐d‐old IA‐treated Wt testis stained for Plzf. The white stars indicate ectopic cells. (Bottom panel) Quantification of the number of Plzf positive ectopic cells per seminiferous tubule in 10‐dpn testis of WT or Car−/− males treated with vehicle or IA. n = 30 per group for Wt and n = 20 per group for Car−/− males. The blue line indicates the median for each group. Numbers were normalized to vehicle‐treated Wt group, which was arbitrarily set at 1. In all panels, Veh: vehicle and IA: Inverse agonist. Two‐way ANOVA followed by Holm‐Sidak's test for multiple comparisons. *p < 0.05 versus vehicle‐treated Wt males.
Figure 6
Figure 6
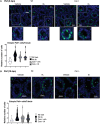
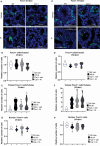
CAR inhibition alters Foxo1+ spermatogonia. A) Representative micrographs of 1‐d old vehicle or IA‐treated Wt and Car−/− testis stained for Foxo1. The white stars indicate cells with Foxo1 nuclear staining. B) Quantification of the number of Foxo1‐positive cells per seminiferous tubule in 1‐d‐old testes of Wt or Car−/− males treated with vehicle or IA. n = 5 per group. The blue line indicates the median for each group. Numbers were normalized to vehicle‐treated Wt group, which was arbitrarily set at 1.C) Representative micrographs of the 3‐d‐old vehicle or IA‐treated Wt and Car−/− testis stained for Foxo1. The white stars indicate cells with Foxo1 nuclear staining. D) Quantification of the number of Foxo1‐positive cells per seminiferous tubule in 3‐d‐old testes of Wt or Car−/− males treated with vehicle or IA. n = 5 per group. The blue line indicates the median for each group. Numbers were normalized to vehicle‐treated Wt group, which was arbitrarily set at 1. E) Quantification of the relative ratio of Foxo1‐positive cells with nuclear staining at 1‐dpn testis of Wt male mice or Car−/− males. n = 5 per group. The blue line indicates the median for each group. Numbers were normalized to vehicle‐treated Wt group, which was arbitrarily set at 1. F) Quantification of the relative ratio of Foxo1‐positive cells with nuclear staining at 3‐dpn testis of Wt male mice or Car−/− males. n = 5 per group. The blue line indicates the median for each group. Numbers were normalized to vehicle‐treated Wt group, which was arbitrarily set at 1. In all panels, Veh: vehicle and IA: Inverse agonist. Two‐way ANOVA followed by Holm‐Sidak's test for multiple comparisons. **p < 0.01 versus vehicle‐treated Wt males.
Figure 7
Figure 7
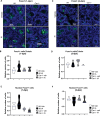
CAR inhibition alters Foxo+ cell localization in seminiferous tubules and Foxo1 subcellular localization in spermatogonia. A) Representative micrographs of the 5‐d‐old vehicle or IA‐treated Wt and Car−/− testis stained for Foxo1. The white stars indicate ectopic cells. B) Quantification of the number of Foxo1‐positive cells per seminiferous tubule in 5‐dpn testis of Wt or Car−/− males treated with vehicle or IA and 5 dpn. n = 20 per group for Wt and n = 15 per group for Car−/− males. The blue line indicates the median for each group. Numbers were normalized to the vehicle‐treated Wt group, which was arbitrarily set at 1. C) Representative micrographs of the 10‐d‐old vehicle or IA‐treated Wt and Car−/− testis stained for Foxo1. The white stars indicate ectopic cells. D) Quantification of the number of Foxo1‐positive cells per seminiferous tubule in testes of Wt or Car−/− males treated with vehicle or IA at 10 dpn. n = 30 per group for Wt and n = 20 per group for Car−/− males. The blue line indicates the median for each group. Numbers were normalized to the vehicle‐treated Wt group, which was arbitrarily set at 1. E) Quantification of the number of ectopic Foxo1‐positive cells per seminiferous tubule in 5‐dpn testis of Wt or Car−/− males treated with vehicle or IA. n = 20 per group for Wt and n = 15 per group for Car−/− males. The blue line indicates the median for each group. Numbers were normalized to the vehicle‐treated Wt group, which was arbitrarily set at 1. F) Quantification of the number of ectopic Foxo1‐positive cells per seminiferous tubule in 10‐dpn testis of Wt or Car−/− males treated with vehicle or IA. n = 30 per group for Wt and n = 20 per group for Car−/− males. The blue line indicates the median for each group. Numbers were normalized to the vehicle‐treated Wt group, which was arbitrarily set at 1. G) Quantification of the relative ratio of Foxo1‐positive cells with nuclear staining at 5‐dpn testis of Wt male mice or Car−/− males. n = 20 per group for WT and n = 15 per group for Car−/− males. The blue line indicates the median for each group. Numbers were normalized to vehicle‐treated Wt group, which was arbitrarily set at 1. H) Quantification of the relative ratio of Foxo1‐positive cells with nuclear staining at 10‐dpn testis of Wt male mice or Car−/− males. n = 30 per group for Wt and n = 20 per group for Car−/− males. The blue line indicates the median for each group. Numbers were normalized to the vehicle‐treated Wt group, which was arbitrarily set at 1. In all panels, Veh: vehicle and IA: Inverse agonist. Two‐way ANOVA followed by Holm‐Sidak's test for multiple comparisons. *p < 0.05; **p < 0.01 versus vehicle‐treated Wt males.
Figure 8
Figure 8
Car inhibition alters Foxo+ cells in adult testis. A) Representative micrographs of adult (8 months) IA‐treated Wt and Car−/− testis stained for Foxo1. The white square indicates the enlarged area. Stars indicate Foxo1+ cells. B) Quantification of the number of Foxo1‐positive cells per seminiferous tubule in adult testes of Wt or Car−/− males treated with vehicle or IA. The blue line indicates the median for each group. Numbers were normalized to the vehicle‐treated Wt group, which was arbitrarily set at 1. (n = 26 for Wt veh; n = 24 for IA, n = 15 for Car−/− veh, and n = 15 for Car−/− IA). C) Quantification of ratios of Foxo1+ cells with nuclear staining compared to the total number of Foxo1‐positive cells in Wt and Car−/− male mice treated with vehicle or IA. (n = 26 for Wt veh; n = 24 for IA, n = 15 for Car−/− veh and n = 15 for Car−/− IA). The blue line indicates the median for each group. Wt vehicle group was arbitrarily set at 1. D) Quantification of ratios of Foxo1+ cells with cytoplasmic staining compared to the total number of Foxo1‐positive cells in Wt and Car−/− male mice F treated with vehicle or IA. The blue line indicates the median for each group. Wt vehicle group was arbitrarily set at 1. Two‐way ANOVA followed by Holm‐Sidak's test for multiple comparisons. *p < 0.05 versus vehicle‐treated Wt males.
Figure 9
Figure 9
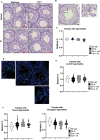
Car inhibition alters the late step of spermatogenesis. A) Representative micrographs of hematoxylin/eosin‐stained adult testes (8 months of age) of Wt or Car−/− males neonatally treated with the vehicle or IA. B) Representative micrograph of hematoxylin/eosin‐stained adult testes (8 months of age) of Wt males neonatally treated with the vehicle IA. The square indicates the enlarged region. The black star indicates elongated spermatids. C) Quantification of the relative percentage of seminiferous tubules with elongated spermatids in adult testis (8 months of age) of Wt or Car−/− males treated with vehicle or IA. (n = 26 for Wt veh; n = 24 for IA, n = 15 for Car−/− veh and n = 15 for Car−/− IA). The blue line indicates the median for each group. Numbers were normalized to vehicle‐treated Wt which was arbitrarily set at 1. D) Representative micrograph of adult (8 months of age) IA‐treated Wt testes stained for acetylated histone H4 (Ac‐H4). White squares indicate the enlarged region. Zoom area upper left shows elongated spermatids stained for Ac‐H4 and the zoom area lower right shows round spermatids stained for Ac‐H4. E) Quantification of the relative percentage of seminiferous tubules with Ac‐H4 spermatids in testis (8 months of age) of Wt or Car−/− males treated with vehicle or IA. (n = 26 for Wt veh; n = 24 for IA, n = 15 for Car−/− veh and n = 15 for Car−/− IA). The blue line indicates the median for each group. Numbers were normalized to vehicle‐treated Wt which was arbitrarily set at 1. F) Quantification of the relative percentage of seminiferous tubules with round or elongated Ac‐H4 spermatids in testis (8 months of age) of Wt or Car−/− males treated with vehicle or IA. (n = 26 for Wt veh; n = 24 for IA, n = 15 for Car−/− veh and n = 15 for Car−/− IA). The blue line indicates the median for each group. Numbers were normalized to vehicle‐treated Wt which was arbitrarily set at 1. In all panels, Veh: vehicle and IA: Inverse agonist. Two‐way ANOVA followed by Holm‐Sidak's test for multiple comparisons. *p < 0.05; **p < 0.01 versus vehicle‐treated Wt males.
Figure 10
Figure 10
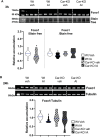
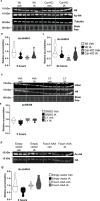
Car inhibition leads to histone retention in sperm cells. A) Representative western blots of H3 in sperm cells of Wt and Car−/− mice (8 months of age). B) Quantification of ratios H3/total proteins in sperm cells of Wt and Car−/− mice. Normalization was performed against total protein using stain‐free gels. The blue line indicates the median for each group. Wt vehicle‐treated group was arbitrarily set at 1. C) Representative western blots of H3 in sperm cells of Wt and Car−/− mice neonatally treated with vehicle or IA. D) Quantification of ratios H3/total proteins in sperm cells of Wt and Car−/− mice neonatally treated with vehicle or IA. Normalization was performed against total protein using stain‐free gels. The blue line indicates the median for each group. Vehicle groups of each genotype were arbitrarily set at 1. E) Correlation between the relative level of H3 in sperm cells and the relative percentage of seminiferous tubules with round elongated stained for Ac‐H4 of Wt and Car−/− mice. F) Correlation between the relative level of H3 in sperm cells and the relative percentage of seminiferous tubules with elongated stained for acH4 of Wt and Car−/− mice. G) Correlation between the relative level of H3 and the relative percentage of seminiferous tubules with round elongated stained for Ac‐H4 in sperm cells of Wt and Car−/− mice neonatally treated with vehicle or IA. H) Correlation between the relative level of H3 and the relative percentage of seminiferous tubules with elongated stained for Ac‐H4 in sperm cells of Wt and Car−/− mice neonatally treated with vehicle or IA. In all panels, Veh: vehicle and IA: Inverse agonist. n = 26 for Wt veh; n = 24 for IA, n = 15 for Car−/− veh and n = 15 for Car−/− IA. T‐test (panel B) was performed to compare two groups and Two‐way ANOVA followed by Holm‐Sidak's test (panel D) was performed for multiple comparisons. A to D **p < 0.01 versus Wt vehicle‐treated male group. E to H, Pearson test was performed.
Figure 11
Figure 11
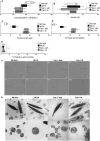
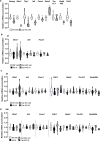
Complete sperm parameters analysis of each condition. A) Relative number of sperm count in the epididymis tail of Wt or Car−/− males (8 months of age). IA‐treated Wt and Car−/− males present lower sperm concentrations than wild‐type individuals. B) Sperm motility was found similar among the conditions. C) Car−/− individuals present more morphology abnormalities than wild‐type individuals. Inverse antagonist treatment induces a slight increase in abnormalities rates of wild‐type but not in Car−/− animals. D) These abnormalities are focused on the head, while in E) no abnormality of the flagella is observed among the different conditions. In all panels, n = 5 per group. Panels A‐E data are presented as horizontal box and whiskers plots and individual data points simultaneously. Statistical significance was assessed using an unpaired Student t‐test. Each group was compared individually with all other groups one by one. For each histogram, plots sharing different small letters represent statistically significant differences between the groups (p < 0.05), and plots with a common letter do not present statistically significant differences between the groups (p > 0.05). The corresponding statistical data can be found in Tables S1 and S2 (Supporting Information). F) Optical microscopy analysis showing for each condition sperm with typical (I‐IV) normal and (V‐VIII) abnormal morphology. E) Transmission electron microscopy analysis confirmed the morphology analysis with most of the sperm cells displaying normal (I‐IV) head and (V‐VIII) flagellum morphology.
Figure 12
Figure 12
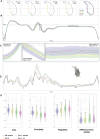
Fine nuclear morphology analysis of sperm cells from each condition. A) Consensus nuclear outlines for each condition and merged consensus nucleus (blue = W Wt veh, yellow = Wt IA, green = Car−/− veh, and pink = Car−/− IA). B) Angle profiles for each condition with focuses (black boxes) on specific positions. The abscissa is an index of the percentage of the total perimeter measured counterclockwise from the apex of the sperm hook. Ordinate represents the interior angle measured across a sliding window centered on each index location. C) Variability profiles of sperm cells from each condition. Abscissa is similar to the angle profile and the ordinate represents the InterQuartile Range (IQR, defined by the difference between the 75th and the 25th percentiles). Some regions of the nuclei are mapped on the profile and the graphical representation (from Skinner et al. 2019[ 55 ]) to ease reading. D) Violins plots of nuclear parameters. Statistical significance of differences between populations was automatically assessed using the software (Mann–Whitney U test, significantly different populations are identified by distinct letters). In all panels, n = 5 per group.
Figure 13
Figure 13
Analysis of fertility in 8‐month‐old adult males. A) Percentage of sterile Wt or Car−/− males. B) Number of pups per litter obtained from fertile Wt or Car−/− males. The blue line indicates the median of each group. C) Percentage of dead pups per litter obtained from fertile Wt or Car−/− males. The blue line indicates the median of each group. D) Percentage of litters with more than 20% of dead pups obtained from fertile Wt or Car−/− males. E) Percentage of sterile Wt or Car−/− males treated neonatally with the vehicle of IA. F) Number of pups per litter obtained from fertile Wt or Car−/− males treated neonatally with the vehicle of IA. The blue line indicates the median of each group. G) Percentage of dead pups per litter obtained from fertile Wt or Car−/− males treated neonatally with the vehicle of IA. The blue line indicates the median of each group. The blue line indicates the median of each group. H) Percentage of litters with more than 20% of dead pups obtained from fertile Wt or Car−/− males treated neonatally with the vehicle of IA. I) Correlation between the relative level of H3 in sperm cells and the relative percentage of dead pups per litter obtained from Wt and Car−/− mice. J) Correlation between the relative level of H3 in sperm cells and the relative percentage of dead pups per litter obtained from Wt and Car−/− mice neonatally treated with vehicle or IA. In A to D: The number of males in breeding was n = 39 for Wt and 24 for Car−/− mice. In D to H: The number of males Vehicle‐treated Wt n = 39 and IA‐treated Wt n = 43; Vehicle Car−/− n = 24 and n = 25 IA‐treated Car−/−; in K): n = 39 for Wt, 24 for Car−/− mice. In L): Wt n = 39 and IA‐treated Wt n = 43; Vehicle‐treated Car−/− n = 24 and IA‐treated Car−/− n = 25. In M): n = 26 for Wt veh; n = 24 for IA; n = 15 for Car−/− veh; and n = 15 for Car−/− IA. In all panels, Veh: vehicle and IA: Inverse agonist. In A, D, E, and H Xi2 analysis were performed. In B and C, T‐test was performed. In F and G, two‐way ANOVA followed by Holm–Sidak's test was performed for multiple comparisons. *p < 0.05 and ***p < 0.001 Wt vehicle‐treated male group. For correlation, the Pearson's test was performed.
Figure 14
Figure 14
A) Relative mRNA accumulations of Nanog, Gfra1, Thy1, Id4, Foxo1, Gata2, Tex19.1, Gadd45b, and Cdh1 normalized to β‐actin on Wt and CAR‐KO cells. The blue line indicates the median for each group. The Wt group was arbitrarily set at 1.B) Relative mRNA accumulations of Gfra1, Id4, and Foxo1 normalized to β‐actin on Wt and CAR‐KO cells treated with vehicle or IA. Analyses were performed at 3 h after treatment. The blue line indicates the median for each group. Vehicle‐treated groups of each genotype were arbitrarily set at 1. C) Relative mRNA accumulations of Gfra1, Id4, Foxo1, Cdh1, Gata2, Tex19.1, and Gadd45b normalized to β‐actin on Wt and CAR‐KO cells treated with vehicle or IA. Analyses were performed at 6 h after treatment. The blue line indicates the median for each group. Vehicle‐treated groups of each genotype were arbitrarily set at 1. D) Relative mRNA accumulations of Gfra1, Id4, Foxo1, Cdh1, Gata2, Tex19.1, and Gadd45b normalized to β‐actin on Wt and CAR‐KO cells treated with vehicle or IA. Analyses were performed 24 h after treatment. The blue line indicates the median for each group. Vehicle‐treated groups of each genotype were arbitrarily set at 1. In panel A, T‐tests were performed for comparison of two groups and in panels B to D, two‐way ANOVA followed by Holm–Sidak's test was performed for multiple comparisons. *p < 0.05, and ***p < 0.001, versus vehicle‐treated Wt males.
Figure 15
Figure 15
A) (Top panel) Representative western blots of Foxo1 in Wt and Car‐KO cells treated with vehicle or IA for 3 h. (Bottom panel) Quantification of ratios in Wt and Car‐KO cells. Normalization was performed against total protein using stain‐free gels. The blue line indicates the median for each group. Vehicle‐treated Wt cells were arbitrarily set at 1. Quantification of ratios in Wt and Car‐KO cells treated with vehicle or IA for 3 h. Normalization was performed against total protein using stain‐free gels. The blue line indicates the median for each group. Vehicle‐treated cellsof each genotype were arbitrarily set at 1. B) (Top panel) Representative western blots of Foxo1 Wt and Car‐KO cells treated with vehicle or IA for 24 h. (Bottom panel) Quantification of ratios in Wt and Car‐KO cells treated with vehicle or IA for 24 h. Normalization was performed against total protein using stain‐free gels. The blue line indicates the median for each group. Vehicle groups of each genotype were arbitrarily set at 1. In all panels, Veh: vehicle and IA: Inverse agonist. In panels A, n = 27 per group; in panel B n = 15 per group from five independent experiments. T‐test was performed for comparison of two groups and two‐way ANOVA followed by Holm–Sidak's test was performed for multiple comparisons. *p < 0.05, and ***p < 0.001, versus vehicle‐treated Wt males.
Figure 16
Figure 16
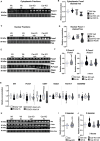
A) Representative western blots of Foxo1 on cytoplasmic compartments of Wt and Car‐KO cells treated with vehicle or IA for 3 h. B) Quantification of ratios of Foxo1/total proteins in cytoplasmic compartments of Wt and Car‐KO cells treated with vehicle or IA for 3 h. Normalization was performed against total protein using stain‐free gels. The blue line indicates the median for each group. Vehicle groups of each genotype were arbitrarily set at 1. C) Representative western blots of Foxo1 on the nuclear compartment of Wt and Car‐KO cells treated with vehicle or IA for 3 h. D) Quantification of ratios Foxo1/total proteins in nuclear compartments of Wt and Car‐KO cells treated with vehicle or IA for 3 h. Normalization was performed against total protein using stain‐free gels. The blue line indicates the median for each group. Vehicle groups of each genotype were arbitrarily set at 1. E) Representative western blots of Foxo1 and Phospho‐Foxo1 in Wt and Car‐KO cells treated with vehicle or IA for 3 h. F) (Left panel) Quantification of ratios P‐Foxo1/Foxo1 in Wt and Car‐KO cells in which normalization was performed against total protein using stain‐free gels and Wt vehicle cells were arbitrarily set at 1; and (Right panel) quantification of ratios P‐Foxo1/Foxo1 in Wt and Car‐KO cells treated with vehicle or IA for 3 h for which normalization was performed against total protein using stain‐free gels. The blue line indicates the median for each group. Vehicle groups of each genotype were arbitrarily set at 1. G) Relative mRNA accumulations of Id4, Foxo1, Cdh1, Gata2, Tex19.1, and Gadd45b normalized to β‐actin on Wt cells transfected with empty vector or a vector for overexpression of non‐phosphorylable Foxo1 (FOXO1‐AAA) treated with vehicle or IA for 24 h. The blue line indicates the median for each group. Vehicle‐treated groups of each condition of transfection (empty vector or pFOXO1‐AAA) were arbitrarily set at 1. H) Representative western blots of Akt and Phospho‐Akt in Wt and Car‐KO cells treated with vehicle or IA for 3 h. I) Quantification of ratios of P‐Akt/Akt in Wt and Car‐KO cells in which normalization was performed against total protein using stain‐free gels. The blue line indicates the median for each group. Wt vehicle cellsof each genotype were arbitrarily set at 1.J) Quantification of ratios P‐Akt/Akt in Wt and Car‐KO cells treated with vehicle or IA for 3 h and normalization was performed against total protein using stain‐free gels. The blue line indicates the median for each group. Vehicle groups of each genotype were arbitrarily set at 1.In all panels, Veh: vehicle and IA: Inverse agonist. In panels A to F and H, n = 25, and in panel G, n = 15 per group. T‐test was performed for comparison of two groups (panels F and I) Two‐way ANOVA followed by Holm–Sidak's test for multiple comparisons. *p < 0.05 and **p < 0.01 versus the respective vehicle group for each genotype or versus the respective vehicle group for the condition of transfection.
Figure 17
Figure 17
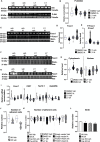
A) Representative western blots of Akt and Phospho‐Akt in Wt and Car‐KO cells treated with vehicle or LY (LY294002) for 45 min and then with vehicle or IA for 3 h. B) Quantification of ratios P‐Akt/Akt in Wt and Car‐KO cells treated with vehicle or LY (LY294002) for 45 min and then with vehicle or IA for 3 h. Normalization was performed against total protein using stain‐free gels. The blue line indicates the median for each group. Vehicle groups of each condition (DMSO or LY) were arbitrarily set at 1. C) Representative western blots of Foxo1 and Phospho‐Foxo1 in Wt and Car‐KO cells treated with vehicle or LY (LY294002) for 45 min and then with vehicle or IA for 3 h. D) Quantification of ratios Foxo1/total proteins in Wt and Car‐KO cells treated with vehicle or LY (LY294002) for 45 min and then with vehicle or IA for 3 h. The blue line indicates the median for each group. E) Quantification of ratios of P‐Foxo1/Foxo1 in Wt and Car‐KO cells treated with vehicle or LY (LY294002) for 45 min and then with vehicle or IA for 3 h. Normalization was performed against total protein using stain‐free gels. The blue line indicates the median for each group. Vehicle groups of each condition (DMSO or LY) were arbitrarily set at 1. F) Representative western blots of Foxo1 on cytoplasmic compartments of Wt and Car‐KO cells treated with vehicle or LY (LY294002) for 45 min and then with vehicle or IA for 3 h. G) Representative western blots of Foxo1 on the nuclear compartment of Wt and Car‐KO cells treated with vehicle or LY (LY294002) for 45 min then with vehicle or IA for 3 h. H) (Left panel) Quantification of cytoplasmic ratios of Foxo1/total proteins in Wt and Car‐KO cells treated with vehicle or LY (LY294002) for 45 min and then with vehicle or IA for 3 h. Normalization was performed against total protein using stain‐free gels and vehicle groups of each condition (DMSO or LY) were arbitrarily set at 1. (Right panel) Quantification of nuclear ratios of Foxo1/total proteins in Wt and Car‐KO cells treated with vehicle or LY (LY294002) for 45 min and then with vehicle or IA for 3 h. The blue line indicates the median for each group. Normalization was performed against total protein using stain‐free gels and vehicle groups of each condition (DMSO or LY) were arbitrarily set at 1. I) Relative mRNA accumulations of Foxo1, Gata2, Tex19.1, Gadd45b, and Cdh1 normalized to β‐actin on Wt and Car‐KO cells treated with vehicle or LY (LY294002) for 45 min and then with vehicle or IA for 3 h. The blue line indicates the median for each group. Vehicle groups of each condition (DMSO or LY) were arbitrarily set at 1. J) Relative number of adherent cells in Wt and Car‐KO cells. The blue line indicates the median for each group. Wt cells were arbitrarily set at 1. K) Relative number of adherent cells in Wt and Car‐KO cells treated with vehicle or IA for 24 h (Left part) for which vehicle groups of each genotype were arbitrarily set at 1; Relative number of adherent cells in Wt and Car‐KO cells treated with vehicle or LY (LY294002) for 45 min and then with vehicle or IA for 24 h (Middle part) for which vehicle groups of each condition (DMSO or LY) were arbitrarily set at 1; and Relative number of adherent cells in Wt cells transfected with empty vector or a vector for overexpression none phosphorylable Foxo1 (Foxo1‐AAA) and then treated with vehicle or IA for 24 h (Right part); vehicle groups of each condition (empty vector of Foxo1‐AAA) was arbitrarily set at 1. The blue line indicates the median for each group. L) Quantification of the relative number of BrdU positive in Wt and Car‐KO cells treated with vehicle or IA for 24 h. Vehicle‐treated cells were arbitrarily set at 1. M) Quantification of the relative number of TUNEL positive in Wt and Car‐KO cells treated with vehicle or IA for 24 h. The blue line indicates the median for each group. Vehicle‐treated cells were arbitrarily set at 1. In all panels Veh: vehicle and IA: Inverse agonist. n = 25 from six independent experiments. Two‐way ANOVA followed by Holm–Sidak's test for multiple comparisons; except for panel J in which T‐test was performed for comparison of two groups. In B to I: *p < 0.05 versus DMSO‐vehicle group. In J and L: *p < 0.05 versus Wt vehicle‐treated male group. The horizontal square brackets underline the groups statistically compared between two conditions of different genotypes. In K, the p < 0.05 is either versus Wt‐veh, DMSO‐veh or versus vehicle cells transfected with empty vector.
Figure 18
Figure 18
A) Representative western blots of H4 and Ac‐H4 in Wt and CAR‐KO cells treated with vehicle or IA for 3 h. B) Quantification of ratios Ac‐H4/H4 in Wt and Car‐KO cells treated with vehicle or IA for 3 h. Normalization was performed against total protein using stain‐free gels. The blue line indicates the median for each group. Wt vehicle group was arbitrarily set at 1. C) Quantification of ratios acH4/H4 in Wt and Car‐KO cells treated with vehicle or IA for 24 h. Normalization was performed against total protein using stain‐free gels. The blue line indicates the median for each group. Wt vehicle group was arbitrarily set at 1. D) Representative western blots of H4 and Ac‐H4 in Wt cells treated with vehicle or LY (LY294002) for 45 min and then with vehicle or IA for 3 h. E) Quantification of ratios Ac‐H4/H4 in Wt cells treated with vehicle or LY (LY294002) for 45 min and then with vehicle or IA for 3 h. Normalization was performed against total protein using stain‐free gels. The blue line indicates the median for each group. Vehicle groups of each condition (DMSO or LY) were arbitrarily set at 1. F) Representative western blots of H4 and Ac‐H4 in Wt cells transfected with an empty vector or a vector for overexpression of none phosphorylable Foxo1 (Foxo1‐AAA) and treated with vehicle or IA for 3 h. G) Quantification of ratios Ac‐H4/H4 in Wt cells transfected with empty vector or a vector for overexpression of none phosphorylable Foxo1 (Foxo1‐AAA) and treated with vehicle or IA for 3 h. Normalization was performed against total protein using stain‐free gels. The blue line indicates the median for each group. Vehicle groups transfected with empty vector or Foxo1‐AAA were arbitrarily set at 1. In all panels, Veh: vehicle and IA: Inverse agonist. In all panels, n = 25 from six independent experiments. Two‐way ANOVA followed by Holm–Sidak's test for multiple comparisons. B and C: *p < 0.05 versus Wt vehicle‐treated group. In E *p < 0.05 versus DMSO‐vehicle‐treated cells group. In G, *p < 0.05 versus vehicle cells transfected with empty vector.

References

    1. Agarwal A., Mulgund A., Hamada A., Chyatte M. R., Reprod. Biol. Endocrinol. 2015, 13, 37. - PMC - PubMed
    1. Sharlip I. D., Jarow J. P., Belker A. M., Lipshultz L. I., Sigman M., Thomas A. J., Schlegel P. N., Howards S. S., Nehra A., Damewood M. D., Overstreet J. W., Sadovsky R., Fertil. Steril. 2002, 77, 873. - PubMed
    1. de Rooij D. G., Reproduction 2001, 121, 347. - PubMed
    1. Oatley J. M., Brinster R. L., Physiol. Rev. 2012, 92, 577. - PMC - PubMed
    1. Siklenka K., Erkek S., Godmann M., Lambrot R., McGraw S., Lafleur C., Cohen T., Xia J., Suderman M., Hallett M., Trasler J., Peters A. H. F. M., Kimmins S., Science 2015, 350, aab2006. - PubMed

MeSH terms

Substances

LinkOut - more resources