. 2025 Jan;169(1):e16225.
doi: 10.1111/jnc.16225. Epub 2024 Sep 25.

The longitudinal behavioral effects of acute exposure to galactic cosmic radiation in female C57BL/6J mice: Implications for deep space missions, female crews, and potential antioxidant countermeasures

Affiliations

The longitudinal behavioral effects of acute exposure to galactic cosmic radiation in female C57BL/6J mice: Implications for deep space missions, female crews, and potential antioxidant countermeasures

Sanghee Yun et al. J Neurochem. 2025 Jan.

Abstract

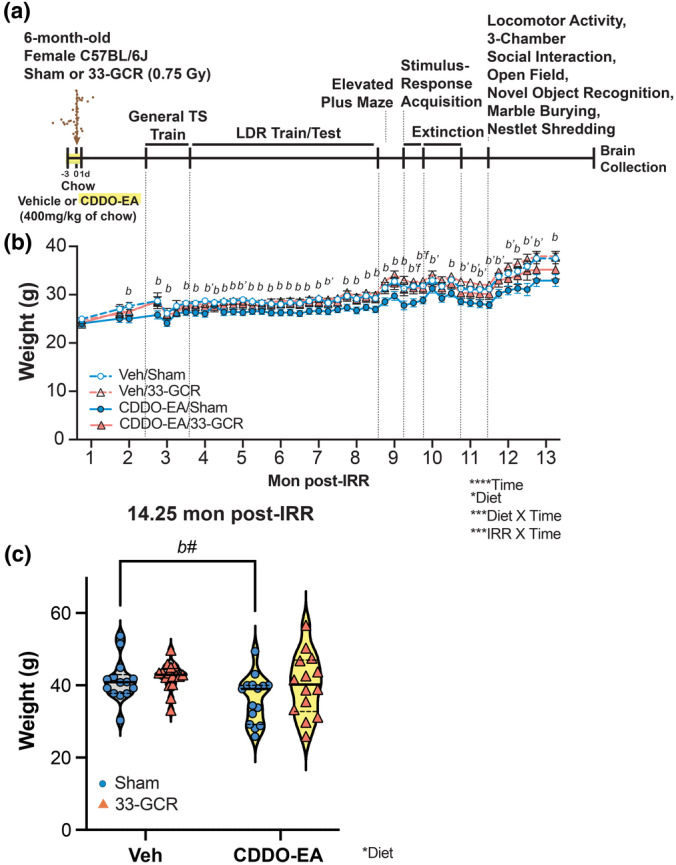
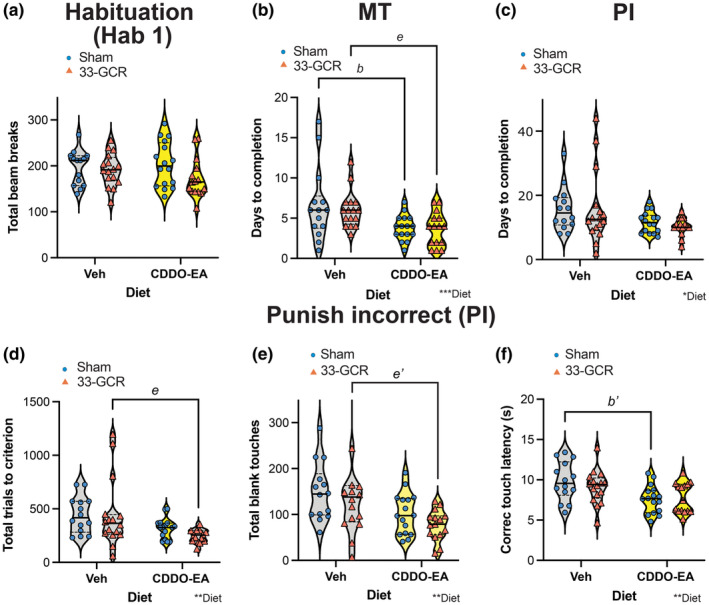
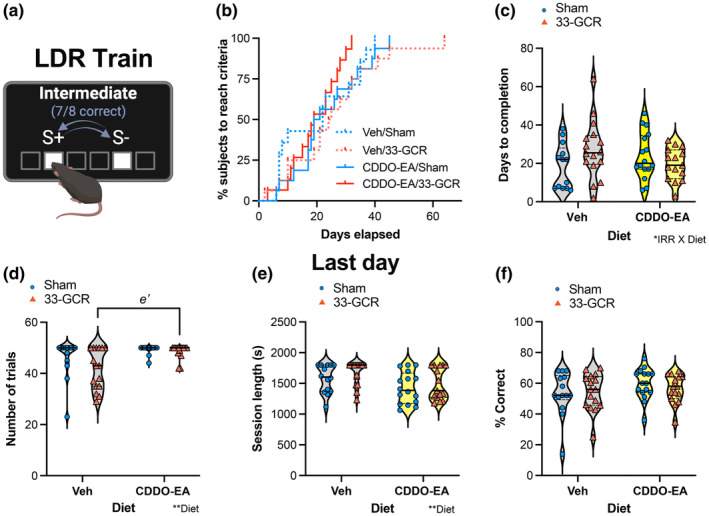
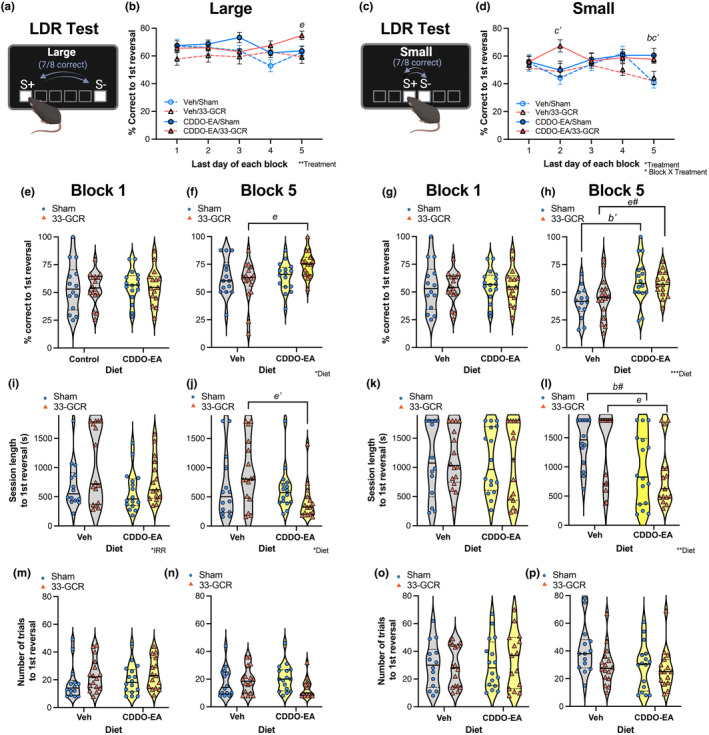
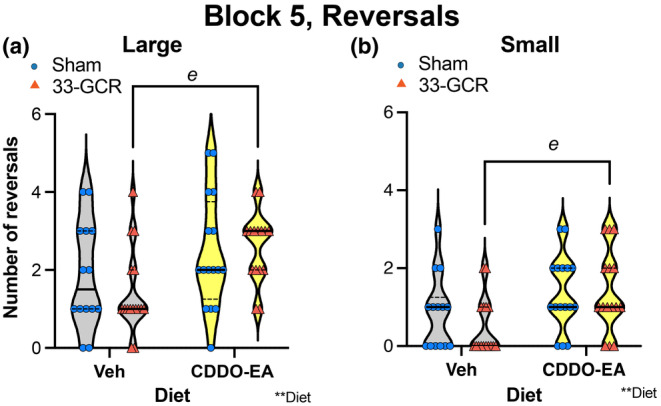
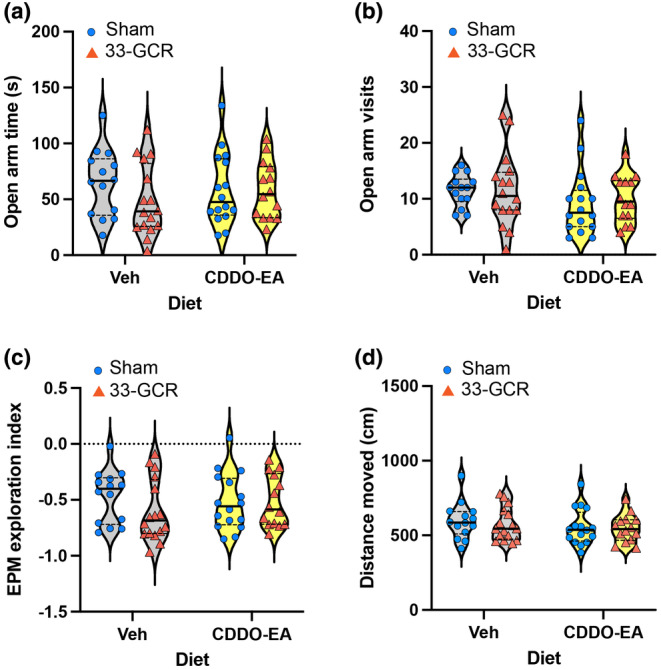
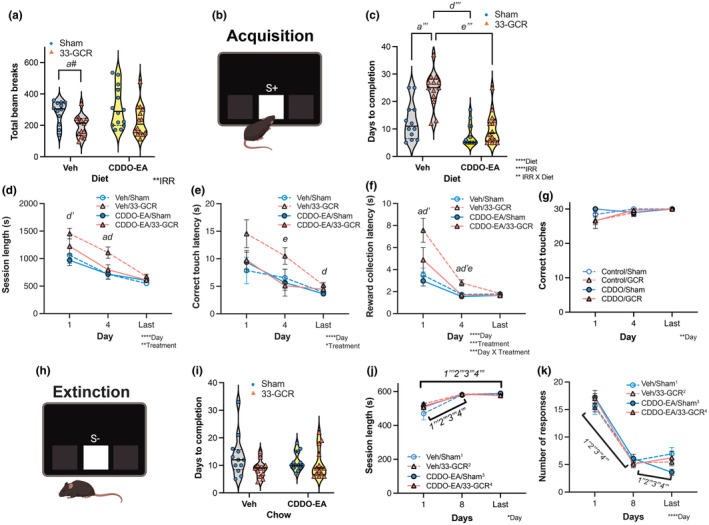
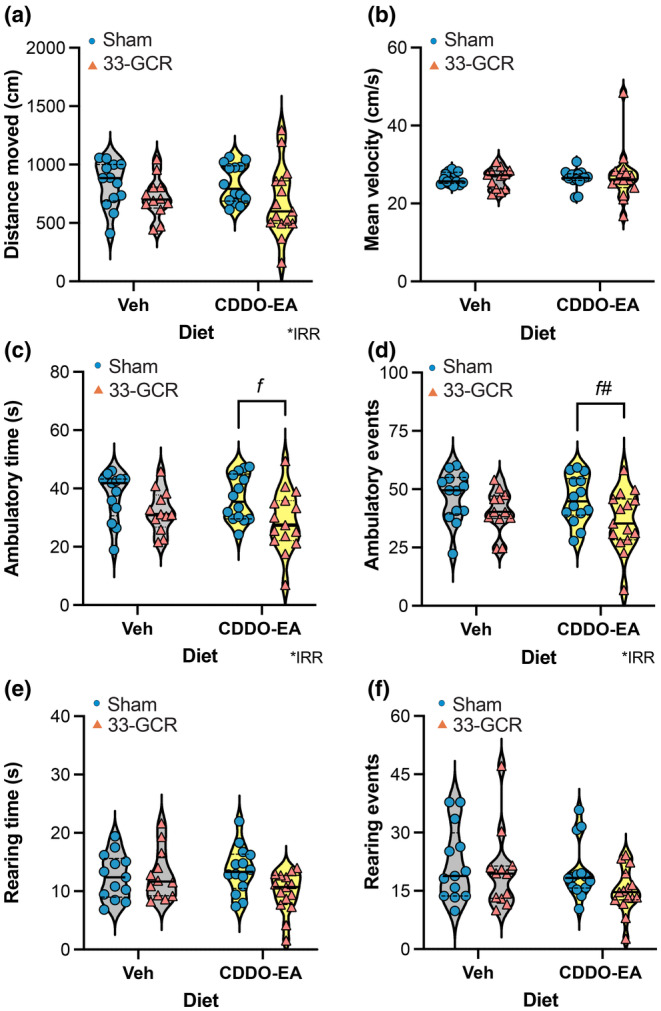
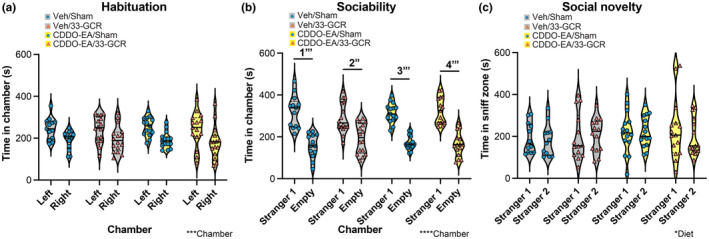
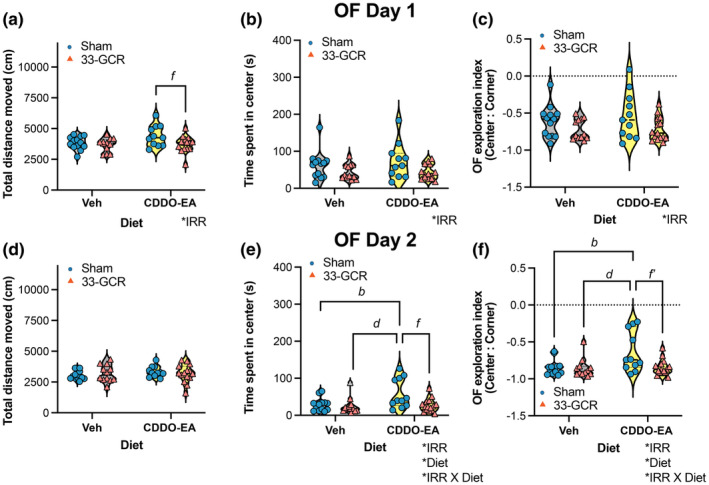
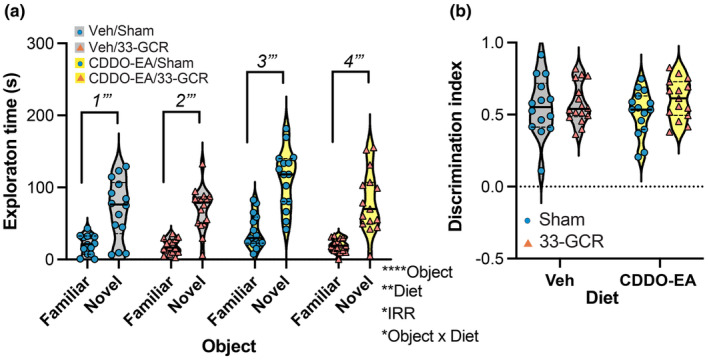
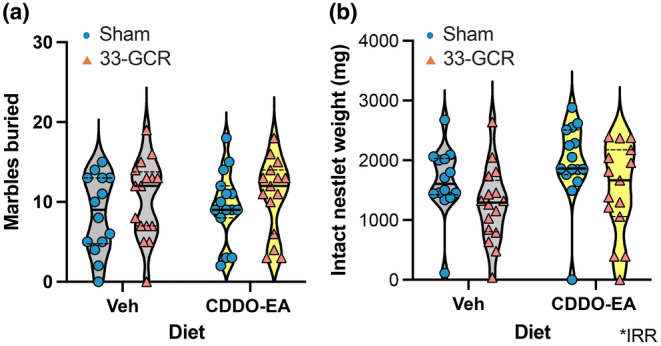
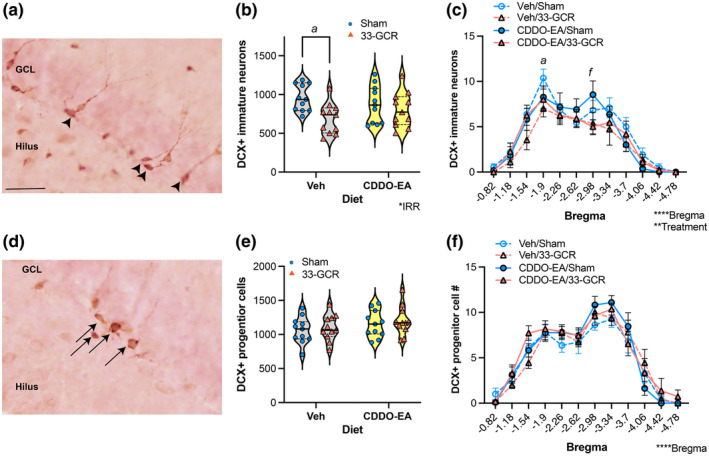
Galactic cosmic radiation (GCR) is an unavoidable risk to astronauts that may affect mission success. Male rodents exposed to 33-beam-GCR (33-GCR) show short-term cognitive deficits but reports on female rodents and long-term assessment are lacking. We asked: What are the longitudinal behavioral effects of 33-GCR on female mice? Also, can an antioxidant/anti-inflammatory compound (CDDO-EA) mitigate the impact of 33-GCR? Mature (6-month-old) C57BL/6J female mice received CDDO-EA (400 μg/g of food) or a control diet (vehicle, Veh) for 5 days and Sham-irradiation (IRR) or whole-body 33-GCR (0.75Gy) on the 4th day. Three-months post-IRR, mice underwent two touchscreen-platform tests: (1) location discrimination reversal (tests behavior pattern separation and cognitive flexibility, abilities reliant on the dentate gyrus) and (2) stimulus-response learning/extinction. Mice then underwent arena-based behavior tests (e.g. open field, 3-chamber social interaction). At the experiment's end (14.25-month post-IRR), an index relevant to neurogenesis was quantified (doublecortin-immunoreactive [DCX+] dentate gyrus immature neurons). Female mice exposed to Veh/Sham vs. Veh/33-GCR had similar pattern separation (% correct to 1st reversal). There were two effects of diet: CDDO-EA/Sham and CDDO-EA/33-GCR mice had better pattern separation vs. their respective control groups (Veh/Sham, Veh/33-GCR), and CDDO-EA/33-GCR mice had better cognitive flexibility (reversal number) vs. Veh/33-GCR mice. One radiation effect/CDDO-EA countereffect also emerged: Veh/33-GCR mice had slower stimulus-response learning (days to completion) vs. all other groups, including CDDO-EA/33-GCR mice. In general, all mice showed normal anxiety-like behavior, exploration, and habituation to novel environments. There was also a change relevant to neurogenesis: Veh/33-GCR mice had fewer DCX+ dentate gyrus immature neurons vs. Veh/Sham mice. Our study implies space radiation is a risk to a female crew's longitudinal mission-relevant cognitive processes and CDDO-EA is a potential dietary countermeasure for space-radiation CNS risks.

Keywords: CDDO‐EA; Mars‐relevant; arena‐based classical rodent behavioral tests; hippocampus; space radiation; touchscreen operant behavior.


Conflict of interest statement

The authors have no conflict of interests to declare.

Figures

FIGURE 1
FIGURE 1
Female C57BL/6J mice given the antioxidant/anti‐inflammatory agent CDDO‐EA chow and exposed to Sham IRR weighed slightly less than Veh/Sham mice from 2 month post‐IRR onward. This lower weight was not seen in CDDO‐EA/33‐GCR mice. (a) Timeline of experiment. Female mice from Jackson Laboratory were delivered to Brookhaven National Laboratory (BNL) at 6‐months (mon) of age. After acclimation to the BNL animal housing facilities, mice were given CDDO‐EA (400 mg/kg of food) in chow or vehicle chow (Veh) for 5 days. On Day 4 of CDDO‐EA or Veh diet, mice were exposed to one of two IRR conditions: Whole‐body 33‐GCR (0.75 Gy) or Sham IRR. Mice were then shipped to Children's Hospital of Philadelphia Research Institute where they underwent general training on a touchscreen (TS) platform followed by a task to assess behavioral pattern separation, Location Discrimination Reversal (LDR) and a simple stimulus–response learning and extinction learning. Mice then went through a series of classical arena‐based behavioral tests prior to brain collection at 14.25 mon. (b) Body weight of mice over the course of experiment. (c) Weight at 14.25 mon. Statistical analysis in B: Mixed effected three‐way RM ANOVA (IRR × Diet × Time); in C: Two‐way ANOVA (IRR × Diet). Main effect and/or interaction are denoted by *p < 0.05, **p < 0.01, ***p < 0.001, ****p < 0.0001; post‐hoc multiple comparison analysis significance denotations between groups: Veh/Sham versus CDDO‐EA/Sham, b p < 0.05, b’ p < 0.01, b# = 0.065; CDDO‐EA/Sham versus CDDO‐EA/33‐GCR, f p < 0.05. 14–16 mice per group. Dotted vertical lines indicate the point on the behavioral timeline where weight was recorded in B and violin plots depict median (solid line) and 25% and 75% quartiles (dotted line) in (c). Complete subject numbers and detailed data analysis are provided in Table S1.
FIGURE 2
FIGURE 2
Two and one‐half mon post‐IRR, total beam breaks in a novel touchscreen operant chamber were similar among all groups, but some measures of general touchscreen performance were decreased by CDDO‐EA, suggesting improved/faster learning. (a) Beam breaks in novel environment. This is the first time the mice were ever in the touchscreen chamber (the 10‐min Habituation 1 [Hab1]). (b, c) Days to Completion for general touchscreen training phases must touch (MT) and punish incorrect (PI). (d–f) Measures relevant to accuracy from PI. Trials to reach criteria (d), Blank touches (e). Correct touches (f). Statistical analysis in a–f: Two‐way ANOVA (Diet × IRR). Main effect and interaction are denoted by *p < 0.05, **p < 0.01, ***p < 0.001, post‐hoc multiple comparison analysis significance denotations between groups: Veh/Sham versus CDDO‐EA/Sham, b p < 0.05 and b’ p < 0.01; Veh/33‐GCR versus CDDO‐EA/33‐GCR, e p < 0.05 and e’ p < 0.01. 14–16 mice per group. IRR, irradiation. a–e: Veh, vehicle. Violin plots depict median (solid line) and 25% and 75% quartiles (dotted line). Complete subject numbers and detailed data analysis are provided in Table S1.
FIGURE 3
FIGURE 3
Three months post‐IRR, performance in location discrimination reversal training (LDR Train) was generally similar among all groups. (a) LDR Train touchscreen set‐up. Schematic of the lit squares and their “Intermediate” separation which were used for LDR Train. After a subject made 7 out of 8 correct touches, the windows indicated as S+ and S− switched. (b) Percent of subjects reaching LDR Train criteria over time. The percent of each group to reach criteria for LDR Train was similar among groups. (c) Days to completion for LDR Train. For the number of days it took each group to reach LDR Train completion, there was an IRR × Diet interaction but no post‐hoc significance. (d–f) LDR Train performance metrics on the day each mouse reached criteria (“Last Day”). Number of trials completed (d). Session length (e). Percent correct (f). Violin plots depict median (solid line) and 25% and 75% quartiles (dotted line). Statistical analysis in (b): Long‐rank (Mantel‐Cox) test, with a Kaplan–Meier completion graph and (c–f): Two‐way ANOVA (Diet × IRR). Main effect and/or interaction are denoted by *p < 0.05, **p < 0.01, post‐hoc multiple comparison analysis significance denotations between groups: Veh/33‐GCR versus CDDO‐EA/33‐GCR, e’ p < 0.01. Violin plots depict median (solid line) and 25% and 75% quartiles (dotted line). 14–16 mice per group. IRR, irradiation. Non‐rewarding stimulus, S−, a touch to this lit square did not result in a reward. Rewarding stimulus, S+, a touch to this lit square resulted in a reward. Veh, vehicle. Complete subject numbers and detailed data analysis are provided in Table S1.
FIGURE 4
FIGURE 4
By the end of the 24‐day LDR Test, CDDO‐EA/33‐GCR mice showed better discrimination versus Veh/33‐GCR mice, and CDDO‐EA mice (regardless of IRR) showed better pattern separation vs. Veh mice. (a, b) Schematic of the lit squares in LDR Test with Large separation (a) and accuracy to 1st reversal over 5 blocks in Large separation (b). Large separation prior to the 1st reversal in LDR Test is considered a test of Discrimination because of the “load low” from the high resolution of the two, maximally separated squares. (c, d) Schematic of the lit squares in LDR Test with Small separation (c) and accuracy to 1st reversal over 5 blocks in Small separation (d). Small separation prior to the 1st reversal in LDR Test is considered a test of Pattern Separation because of the “high load” from the low resolution of the two, minimally separated squares. (e–p) Metrics of Discrimination (Large separation, e, f, i, j, m, n) and Pattern Separation (Small separation, g, h, k, l, o, p) in LDR test were analyzed in Block 1 (e, i, m, g, k, o) and separately in Block 5 (f, j, n, h, l, p) based on accuracy (e–h), session length (i–l), and trial number to the 1st reversal (m–p). Large separation, Block 1, accuracy (e). Large separation, Block 5, accuracy (f). Small separation, Block 1, accuracy (g). Small separation, Block 5, accuracy (h). Large separation, Block 1, session length (i). Large separation, Block 5, session length (j). Small separation, Block 1, session length (k). Small separation, Block 5, session length (l). Large separation, Block 1, trial number to the 1st reversal (m). Large separation, Block 5, trial number to the 1st reversal (n). Small separation, Block 1, trial number to the 1st reversal (o). Small separation, Block 5, trial number to the 1st reversal (p). Statistical analysis in (b, d): Two‐way RM measures ANOVA (Block × Treatment), main effect and an interaction followed by Tukey's post‐hoc and (e–p): Two‐way ANOVA (Diet × IRR), main effect and interaction followed by Bonferroni's post‐hoc test. Main effects and/or interaction are denoted by *p < 0.05, **p < 0.01, ***p < 0.001. Post‐hoc multiple comparison analysis significance denotations between groups: Veh/Sham vs. CDDO‐EA/Sham, b# 0.05 < p < 0.08, b p < 0.05, b’ p < 0.01; Veh/Sham vs. CDDO‐EA/33‐GCR, c’ p < 0.01; Veh/33‐GCR vs. CDDO‐EA/33‐GCR, e# 0.05 < p < 0.08, e p < 0.05, e’ p < 0.01. 14–16 mice per group. Non‐rewarding stimulus, S−, a touch to this lit square did not result in a reward. Rewarding stimulus, S+, a touch to this lit square resulted in a reward. IRR, irradiation. Veh, vehicle. Violin plots depict median (solid line) and 25% and 75% quartiles (dotted line). Complete subject numbers and detailed data analysis are provided in Table S1.
FIGURE 5
FIGURE 5
By the end of LDR Test (and 3–8.5 mon post‐IRR), cognitive flexibility was improved by CDDO‐EA during IRR exposure. Number of reversals on the Last Day of the last block (Block 5) of LDR Test under conditions of Large (a) and Small (b) separation. (a) Large separation. (b) Small separation. Two‐way ANOVA (IRR × Diet), main effect and/or interaction followed by Bonferroni's post‐hoc test. Main effects are denoted by **p < 0.01. Post‐hoc multiple comparison analysis significance denotations between groups: Veh/33‐GCR versus CDDO‐EA/33‐GCR, e p < 0.05. 14–16 mice per group. IRR, irradiation. Veh, vehicle. Violin plots depict median (solid line) and 25% and 75% quartiles (dotted line). Complete subject numbers and detailed data analysis are provided in Table S1.
FIGURE 6
FIGURE 6
Eight months post‐IRR, anxiety‐like behavior on the elevated plus maze (EPM) was similar among all groups. (a–d) EPM metrics of (a) time in open arms, (b) visits to open arms, (c) exploration index (time spent in open versus closed arms), and (d) distance moved. Two‐way ANOVA (IRR × Diet), main effects and interaction are all p > 0.05 in (a–d). 14–16 mice per group. IRR, irradiation. Veh, vehicle. Violin plots depict median (solid line) and 25% and 75% quartiles (dotted line). Complete data analysis details are provided in Table S1.
FIGURE 7
FIGURE 7
9.25 months post‐IRR, 33‐GCR decreased locomotion in a familiar environment and acquisition of a simple stimulus–response learning task, and CDDO‐EA appeared to counter the 33‐GCR effects. No effect was seen on subsequent extinction learning. (a) Beam breaks in familiar operant environment. Mice were reintroduced to the touchscreen chamber (10‐min Habituation 1 [Hab1]) 3 weeks post‐LDR to measure locomotion activity via beam breaks. (b) Schematic of simple stimulus–response learning, “acquisition (Acq)”. The middle‐lit square (S+) was the conditioned stimulus. Touches to S+ led to reward delivery, while touches to blank areas on either side of S+ did not. (c) Days to complete (acquire) simple stimulus–response learning. Mice are run for 30 min, but only the first 15‐min are considered for these data. (d–f) Acq metrics were analyzed in the 1st, 4th, and Last Day based on session length (d), correct touch latency (e), and reward collection latency (f) Note that (d–g) are from the first 30‐min of each session. (d) Acq session length. (e) Acq correct touch latency. (f) Acq reward collection latency. (g) Acq correct touches. (h) Schematic of a middle‐lit square (S−) in extinction learning. (i–k) Measures of Ext after a simple‐response learning based on days to completion (i), session length (j), and response number (#; k). (i) Ext days to completion. (j) Ext session length. (k) Ext number of responses. Statistical analysis: (a, c, i) Two‐way ANOVA (Diet × IRR); (d, j, k) Two‐way RM (Day × Treatment); (e–g) Mixed Effects 2‐way RM ANOVA (Day × Treatment). Main effects and interaction are denoted by *p < 0.05, **p < 0.01, ***p < 0.001, or ****p < 0.0001. Bonferroni (a) or Tukey (c–g) post‐hoc multiple comparison analysis significance denotations between groups: Veh/Sham vs. Veh/33‐GCR, a# 0.08 < p < 0.05, a p < 0.05, a”’ p < 0.001; Veh/33‐GCR vs. CDDO‐EA/Sham, d p < 0.05, d’ p < 0.01, d”’ p < 0.001; Veh/33‐GCR vs. CDDO‐EA/33‐GCR, e p < 0.05, e”’ p < 0.001; CDDO‐EA/Sham vs. CDDO‐EA/33‐GCR, f# 0.08 < p < 0.05. Tukey (j, k) post‐hoc analysis significance denotations between days within a given group: 1 = within Veh/Sham, 2 = within Veh/33‐GCR; 3 = within CDDO‐EA/Sham; 4 = within CDDO‐EA/33‐GCR with = p < 0.001 and ’ = p < 0.0001. IRR, irradiation. Veh, vehicle. Violin plots (a, c, i) depict median (solid line) and 25% and 75% quartiles (dotted line). 12–14 mice per group. Complete subject numbers and detailed data analysis are provided in Table S1.
FIGURE 8
FIGURE 8
Eleven and one‐half mon post‐IRR, locomotor activity in a novel environment was grossly similar among groups. (a–f) Mice were introduced into a sound‐proof square chamber for 30 min and locomotion metrics were measured by broken infrared beams (a) Total distance moved. (b) Mean velocity. (c) Ambulatory time (seconds, s). (d) Ambulatory events. (e) Rearing time (s). (f) Rearing events. (a–f) Two‐way ANOVA (Diet × IRR). Main effect is denoted by *p < 0.05. Bonferroni post‐hoc multiple comparison analysis significance denotations between groups: CDDO‐EA/Sham vs. CDDO‐EA/33‐GCR, f p < 0.05, f# 0.08 < p < 0.05. 12–15 mice per group.IRR, irradiation. Veh, vehicle. Violin plots depict median (solid line) and 25% and 75% quartiles (dotted line). Complete data analysis details are provided in Table S1.
FIGURE 9
FIGURE 9
11.75 mon post‐IRR, measures in the three‐chamber sociability interaction (3‐CSI) task are similar among groups. (a) 3‐CSI habituation trial. (b) 3‐CSI sociability trial reflecting time spent in the chamber containing a novel conspecific mouse in an enclosure (Stranger 1) and the chamber containing an empty enclosure (Empty). (c) 3‐CSI social novelty trial reflecting time spent in the sniff zone around a now‐familiar conspecific mouse in an enclosure (Stranger 1) and a novel conspecific mouse in the opposite enclosure (Stranger 2). Three‐way ANOVA (Chamber × Diet × IRR). Main effects are denoted by *p < 0.05, ***p < 0.001, or ****p < 0.0001. 12–16 mice per group. IRR, irradiation. Veh, vehicle. Violin plots depict median (solid line) and 25% and 75% quartiles (dotted line). Complete data analysis details are provided in Table S1.
FIGURE 10
FIGURE 10
12 mon post‐IRR, CDDO‐EA/33‐GCR mice showed less exploration in a novel, bright open field (OF) relative to CDDO‐EA/Sham mice. In contrast, in a familiar OF CDDO‐EA/Sham mice showed greater exploration relative to all other groups. (a–f) OF metrics on Day 1 (a–c) and Day 2 (d–f). (a) Day 1, distance moved. (b) Day 1, center time. (c) Day 1, OF exploration index. (d) Day 2, distance moved. (e) Day 2, center time. (f) Day 2, OF exploration index. Two‐way ANOVA (Diet × IRR). Main effects are denoted by *p < 0.05. Bonferroni post‐hoc multiple comparison analysis significance denotations between groups: Veh/Sham vs. CDDO‐EA/Sham, b p < 0.05. CDDO‐EA/Sham vs. CDDO‐EA/33‐GCR, d p < 0.05. CDDO‐EA/Sham vs. CDDO‐EA/33‐GCR, f# 0.08 < p < 0.05, f p < 0.05. 11–15 mice per group IRR, irradiation. Veh, vehicle. Violin plots depict median (solid line) and 25% and 75% quartiles (dotted line). Complete data analysis details are provided in Table S1.
FIGURE 11
FIGURE 11
12.5 mon post‐IRR, mice in all groups recognized novel objects, and they discriminated between novel and familiar objects to a similar extent. (a) Time spent exploring a novel versus familiar object. (b) Object discrimination index. (a) Three‐way ANOVA (Object × Diet × IRR). Main effects and interactions are denoted by *p < 0.05, ****p < 0.0001. Bonferroni post‐hoc multiple comparison analysis significance denotations between objects for a given group: 1 = within Veh/Sham, 2 = within Veh/33‐GCR; 3 = within CDDO‐EA/Sham; 4 = within CDDO‐EA/33‐GCR with =p < 0.001 and ’ = p < 0.0001. (b) Two‐way ANOVA (Diet × IRR). IRR, irradiation. s, seconds. Veh, vehicle. Violin plots depict median (solid line) and 25% and 75% quartiles (dotted line). 14–16 mice per group. Complete data analysis details are provided in Table S1.
FIGURE 12
FIGURE 12
13 mon post‐IRR, all groups of mice showed similar measures in tests of compulsive behavior. (a) Number of marbles buried. (b) Weight of intact nestlet. (a, b) Two‐way ANOVA (Diet × IRR). 14–16 mice per group IRR, irradiation. Veh, vehicle. Violin plots depict median (solid line) and 25% and 75% quartiles (dotted line). Complete data analysis details are provided in Table S1.
FIGURE 13
FIGURE 13
14.25 mon post‐IRR, Veh/33‐GCR mice had fewer doublecortin‐immunoreactive (DCX+) immature neurons in the dentate gyrus (DG) subgranular zone (SGZ) vs. Veh/Sham mice, but all groups had a similar number of DCX+ progenitors. (a–c) DCX+ immature neurons and (d–f) DCX+ progenitor cells in the DG SGZ. (a) Representative photomicrograph of DCX+ immature neurons. Arrowheads indicate brown‐stained DCX+ immature neuron soma in the SGZ at the border of the DG granule cell layer (GCL) and the DG hilus. (b) Number of DCX+ immature neurons represented as a single value per mouse. (c) Number of DCX+ immature neurons represented as a single value for each distance from bregma. (d) Representative photomicrograph of DCX+ progenitor cells. Arrows indicate brown‐stained DCX+ progenitor cell soma in the SGZ. (e) Number of DCX+ progenitor cells represented as a single value per mouse. (f) Number of DCX+ progenitor cells represented as a single value for each distance from bregma. (b, e) Two‐way ANOVA (Diet × IRR). Main effects and interactions are denoted by *p < 0.05. Bonferroni post‐hoc multiple comparison analysis significance denotations between groups: Veh/Sham versus Veh/33‐GCR, a p < 0.05, CDDO/Sham versus CDDO/GCR, f p < 0.05. (c, f) Two‐way ANOVA (Bregma × Treatment). Bonferroni post‐hoc. +, immunoreactive. Scale bar in (a) = 100 μm, applies to (a, d). 11 mice per group. IRR, irradiation. Veh, vehicle. Violin plots (b, e) depict median (solid line) and 25% and 75% quartiles (dotted line). Complete data analysis details are provided in Table S1.

Update of

Similar articles

Cited by

References

    1. Alaghband, Y. , Klein, P. M. , Kramár, E. A. , Cranston, M. N. , Perry, B. C. , Shelerud, L. M. , Kane, A. E. , Doan, N. L. , Ru, N. , Acharya, M. M. , Wood, M. A. , Sinclair, D. A. , Dickstein, D. L. , Soltesz, I. , Limoli, C. L. , & Baulch, J. E. (2023). Galactic cosmic radiation exposure causes multifaceted neurocognitive impairments. Cellular and Molecular Life Sciences, 80, 29. - PMC - PubMed
    1. Allen, A. R. , Raber, J. , Chakraborti, A. , Sharma, S. , & Fike, J. R. (2015). 56Fe irradiation alters spine density and dendritic complexity in the mouse hippocampus. Radiation Research, 184, 586–594. - PubMed
    1. Bechard, A. , Meagher, R. , & Mason, G. (2011). Environmental enrichment reduces the likelihood of alopecia in adult C57BL/6J mice. Journal of the American Association for Laboratory Animal Science, 50, 171–174. - PMC - PubMed
    1. Bellone, J. A. , Rudobeck, E. , Hartman, R. E. , Szücs, A. , & Vlkolinský, R. (2015). A single low dose of proton radiation induces long‐term behavioral and electrophysiological changes in mice. Radiation Research, 184, 193–202. - PubMed
    1. Blackwell, A. A. , Fesshaye, A. , Tidmore, A. I. , Lake, R. , Wallace, D. G. , & Britten, R. A. (2022). Rapid loss of fine motor skills after low dose space radiation exposure. Behavioural Brain Research, 430, 113907. - PubMed