

Latent profiles of global electrical heterogeneity: the Hispanic Community Health Study/Study of Latinos
- PMID: 39318685
- PMCID: PMC11417492
- DOI: 10.1093/ehjdh/ztae048
Latent profiles of global electrical heterogeneity: the Hispanic Community Health Study/Study of Latinos
Abstract
Aims: Despite the highest prevalence of stroke, obesity, and diabetes across races/ethnicities, paradoxically, Hispanic/Latino populations have the lowest prevalence of atrial fibrillation and major Minnesota code-defined ECG abnormalities. We aimed to use Latent Profile Analysis in the Hispanic Community Health Study/Study of Latinos (HCHS/SOL) population to obtain insight into epidemiological discrepancies.
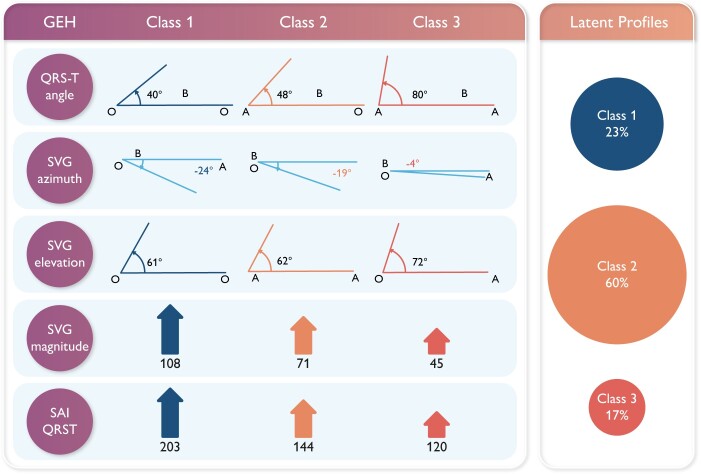
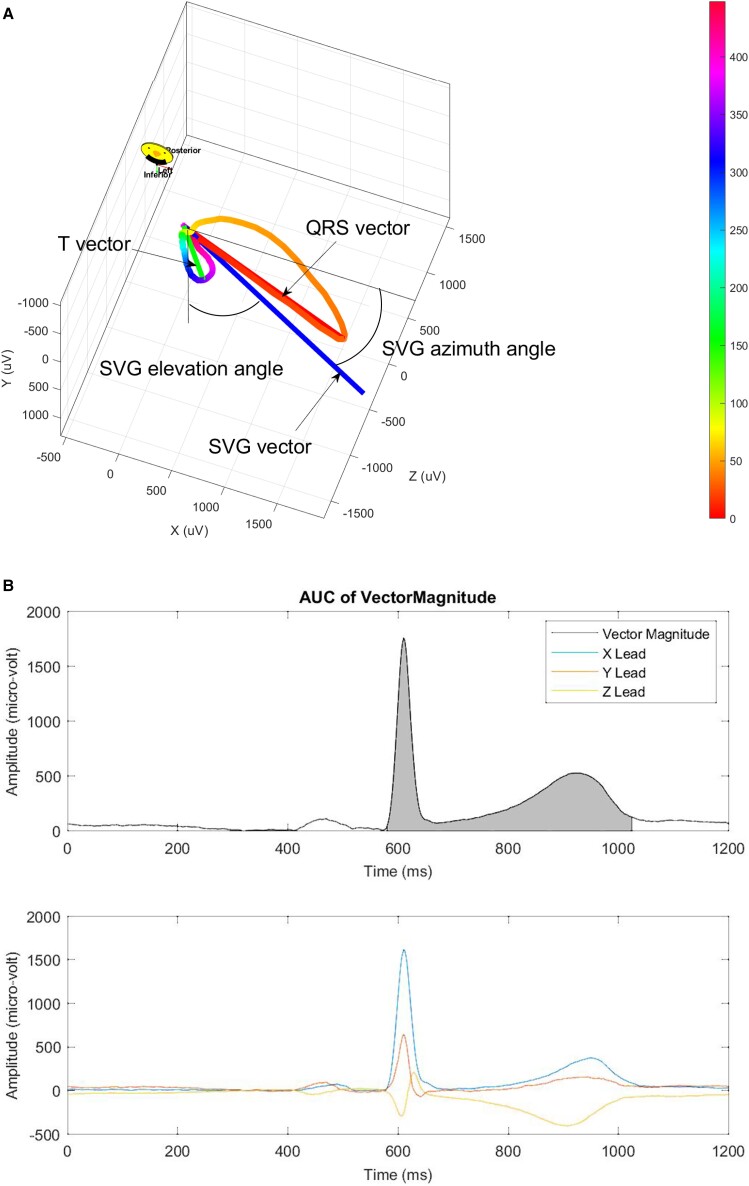
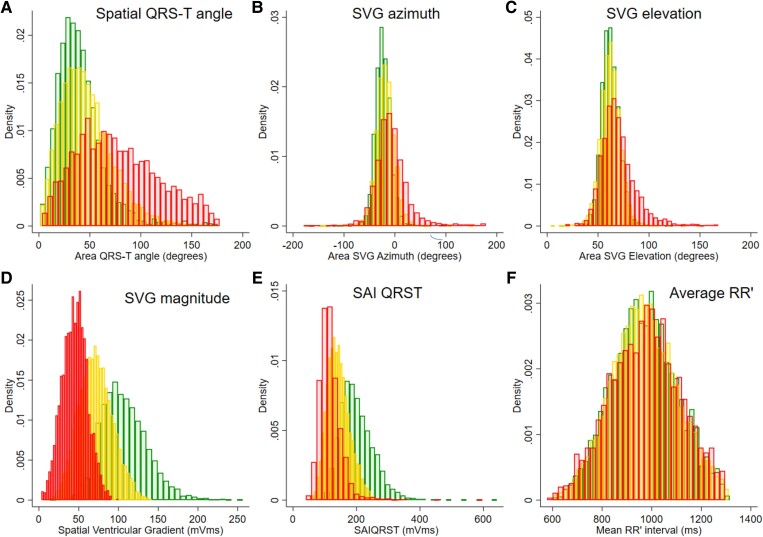
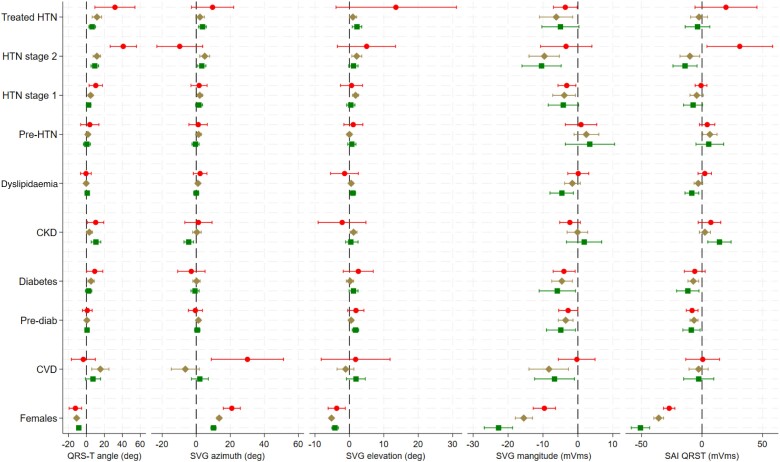
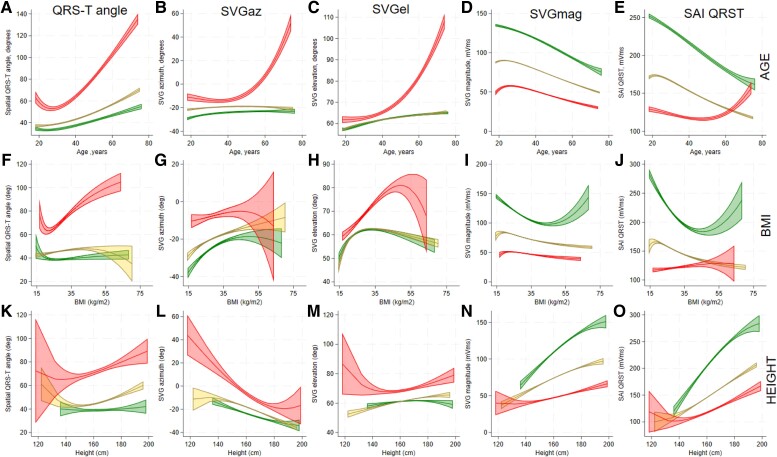
Methods and results: We conducted a cross-sectional analysis of baseline HCHS/SOL visit. Global electrical heterogeneity (GEH) was measured as spatial QRS-T angle (QRSTa), spatial ventricular gradient azimuth (SVGaz), elevation (SVGel), magnitude (SVGmag), and sum absolute QRST integral (SAIQRST). Statistical analysis accounted for the stratified two-stage area probability sample design. We fitted a multivariate latent profile generalized structural equation model adjusted for age, sex, ethnic background, education, hypertension, diabetes, smoking, dyslipidaemia, obesity, chronic kidney disease, physical activity, diet quality, average RR' interval, median beat type, and cardiovascular disease (CVD) to gain insight into the GEH profiles. Among 15 684 participants (age 41 years; 53% females; 6% known CVD), 17% had an increased probability of likely abnormal GEH profile (QRSTa 80 ± 27°, SVGaz -4 ± 21°, SVGel 72 ± 12°, SVGmag 45 ± 12 mVms, and SAIQRST 120 ± 23 mVms). There was a 23% probability for a participant of being in Class 1 with a narrow QRSTa (40.0 ± 10.2°) and large SVG (SVGmag 108.3 ± 22.6 mVms; SAIQRST 203.4 ± 39.1 mVms) and a 60% probability of being in intermediate Class 2.
Conclusion: A substantial proportion (17%) in the Hispanic/Latino population had an increased probability of altered, likely abnormal GEH profile, whereas 83% of the population was resilient to harmful risk factors exposures.
Keywords: Cardiovascular risk; ECG; Electrophysiology; Hispanic or Latino ethnicity; Latent class analysis; Vectorcardiogram.
© The Author(s) 2024. Published by Oxford University Press on behalf of the European Society of Cardiology.
Conflict of interest statement
Conflict of interest: none declared.
Figures
Similar articles
-
Electrical Heterogeneity in Hispanic Background Subpopulations: The HCHS/SOL.JACC Adv. 2024 Sep 11;3(12):101225. doi: 10.1016/j.jacadv.2024.101225. eCollection 2024 Dec. JACC Adv. 2024. PMID: 39817081 Free PMC article.
-
Reproducibility of global electrical heterogeneity measurements on 12-lead ECG: The Multi-Ethnic Study of Atherosclerosis.J Electrocardiol. 2021 Nov-Dec;69:96-104. doi: 10.1016/j.jelectrocard.2021.09.014. Epub 2021 Oct 2. J Electrocardiol. 2021. PMID: 34626835 Free PMC article.
-
Sex differences in vectorcardiogram of African-Americans with and without cardiovascular disease: a cross-sectional study in the Jackson Heart Study cohort.BMJ Open. 2021 Jan 31;11(1):e042899. doi: 10.1136/bmjopen-2020-042899. BMJ Open. 2021. PMID: 33518522 Free PMC article.
-
The Reproducibility of Global Electrical Heterogeneity ECG Measurements.Comput Cardiol (2010). 2018 Sep;45:10.22489/cinc.2018.162. doi: 10.22489/cinc.2018.162. Epub 2019 Jun 24. Comput Cardiol (2010). 2018. PMID: 32296724 Free PMC article.
-
Cardiovascular disease risk factors in the Hispanic/Latino population: lessons from the Hispanic Community Health Study/Study of Latinos (HCHS/SOL).Prog Cardiovasc Dis. 2014 Nov-Dec;57(3):230-6. doi: 10.1016/j.pcad.2014.07.006. Epub 2014 Aug 2. Prog Cardiovasc Dis. 2014. PMID: 25242694 Review.
Cited by
-
Electrical Heterogeneity in Hispanic Background Subpopulations: The HCHS/SOL.JACC Adv. 2024 Sep 11;3(12):101225. doi: 10.1016/j.jacadv.2024.101225. eCollection 2024 Dec. JACC Adv. 2024. PMID: 39817081 Free PMC article.
-
Sex differences in global electrical heterogeneity: The Hispanic Community Health Study/Study of Latinos.Heart Rhythm O2. 2024 Nov 25;6(1):97-102. doi: 10.1016/j.hroo.2024.11.019. eCollection 2025 Jan. Heart Rhythm O2. 2024. PMID: 40224258 Free PMC article. No abstract available.
References
-
- Martin SS, Aday AW, Almarzooq ZI, Anderson CAM, Arora P, Avery CL, et al. . 2024 heart disease and stroke statistics: a report of US and global data from the American Heart Association. Circulation 2024;149:e347–e913. - PubMed
-
- White H, Boden-Albala B, Wang C, Elkind MSV, Rundek T, Wright CB, et al. . Ischemic stroke subtype incidence among Whites, Blacks, and Hispanics: the Northern Manhattan Study. Circulation 2005;111:1327–1331. - PubMed
-
- Shen AY, Contreras R, Sobnosky S, Shah AI, Ichiuji AM, Jorgensen MB, et al. . Racial/ethnic differences in the prevalence of atrial fibrillation among older adults—a cross-sectional study. J Natl Med Assoc 2010;102:906–913. - PubMed
-
- Rodriguez CJ, Soliman EZ, Alonso A, Swett K, Okin PM, Goff DC, et al. . Atrial fibrillation incidence and risk factors in relation to race–ethnicity and the population attributable fraction of atrial fibrillation risk factors: the multi-ethnic study of atherosclerosis. Ann Epidemiol 2015;25:71–76, 76.e1. - PMC - PubMed
Grants and funding
LinkOut - more resources
Full Text Sources