. 2024 Jul 20;5(1):100584.
doi: 10.1016/j.xops.2024.100584. eCollection 2025 Jan-Feb.

Predicting Choroidal Nevus Transformation to Melanoma Using Machine Learning

Affiliations

Predicting Choroidal Nevus Transformation to Melanoma Using Machine Learning

Prashant D Tailor et al. Ophthalmol Sci. .

Abstract

Purpose: To develop and validate machine learning (ML) models to predict choroidal nevus transformation to melanoma based on multimodal imaging at initial presentation.

Design: Retrospective multicenter study.

Participants: Patients diagnosed with choroidal nevus on the Ocular Oncology Service at Wills Eye Hospital (2007-2017) or Mayo Clinic Rochester (2015-2023).

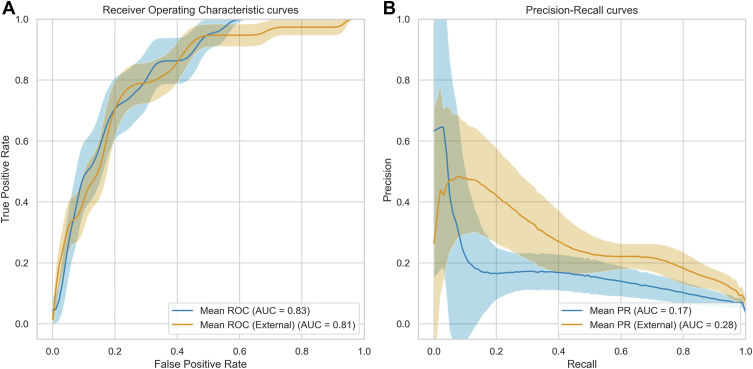
Methods: Multimodal imaging was obtained, including fundus photography, fundus autofluorescence, spectral domain OCT, and B-scan ultrasonography. Machine learning models were created (XGBoost, LGBM, Random Forest, Extra Tree) and optimized for area under receiver operating characteristic curve (AUROC). The Wills Eye Hospital cohort was used for training and testing (80% training-20% testing) with fivefold cross validation. The Mayo Clinic cohort provided external validation. Model performance was characterized by AUROC and area under precision-recall curve (AUPRC). Models were interrogated using SHapley Additive exPlanations (SHAP) to identify the features most predictive of conversion from nevus to melanoma. Differences in AUROC and AUPRC between models were tested using 10 000 bootstrap samples with replacement and results.

Main outcome measures: Area under receiver operating curve and AUPRC for each ML model.

Results: There were 2870 nevi included in the study, with conversion to melanoma confirmed in 128 cases. Simple AI Nevus Transformation System (SAINTS; XGBoost) was the top-performing model in the test cohort [pooled AUROC 0.864 (95% confidence interval (CI): 0.864-0.865), pooled AUPRC 0.244 (95% CI: 0.243-0.246)] and in the external validation cohort [pooled AUROC 0.931 (95% CI: 0.930-0.931), pooled AUPRC 0.533 (95% CI: 0.531-0.535)]. Other models also had good discriminative performance: LGBM (test set pooled AUROC 0.831, validation set pooled AUROC 0.815), Random Forest (test set pooled AUROC 0.812, validation set pooled AUROC 0.866), and Extra Tree (test set pooled AUROC 0.826, validation set pooled AUROC 0.915). A model including only nevi with at least 5 years of follow-up demonstrated the best performance in AUPRC (test: pooled 0.592 (95% CI: 0.590-0.594); validation: pooled 0.656 [95% CI: 0.655-0.657]). The top 5 features in SAINTS by SHAP values were: tumor thickness, largest tumor basal diameter, tumor shape, distance to optic nerve, and subretinal fluid extent.

Conclusions: We demonstrate accuracy and generalizability of a ML model for predicting choroidal nevus transformation to melanoma based on multimodal imaging.

Financial disclosures: Proprietary or commercial disclosure may be found in the Footnotes and Disclosures at the end of this article.

Keywords: Artificial Intelligence; Choroidal melanoma; Choroidal nevus; Machine learning; Ocular oncology.


Figures

Figure 1
Figure 1
Receiver operating characteristics (ROC) curves and precision–recall (PR) curves for SAINTS (XGBoost). Receiver operating characteristics (A) and PR (B) curves for SAINTS (XGBoost) plot (A) true positive rate (sensitivity) vs. false positive rate (1-specificity) and (B) precision (positive predictive value) vs. recall (sensitivity) for a machine learning algorithm based on XGBoost. The 95% confidence intervals were generated using 10 000 bootstrapped samples with replacement. Pooled area under the curve values are given for the Wills held-out test set (blue) and Mayo external validation set (yellow) for ROC (A) and PR (B) curves. SAINTS demonstrates good discriminative performance on ROC curves (Wills: 0.86; Mayo: 0.93); however, has worse performance on PR curve (Wills: 0.24; Mayo: 0.53). AUC = area under the curve; SAINTS = Simple AI Nevus Transformation System.
Figure 2
Figure 2
Receiver operating characteristics (ROC) curves and precision–recall (PR) curves for LBGM. Receiver operating characteristics (A) and PR (B) curves for LGBM plot (A) true positive rate (sensitivity) vs. false positive rate (1-specificity) and (B) precision (positive predictive value) vs. recall (sensitivity) for the LGBM model. The 95% confidence intervals were generated using 10 000 bootstrapped samples with replacement. Pooled area under the curve values are given for the Wills held-out test set (blue) and Mayo external validation set (yellow) for ROC (A) and PR (B) curves. LGBM demonstrates good discriminative performance on ROC curves (Wills: 0.83; Mayo: 0.81); however, has worse performance on PR curve (Wills: 0.17; Mayo: 0.28). AUC = area under the curve.
Figure 3
Figure 3
Receiver operating characteristics (ROC) curves and precision–recall (PR) curves for Random Forest. Receiver operating characteristics (A) and PR (B) curves for Random Forest plot (A) true positive rate (sensitivity) vs. false positive rate (1-specificity) and (B) precision (positive predictive value) vs. recall (sensitivity) for the Random Forest model. The 95% confidence intervals were generated using 10 000 bootstrapped samples with replacement. Pooled area under the curve values are given for the Wills held-out test set (blue) and Mayo external validation set (yellow) for ROC (A) and PR (B) curves. Random Forest demonstrates good discriminative performance on ROC curves (Wills: 0.81; Mayo: 0.87); however, has worse performance on PR curve (Wills: 0.12; Mayo: 0.42). AUC = area under the curve.
Figure 4
Figure 4
Receiver operating characteristics (ROC) curves and precision–recall (PR) Curves for Extra Tree. Receiver operating characteristics (A) and PR (B) curves for Extra Tree plot (A) true positive rate (sensitivity) vs. false positive rate (1-specificity) and (B) precision (positive predictive value) vs. recall (sensitivity) for the Extra Tree model. The 95% confidence intervals were generated using 10 000 bootstrapped samples with replacement. Pooled area under the curve values are given for the Wills held-out test set (blue) and Mayo external validation set (yellow) for ROC (A) and PR (B) curves. Extra Tree demonstrates good discriminative performance on ROC curves (Wills: 0.83; Mayo: 0.91); however, has worse performance on PR curve (Wills: 0.12; Mayo: 0.51). AUC = area under the curve.
Figure 5
Figure 5
SHapley Additive exPlanations (SHAP) for 4 machine learning models for prediction of choroidal nevus transformation to melanoma (A, SAINTS; B, LGBM; C, Random Forest; D, Extra Tree). The graphs show the SHAP values for features that contribute to the prediction of each model. The SHAP values measure the impact of each feature on the model output. The features are ordered by their average absolute SHAP value across all samples. The color represents the feature value (red high, blue low). The top 5 features for each model (in order of SHAP value) are (A) SAINTS: tumor thickness, largest tumor basal diameter, tumor shape, distance to ON, and subretinal fluid extent; (B) LGBM: Tumor distance to fovea, patient age, tumor thickness, largest tumor basal diameter, and VA at presentation; (C) Random Forest: tumor thickness, largest tumor basal diameter, patient age, tumor distance to fovea, and distance to ON; (D) tumor shape, tumor thickness, largest tumor basal diameter, subretinal fluid extent, and internal reflectivity. CNVM = choroidal neovascular membrane; DFS = days first seen; logMAR = logarithm of the minimum angle of resolution; ON = optic nerve; RPE = included retinal pigment epithelium; SAINTS = Simple AI Nevus Transformation System; SHAP = SHapley Additive exPlanations; SRF = subretinal fluid; VA = visual acuity.
Figure 6
Figure 6
Receiver operating characteristics (ROC) curves and precision–recall (PR) curves for XGBoost for nevi with long-term follow-up (>5 years). Receiver operating characteristics (A) and PR (B) curves for XGBoost plot (A) true positive rate (sensitivity) vs. false positive rate (1-specificity) and (B) precision (positive predictive value) vs. recall (sensitivity) for the XGBoost model. The 95% confidence intervals were generated using 10 000 bootstrapped samples with replacement. Pooled area under the curve values are given for the Wills held-out test set (blue) and Mayo external validation set (yellow) for ROC (A) and PR (B) curves. XGBoost demonstrates good discriminative performance on ROC curves (Wills: 0.82; Mayo: 0.86) and on PR curves (Wills: 0.59; Mayo: 0.65).Nevus to melanoma transformation with ML/tailor/. AUC = area under the curve; ML = machine learning.

References

    1. Shields J.A., Shields C.L. 3 ed. Wolters Kluwer Health; Philadelphia, PA: 2016. Intraocular Tumors: An Atlas and Textbook.
    1. Shields C.L., Dalvin L.A., Ancona-Lezama D., et al. Choroidal nevus imaging features in 3,806 cases and risk factors for transformation into melanoma in 2,355 cases: the 2020 Taylor R. Smith and Victor T. Curtin Lecture. Retina. 2019;39:1840–1851. - PubMed
    1. Pfaff E.R., Girvin A.T., Bennett T.D., et al. Identifying who has long COVID in the USA: a machine learning approach using N3C data. Lancet Digit Health. 2022;4:e532–e541. - PMC - PubMed
    1. Kwong J.C.C., Khondker A., Meng E., et al. Development, multi-institutional external validation, and algorithmic audit of an artificial intelligence-based Side-specific Extra-Prostatic Extension Risk Assessment tool (SEPERA) for patients undergoing radical prostatectomy: a retrospective cohort study. Lancet Digit Health. 2023;5:e435–e445. - PubMed
    1. Zabor E.C., Raval V., Luo S., et al. A prediction model to discriminate small choroidal melanoma from choroidal nevus. Ocul Oncol Pathol. 2022;8:71–78. - PMC - PubMed

LinkOut - more resources