. 2024 Sep 10:18:1441897.
doi: 10.3389/fnins.2024.1441897. eCollection 2024.

Signal quality evaluation of an in-ear EEG device in comparison to a conventional cap system

Affiliations

Signal quality evaluation of an in-ear EEG device in comparison to a conventional cap system

Hanane Moumane et al. Front Neurosci. .

Abstract

Introduction: Wearable in-ear electroencephalographic (EEG) devices hold significant promise for integrating brain monitoring technologies into real-life applications. However, despite the introduction of various in-ear EEG systems, there remains a necessity for validating these technologies against gold-standard, clinical-grade devices. This study aims to evaluate the signal quality of a newly developed mobile in-ear EEG device compared to a standard scalp EEG system among healthy volunteers during wakefulness and sleep.

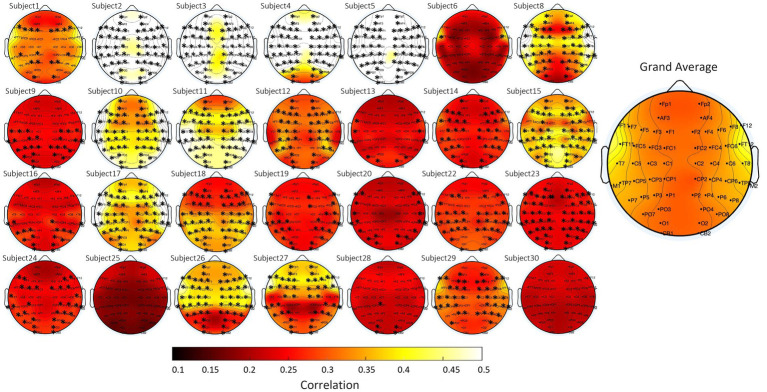
Methods: The study evaluated an in-ear EEG device equipped with dry electrodes in a laboratory setting, recording a single bipolar EEG channel using a cross-ear electrode configuration. Thirty healthy participants were recorded simultaneously using the in-ear EEG device and a conventional EEG cap system with 64 wet electrodes. Based on two recording protocols, one during a resting state condition involving alternating eye opening and closure with a low degree of artifact contamination and another consisting of a daytime nap, several quality measures were used for a quantitative comparison including root mean square (RMS) analysis, artifact quantification, similarities of relative spectral power (RSP), signal-to-noise ratio (SNR) based on alpha peak criteria, and cross-signal correlations of alpha activity during eyes-closed conditions and sleep activities. The statistical significance of our results was assessed through nonparametric permutation tests with False Discovery Rate (FDR) control.

Results: During the resting state, in-ear and scalp EEG signals exhibited similar fluctuations, characterized by comparable RMS values. However, intermittent signal alterations were noticed in the in-ear recordings during nap sessions, attributed to movements of the head and facial muscles. Spectral analysis indicated similar patterns between in-ear and scalp EEG, showing prominent peaks in the alpha range (8-12 Hz) during rest and in the low-frequency range during naps (particularly in the theta range of 4-7 Hz). Analysis of alpha wave characteristics during eye closures revealed smaller alpha wave amplitudes and slightly lower signal-to-noise ratio (SNR) values in the in-ear EEG compared to scalp EEG. In around 80% of cases, cross-correlation analysis between in-ear and scalp signals, using a contralateral bipolar montage of 64 scalp electrodes, revealed significant correlations with scalp EEG (p < 0.01), particularly evident in the FT11-FT12 and T7-T8 electrode derivations.

Conclusion: Our findings support the feasibility of using in-ear EEG devices with dry-contact electrodes for brain activity monitoring, compared to a standard scalp EEG, notably for wakefulness and sleep uses. Although marginal signal degradation is associated with head and facial muscle contractions, the in-ear device offers promising applications for long-term EEG recordings, particularly in scenarios requiring enhanced comfort and user-friendliness.

Keywords: EEG; in-ear device; scalp EEG; signal quality; wearable technology.


Conflict of interest statement

The authors declare that the research was conducted in the absence of any commercial or financial relationships that could be construed as a potential conflict of interest. The author(s) declared that they were an editorial board member of Frontiers, at the time of submission. This had no impact on the peer review process and the final decision.

Figures

Figure 1
Figure 1
Experimental setup for EEG recording used in this study. (A) Close-up view of the in-ear EEG device developed by Naox Technologies, with electrodes inserted in positions ELE, ERE, ELI, and ERI, corresponding to two contact points inside each ear canal. (B) Experimental setup for simultaneous scalp and in-ear EEG acquisition. The EEG cap with 64 scalp electrodes and eartips for in-ear EEG recording. The EEG signals from the scalp and in-ear devices are synchronized via a synchronization card that receives triggers from the STIM2 device. The in-ear EEG signals are transmitted to a computer via Bluetooth. (C) Detailed images showing the placement of the in-ear EEG device in the left (L) and right (R) ears. Red circles highlight the positioning of T7 and T8 scalp electrodes used for comparison.
Figure 2
Figure 2
In-ear EEG impedance measurements over time. (A) Architecture of the in-ear EEG system configuration. Dry electrodes with an impedance (Ze) of 300 kΩ are connected to active electrodes with a high input impedance (Zi) of 13 TΩ and unity gain (G = 1). This setup ensures the input voltage (Vi) equals the output voltage (Vo), minimizes current flow (I = 0), and reduces noise, preserving signal quality for accurate EEG signal transmission to the Naox system. (B) Impedance spectra measured at different time points: at the initial time (t0, black circles), 10 min after the initial time (t0 + 10 min, gray squares), 1 h after the initial time (t0 + 1 h, red triangles), and 3 h after the initial time (t0 + 3 h, red diamonds). The impedance is plotted against frequency (0.1 Hz to 1,000 Hz) on a logarithmic scale. Dashed lines represent the standard deviation (SD). (C) Impedance at 50 Hz measured at the same time points: t0, t0 + 10 min, t0 + 1 h, and t0 + 3 h. The y-axis represents impedance in kilo-ohms (kΩ). Data is presented as mean ± standard deviation (SD) with individual data points for the different participants (N = 7) plotted.
Figure 3
Figure 3
Signal analysis of different EEG waveforms from simultaneous scalp (T7-T8) and dry-contact in-ear recordings. The in-ear EEG signals are amplified (x2) for comparison. (A) Example of EEG signal traces comparing simultaneous scalp and in-ear recordings during “alpha test. The signals show epochs of eye-open (EO) and eye-closed (EC) states. The top panel highlights a detailed waveform comparison during the EC state, demonstrating the high similarity in alpha waves during the EC condition captured by the two systems (dry-contact in-ear in blue and gel-based scalp electrode cb2). (B) Comparison of theta wave activity (4–7 Hz) between scalp (red) and in-ear (blue) EEG recordings. (C) Comparison of slow wave activity (0.5–2 Hz) from the scalp (red) and in-ear (blue), highlighting the consistency in detected slow waves. (D) Spindle activity (12–16 Hz) from the scalp (red) and in-ear (blue), indicating the capability of the in-ear device to capture sleep spindles. (E) Example of movement artifacts (face and head) observed in in-ear (blue) EEG recordings compared to scalp (red). (F) Example of artifacts from poor skin contact observed in in-ear sensors (blue) during eyes closed (EC).
Figure 4
Figure 4
Comparison of root mean square (RMS) measurements obtained from scalp (T7-T8) and dry-contact in-ear electrodes. Individual RMS values are indicated by grey dots, with the mean RMS values represented by the height of the bars. Subjects marked with an asterisk (*) indicate those with notable differences between scalp and in-ear RMS values. (A) The RMS of the EEG signal amplitude during the alpha test is plotted for each subject (Sub ID) using scalp (red bars) and in-ear (blue bars) electrodes over 10-s windows. (B) The RMS of the EEG signal amplitude during the nap test plotted for each subject (Sub ID) using scalp (red bars) and in-ear (blue bars) electrodes over 10-s intervals.
Figure 5
Figure 5
Comparison of the percentage % of bad data between scalp (T7-T8) and in-ear EEG recordings. (A) The percentage of bad data segments for each subject using scalp (red) and in-ear (blue) EEG recordings during the alpha test. The dashed line at 10% indicates the threshold for acceptable data quality. Subjects are identified by their ID numbers along the x-axis. Most subjects show low percentages of bad data, with a few exceptions. (B) The percentage of bad data segments for a different group of subjects, again comparing scalp (red) and in-ear (blue) EEG recordings. The 10% threshold line is included for reference. Notable differences (subjects marked by asterisks) in bad data percentages are observed, especially for certain subjects (e.g., Sub 13 and Sub 22).
Figure 6
Figure 6
(A) Signal-to-noise ratio (SNR) for the alpha band (8–12 Hz) during the eyes-closed (EC) condition for each subject (Sub ID). Red bars represent scalp (T7-T8) recordings, and blue bars represent dry-contact in-ear recordings. Error bars indicate the standard error. (B) Spectrograms of EEG recordings from in-ear electrodes (bottom) and simultaneously recorded scalp T7-T8 electrodes (top), averaged across all subjects. Periods of eyes open (EO) and eyes closed (EC) are indicated. (C) Scatter plot showing the correlation between the square root of the power recorded from scalp (T7-T8) and in-ear electrodes. The x-axis represents the square root of the power from in-ear electrodes, and the y-axis represents the square root of the power from scalp (T7-T8) electrodes. Each point corresponds to a 10-s epoch. A linear trend line with a slope of 2.1 is included.
Figure 7
Figure 7
Topographical plots of alpha wave correlation values during the eyes-closed condition, comparing scalp (contralateral bipolar montage) and in-ear EEG signals for each subject. Each subplot corresponds to a different subject, with scalp electrode locations indicated. The color scale represents correlation values, ranging from 0.1 (dark red) to 0.5 (yellow). The grand average across all subjects is displayed on the right.
Figure 8
Figure 8
(A) Relative spectral power (RSP) across subjects for different sleep stages (Wake, N1, N2, N3, REM) for scalp (red) and in-ear (blue) EEG recordings. Each plot represents the average RSP across subjects for the specified sleep stage. Asterisks inside the vertical dashed lines indicate the frequency bands where there are statistically significant differences (p < 0.01). (B) An example hypnogram of a nap (top), raw signals (middle), and relative spectrograms of scalp (T7-T8) and in-ear EEG signals (bottom) during sleep. (C) Cross-correlation values between scalp (T7-T8) and in-ear EEG signals across different sleep stages. Bars represent mean cross-correlation values, with individual subject values overlaid as circles. The overall mean across all sleep stages is shown on the right.

Similar articles

Cited by

References

    1. Athavipach C., Pan-Ngum S., Israsena P. (2019). A wearable in-ear EEG device for emotion monitoring. Sensors (Basel, Switzerland) 19:E4014. doi: 10.3390/s19184014 - DOI - PMC - PubMed
    1. Benjamini Y., Hochberg Y. (1995). Controlling the false discovery rate: a practical and powerful approach to multiple testing. J. R. Stat. Soc. B (Methodological) 57, 289–300. doi: 10.1111/j.2517-6161.1995.tb02031.x - DOI
    1. Berry R., Quan S., Abreu A. (2020). The AASM manual for the scoring of sleep and associated events: Rules, terminology and technical specifications, version 2.6. Darien: American Academy of Sleep Medicine.
    1. Butar B. F., Park J. W. (2008). Permutation tests for comparing two populations. J. Math. Sci. Math. Educ. 3, 19–30.
    1. Chi Y. M., Jung T.-P., Cauwenberghs G. (2010). Dry-contact and noncontact biopotential electrodes: methodological review. IEEE Rev. Biomed. Eng. 3, 106–119. doi: 10.1109/RBME.2010.2084078 - DOI - PubMed

LinkOut - more resources