. 2025 Mar 6;148(3):908-920.
doi: 10.1093/brain/awae293.

BCAS1-positive oligodendrocytes enable efficient cortical remyelination in multiple sclerosis

Affiliations

BCAS1-positive oligodendrocytes enable efficient cortical remyelination in multiple sclerosis

Caroline Gertrud Bergner et al. Brain. .

Abstract

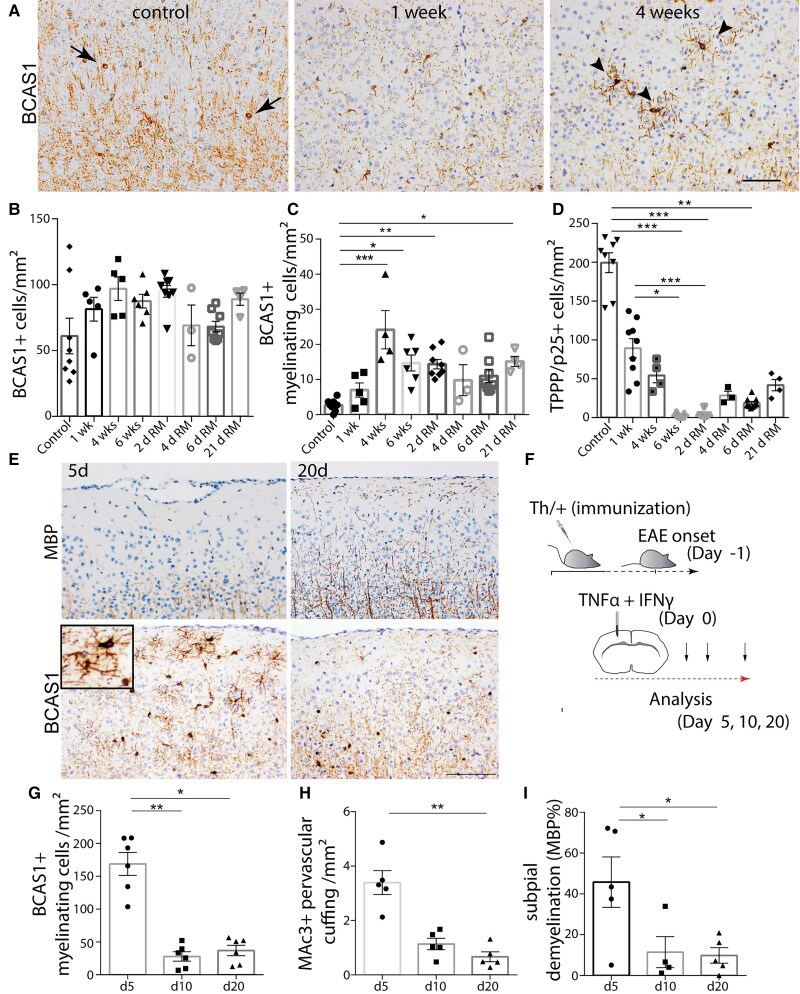
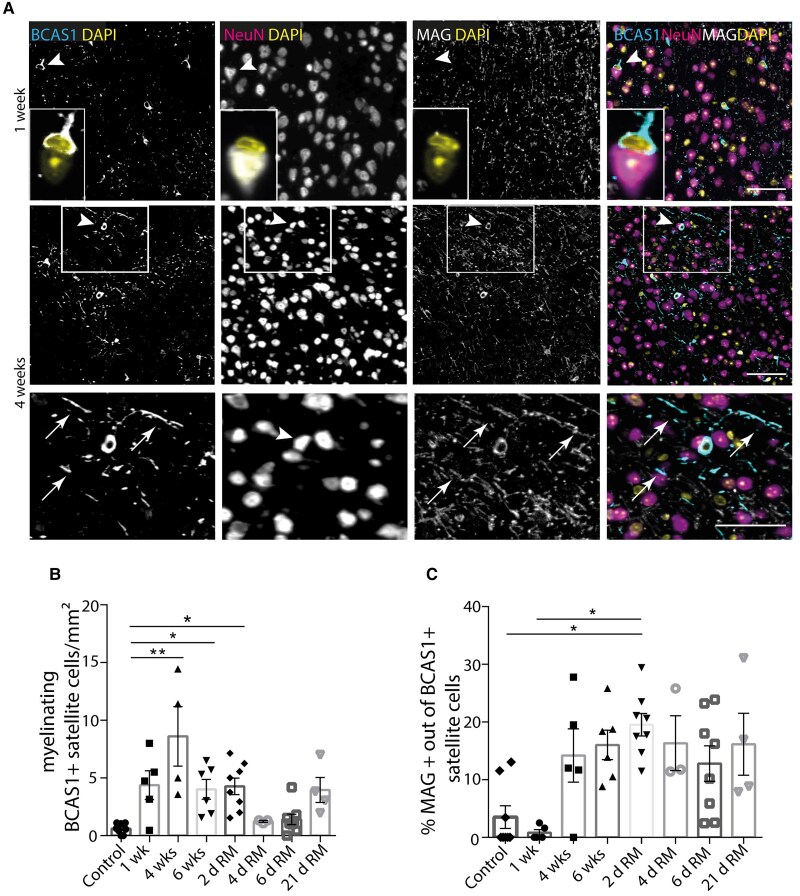
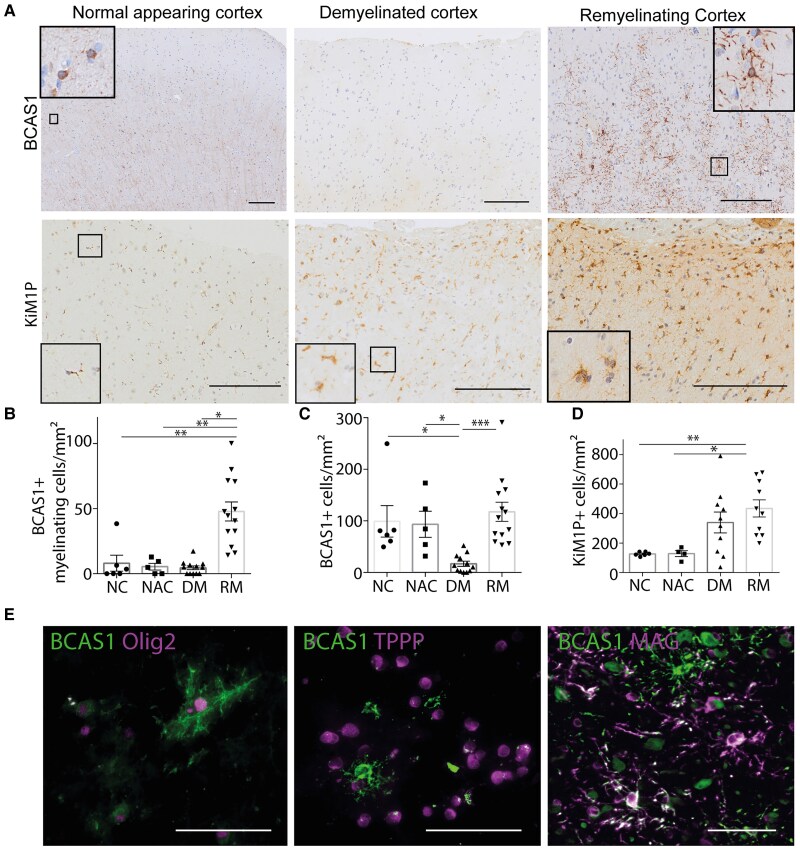
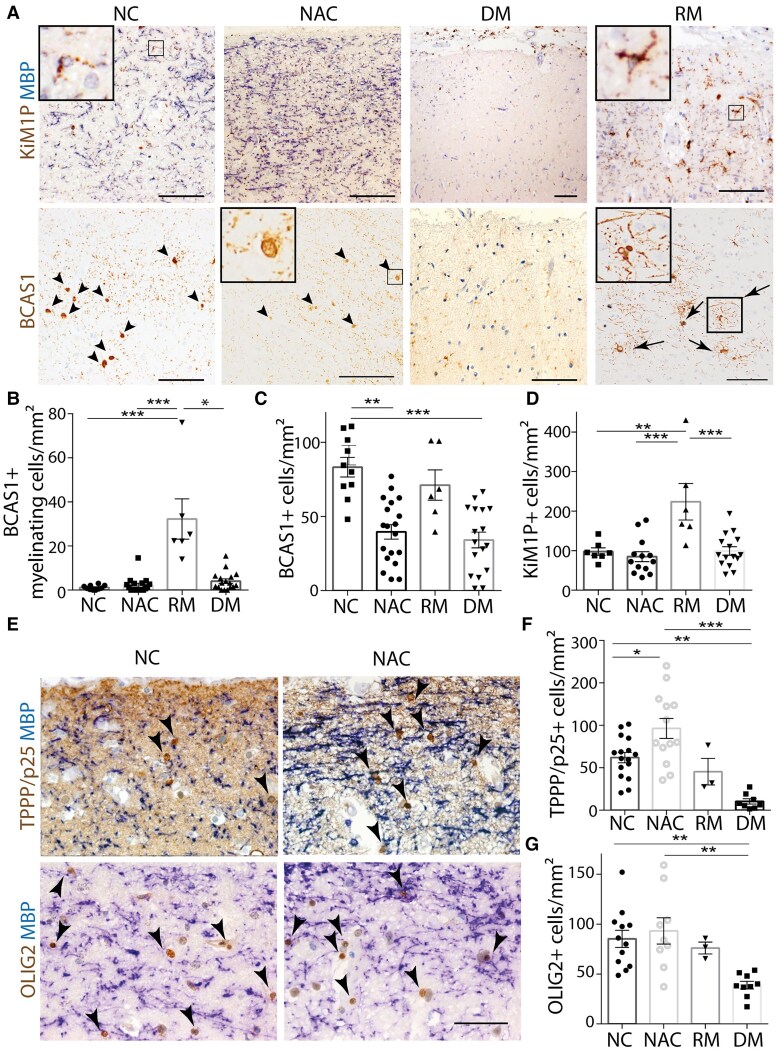
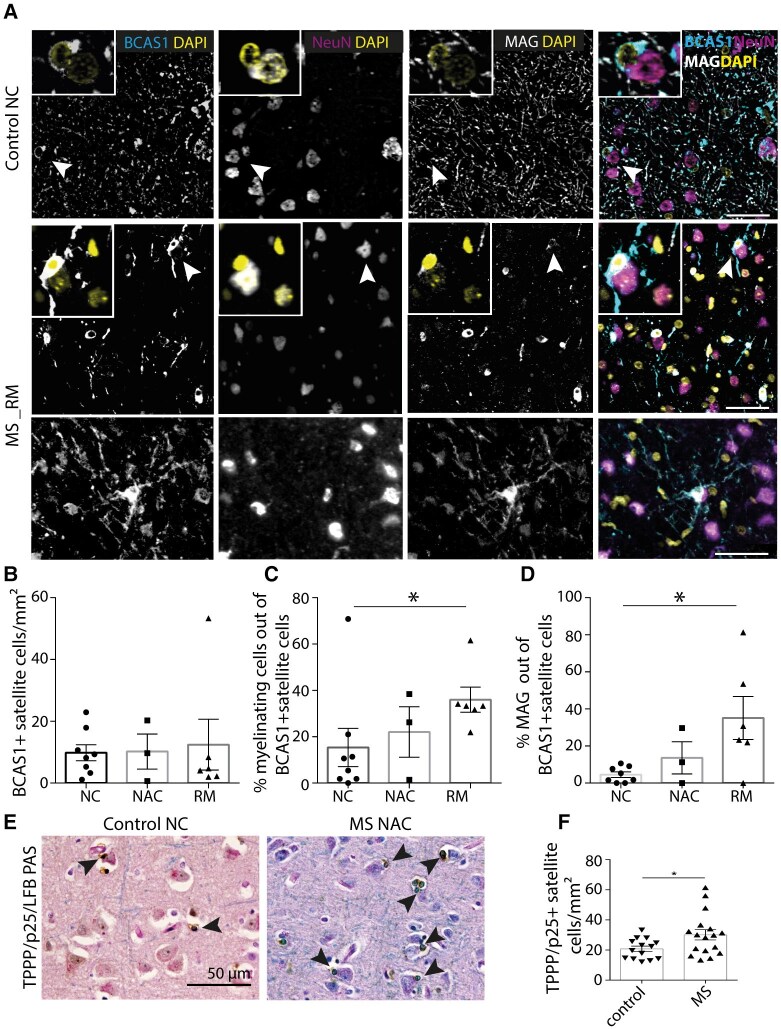
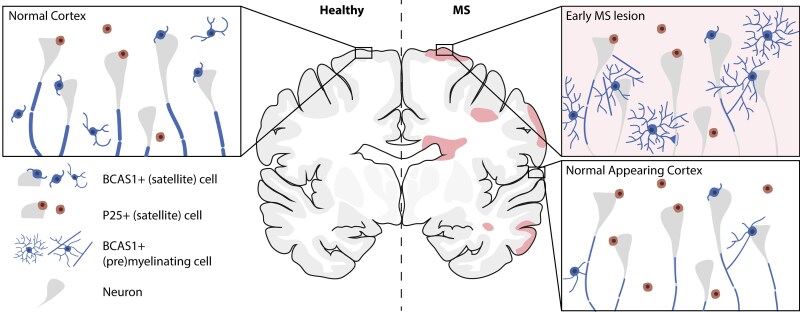
Remyelination is a crucial regenerative process in demyelinating diseases, limiting persisting damage to the CNS. It restores saltatory nerve conduction and ensures trophic support of axons. In patients with multiple sclerosis, remyelination has been observed in both white and grey matter and found to be more efficient in the cortex. Brain-enriched myelin-associated protein 1 (BCAS1) identifies oligodendrocyte lineage cells in the stage of active myelin formation in development and regeneration. Other than in the white matter, BCAS1+ oligodendrocytes are maintained at high densities in the cortex throughout life. Here, we investigated cortical lesions in human biopsy and autopsy tissue from patients with multiple sclerosis in direct comparison to demyelinating mouse models and demonstrate that following a demyelinating insult BCAS1+ oligodendrocytes in remyelinating cortical lesions shift from a quiescent to an activated, internode-forming morphology co-expressing myelin-associated glycoprotein (MAG), necessary for axonal contact formation. Of note, activated BCAS1+ oligodendrocytes are found at early time points of experimental demyelination amidst ongoing inflammation. In human tissue, activated BCAS1+ oligodendrocytes correlate with the density of myeloid cells, further supporting their involvement in an immediate regenerative response. Furthermore, studying the microscopically normal appearing non demyelinated cortex in patients with chronic multiple sclerosis, we find a shift from quiescent BCAS1+ oligodendrocytes to mature, myelin-maintaining oligodendrocytes, suggesting oligodendrocyte differentiation and limited replenishment of BCAS1+ oligodendrocytes in long-standing disease. We also demonstrate that part of perineuronal satellite oligodendrocytes are BCAS1+ and contribute to remyelination in human and experimental cortical demyelination. In summary, our results provide evidence from human tissue and experimental models that BCAS1+ cells in the adult cortex represent a population of pre-differentiated oligodendrocytes that rapidly react after a demyelinating insult thus enabling immediate myelin regeneration. In addition, our data suggest that limited replenishment of BCAS1+ oligodendrocytes may contribute to the remyelination failure observed in the cortex in chronic multiple sclerosis.

Keywords: cortical remyelination; demyelination; multiple sclerosis; oligodendrocytes; satellite cells.


Conflict of interest statement

The authors declare that they have no competing interests.

Figures

Figure 1
Figure 1
BCAS1+ myelinating oligodendrocytes are generated rapidly after toxic and inflammatory cortical lesion induction. (A) BCAS1+ oligodendrocytes in the cerebral cortex of control and cuprizone-treated mice. In control cortex, BCAS1+ oligodendrocytes with no or few processes predominate (left, arrows), whereas after 4 weeks of cuprizone treatment, BCAS1+ oligodendrocytes adopt a myelinating, process-rich phenotype (right, arrowheads). (B) BCAS1+ oligodendrocyte density in the cerebral cortex of control mice during cuprizone treatment and after cuprizone withdrawal. (C) Quantification of BCAS1+ process-rich myelinating cells in the cerebral cortex of control mice during cuprizone treatment and after cuprizone withdrawal [control, n = 8; 1 week, n = 5; 4 weeks, n = 5; 6 weeks, n = 6; 2 days remyelination (2 d RM), n = 8; 4 days RM, n = 3; 6 days RM, n = 8; 21 days RM, n = 4; Kruskal–Wallis test with Dunn’s multiple comparison test; *P < 0.05, **P < 0.01, ***P < 0.001; mean ± standard error of the mean]. (D) Density of TPPP/p25+ myelin-maintaining oligodendrocytes in the cerebral cortex during de- and remyelination (controls, n = 8; 1 week, n = 9; 4 weeks, n = 4; 6 weeks, n = 5; 2 days RM, n = 8; 4 days RM, n = 3; 6 days RM, n = 9; 21 days RM, n = 4; Kruskal–Wallis test with Dunn’s multiple comparison test; *P < 0.05, **P < 0.01, ***P < 0.001). (E) MBP and BCAS1 immunohistochemistry (IHC) on Days 5 and 20 after focal lesion induction in a model of antibody-induced cortical demyelination (schematic representation in F). (G) BCAS1+ myelinating oligodendrocytes (Days 5, 10 and 20; n = 6; Kruskal–Wallis test with Dunn’s post hoc test; *P < 0.05, **P < 0.01). (H) Quantification of perivascular Mac3+ infiltrating macrophages/activated microglia (Days 5, 10 and 20; n = 5; Kruskal–Wallis test with Dunn’s post hoc test; **P < 0.01). (I) Percentage of demyelination in subpial cortical area, assessed by anti-MBP IHC (Days 5, n = 5; 10, n = 4; and 20, n = 5; Kruskal–Wallis test with Dunn’s post hoc test; *P < 0.05). Scale bars = 100 µm. EAE = experimental autoimmune encephalitis.
Figure 2
Figure 2
BCAS1+ perineuronal satellite oligodendrocytes contribute to remyelination in cuprizone-induced demyelination. (A) Immunofluorescence triple labelling of BCAS1 (cyan) with NeuN (neuronal nuclear antigen, magenta) and the myelin-associated glycoprotein (MAG, white). Insets: Magnification of the BCAS1+ satellite oligodendrocytes as indicated by the arrowhead. Bottom: Magnification of internode-forming BCAS1+ oligodendrocytes forming parallel contacts with multiple neighbouring axons. (B) Density of BCAS1+ satellite oligodendrocytes with a process-rich myelinating morphology in control mice, during cuprizone-induced demyelination and after cuprizone withdrawal [controls, n = 8; 1 week, n = 5; 4 weeks, n = 4; 6 weeks, n = 6; 2 days remyelination (2 d RM), n = 8; 4 days RM, n = 3; 6 days RM, n = 8; 21 days RM, n = 4; Kruskal-Wallis test with Dunn’s multiple comparison test; *P < 0.05, **P < 0.01]. (C) Percentage of BCAS1+ perineuronal satellite oligodendrocytes that express MAG during cuprizone-induced demyelination and after cuprizone withdrawal (controls, n = 8; 1 week, n = 5; 4 weeks, n = 5; 6 weeks, n = 6; 2 days RM, n = 8; 4 days RM, n = 3; 6 days RM, n = 8; 21 days RM, n = 4; Kruskal–Wallis test with Dunn’s multiple comparison test; *P < 0.05). Scale bars = 50 µm.
Figure 3
Figure 3
Activation of BCAS1+ oligodendrocytes in remyelinating cortical biopsy tissue of early multiple sclerosis. (A) BCAS1 and KiM1P (macrophages/activated microglia) immunohistochemistry (IHC) of cerebral cortex of biopsied multiple sclerosis (MS) patients containing normal-appearing cortex (NAC), demyelinated (DM) and remyelinating (RM) cortical lesions. In the NAC, BCAS1+ oligodendrocytes show a round, perinuclear staining and no branches. Phagocytes show a homeostatic morphology and are weakly stained by KiM1P (left). DM areas show a reduction in BCAS1+ oligodendrocytes among activated Kim1P+ phagocytes (middle). Within remyelinating areas, branched, internode-forming BCAS1+ oligodendrocytes are observed, and phagocytes display an activated morphology with increased KiM1P staining (right). (B) Density of BCAS1+ oligodendrocytes with a process-rich myelinating morphology in the cortex of MS patients (NC, n = 6; NA n = 5; DM, n = 12; RM, n = 13; Kruskal–Wallis test with Dunn’s multiple comparison test; *P < 0.05, **P < 0.01). (C) Density of all BCAS1+ oligodendrocytes in the cortex of MS patients (NC, n = 6; NAC, n = 5; DM, n = 12; RM, n = 13; Kruskal–Wallis test with Dunn’s multiple comparison test; *P < 0.05, ***P < 0.001). (D) Quantification of KiM1P+ macrophages/activated microglia cells in the cortex of MS patients (NC, n = 6; NAC, n = 4; DM, n = 10; RM, n = 10; Kruskal–Wallis test with Dunn’s post hoc test; *P < 0.05, **P < 0.01). (E) Co-labelling of BCAS1 and oligodendrocyte lineage marker in MS biopsy tissue. Error bars indicate mean ± standard error of the mean. Scale bars in A = 200 µm and E = 50 µm.
Figure 4
Figure 4
BCAS1+ oligodendrocytes are decreased, while myelin-maintaining oligodendrocytes are increased in the normal-appearing cortex in patients with progressive multiple sclerosis. (A) Co-labelling of KiM1P (macrophages/activated microglia) with MBP and BCAS1 of cerebral cortex of multiple sclerosis (MS) patients containing normal-appearing cortex (NAC), demyelinated (DM) and remyelinating (RM) cortical lesions and normal cortex (NC) of age-matched controls. Arrowheads indicate BCAS1+ oligodendrocytes in NC and NAC, while arrows indicate process-rich actively myelinating BCAS1+ oligodendrocytes in remyelinating areas, magnified in insets for NAC and RM areas. In addition, homeostatic versus activated morphology of KiM1P+ phagocytes is shown in higher magnification for NC and RM. (B) Density of BCAS1+ oligodendrocytes with a myelinating morphology in the cortex of MS patients and age-matched controls (NC, n = 10; NAC, n = 17; DM, n = 17; RM, n = 6; Kruskal-Wallis test with Dunn’s multiple comparison test; *P < 0.05, ***P < 0.001). (C) Total density of BCAS1+ oligodendrocytes in the cortex of MS patients and age-matched controls (NC, n = 10; NAC, n = 19; DM, n = 17; RM, n = 6; Kruskal–Wallis test with Dunn’s multiple comparison test; *P < 0.05, **P < 0.01, ***P < 0.001). (D) Density of KiM1P+ macrophages/activated microglia in the cortex of MS patients and age-matched controls (NC, n = 7; NAC, n = 13; DM, n = 15; RM, n = 6; one-way ANOVA with Tukey’s multiple comparison test; **P < 0.01, ***P < 0.001). (E) Co-labelling of MBP with tubulin polymerization promoting protein (TPPP/p25) and Olig2. Arrowheads indicate TPPP/p25+ and Olig2+ cells in the NC and NAC. (F) Quantification of TPPP/p25+ cells (NC, n = 16; NAC, n = 13; DM, n = 8; RM, n = 4; one-way ANOVA with Tukey’s multiple comparison test; *P < 0.05, **P < 0.01, ***P < 0.001) and (G) Olig2+ cells in the cortex of MS patients and age-matched controls (NC, n = 12; NAC, n = 9; DM, n = 9; RM, n = 4; Kruskal–Wallis test with Dunn’s multiple comparison test; *P < 0.05); mean ± standard error of the mean. Scale bars in A = 100 µm and E = 50 µm.
Figure 5
Figure 5
BCAS1+ satellite oligodendrocytes myelinate early cortical lesions of multiple sclerosis. (A) Triple immunofluorescence labelling of BCAS1 (cyan) with NeuN (neuronal nuclear antigen, magenta) and the myelin-associated glycoprotein (MAG, white) of control cortex (control, NC) and biopsies from patients with multiple sclerosis (MS) that show active, ongoing remyelination (RM). Insets: BCAS1+ perineuronal satellite oligodendrocytes, co-expressing MAG in cortical remyelination, as indicated by the arrowhead. (B) Density of BCAS1+ satellite oligodendrocytes in control biopsies and patients with MS [NC, n = 8; normal-appearing cortex (NAC), n = 3; RM, n = 6]. (C) Density of BCAS1+ satellite oligodendrocytes with a process-rich myelinating morphology as percentage of the total number of BCAS1+ satellite oligodendrocytes in control biopsies and patients with MS (NC, n = 8; NAC, n = 3; RM, n = 6; Kruskal–Wallis test with Dunn’s multiple comparison test; *P < 0.05). (D) Percentage of BCAS1+ satellite oligodendrocytes that expresses MAG in control biopsies and patients with MS (NC, n = 8; NAC, n = 3; RM, n = 6; Kruskal–Wallis test with Dunn’s multiple comparison test; *P < 0.05). (E) Luxol Fast Blue periodic acid-Schiff staining and TPPP/p25 immunohistochemistry (IHC) of autopsies from controls and patients with progressive MS. Arrowheads indicate TPPP/p25+ satellite oligodendrocytes. (F) Density of TPPP/p25+ satellite oligodendrocytes in controls and the NAC of patients with MS (controls, n = 14; MS, n = 18; Mann–Whitney test; *P < 0.05). Error bars indicate mean ± standard error of the mean. Scale bars = 50 µm.
Figure 6
Figure 6
BCAS1+ oligodendrocytes, including perineuronal BCAS1+ satellite oligodendrocytes, participate in remyelination after cortical demyelination in multiple sclerosis. Schematic illustration of BCAS1+ and TPPP/p25+ oligodendrocytes in the cortex of a healthy brain compared to early cortical demyelination and the normal-appearing cortex in multiple sclerosis (MS). In the normal adult cortex, we mainly find BCAS1+ oligodendrocytes with few or no processes, including perineuronal non-myelinating satellite cells. These cells are activated early after demyelination in MS lesions and differentiate to BCAS1+ cells with a pre- and myelinating morphology to generate new myelin, while the total number of BCAS1+ oligodendrocytes remains unchanged. Finally, these cells differentiate to mature, TPPP/p25+ myelin-maintaining oligodendrocytes. Increased numbers of TPPP/p25+ oligodendrocytes and reduced numbers of BCAS1+ oligodendrocytes may indicate that areas of normal appearing cortex have been subjected to differentiation stimuli, e.g. inflammation or demyelination.

Comment in

Similar articles

Cited by

References

    1. Irvine KA, Blakemore WF. Remyelination protects axons from demyelination-associated axon degeneration. Brain. 2008;131:1464–1477. - PubMed
    1. Duncan ID, Brower A, Kondo Y, Curlee JF, Schultz RD. Extensive remyelination of the CNS leads to functional recovery. Proc Natl Acad Sci U S A. 2009;106:6832–6836. - PMC - PubMed
    1. Fünfschilling U, Supplie LM, Mahad D, et al. Glycolytic oligodendrocytes maintain myelin and long-term axonal integrity. Nature. 2012;485:517–521. - PMC - PubMed
    1. Lee Y, Morrison BM, Li Y, et al. Oligodendroglia metabolically support axons and contribute to neurodegeneration. Nature. 2012;487:443–448. - PMC - PubMed
    1. Lassmann H, Brück W, Lucchinetti C, Rodriguez M. Remyelination in multiple sclerosis. Mult Scler. 1997;3:133–136. - PubMed

MeSH terms