. 2024 Sep 25:13:RP91849.
doi: 10.7554/eLife.91849.

Antigenic drift and subtype interference shape A(H3N2) epidemic dynamics in the United States

Affiliations

Antigenic drift and subtype interference shape A(H3N2) epidemic dynamics in the United States

Amanda C Perofsky et al. Elife. .

Abstract

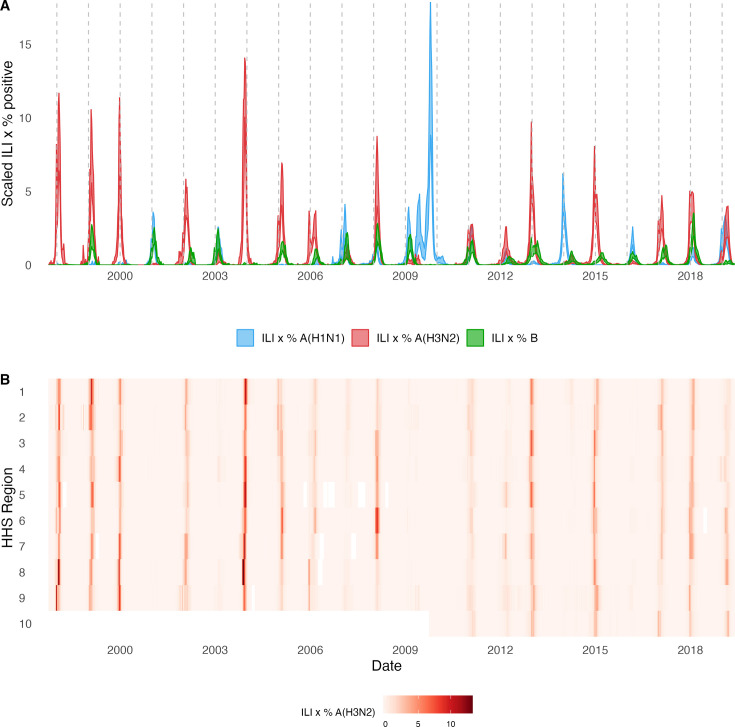
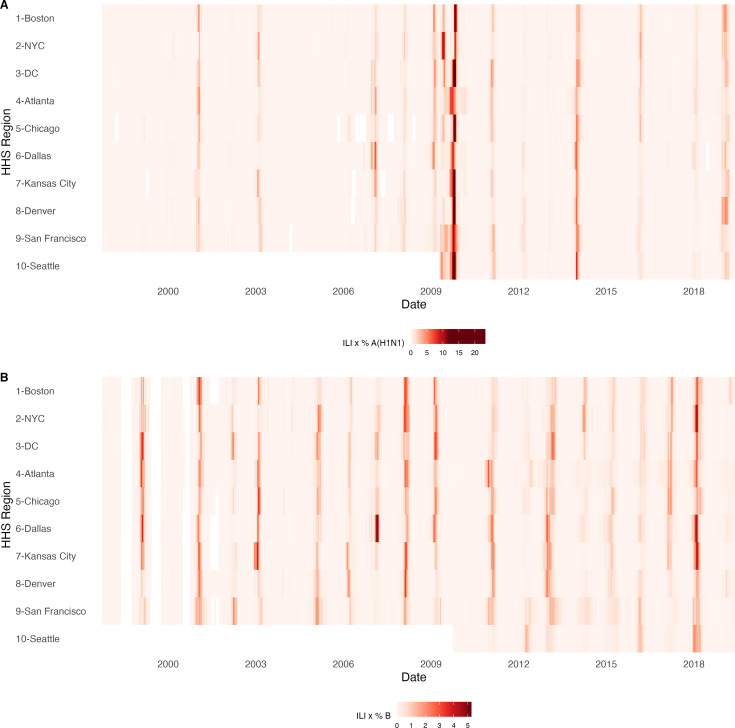
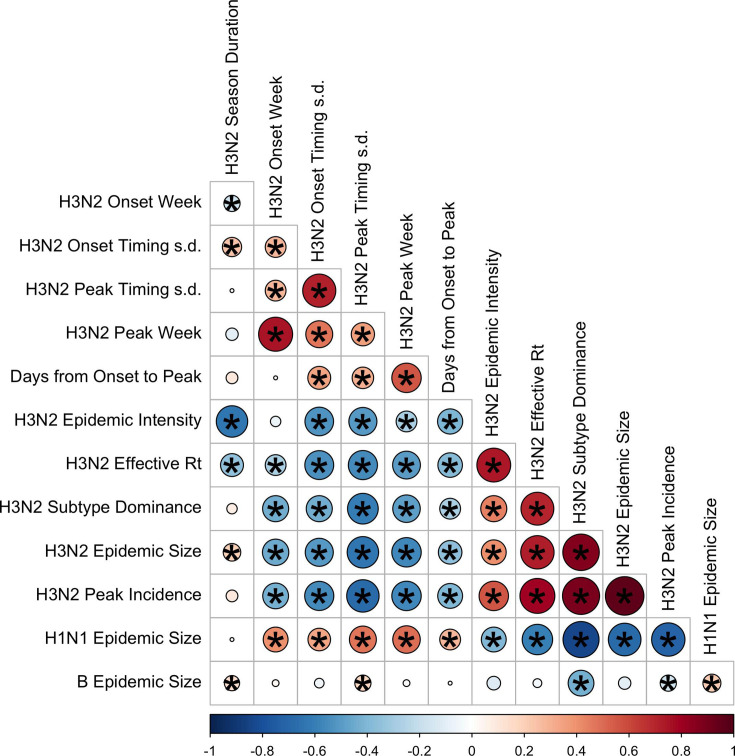
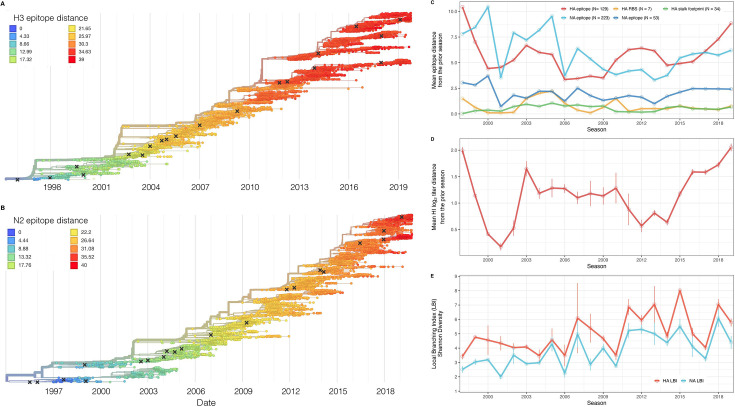
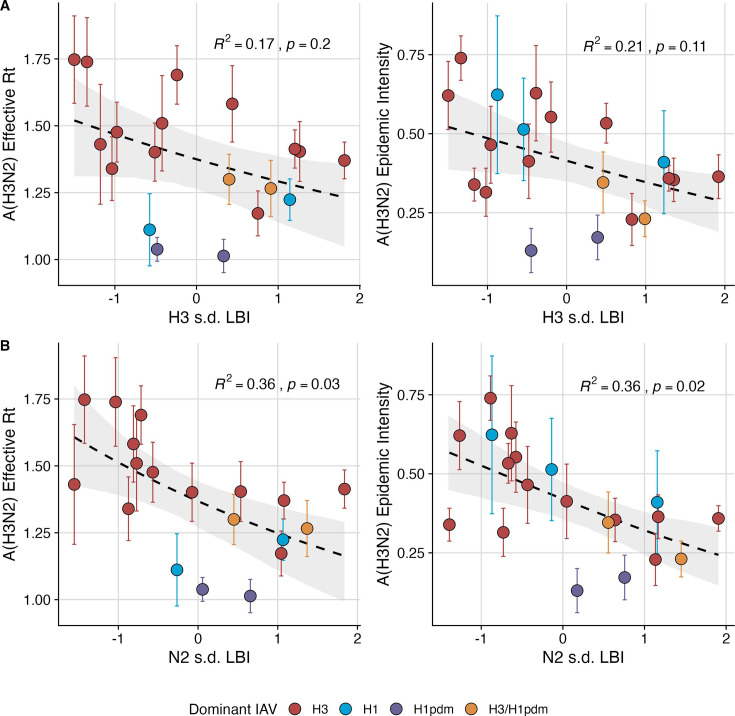
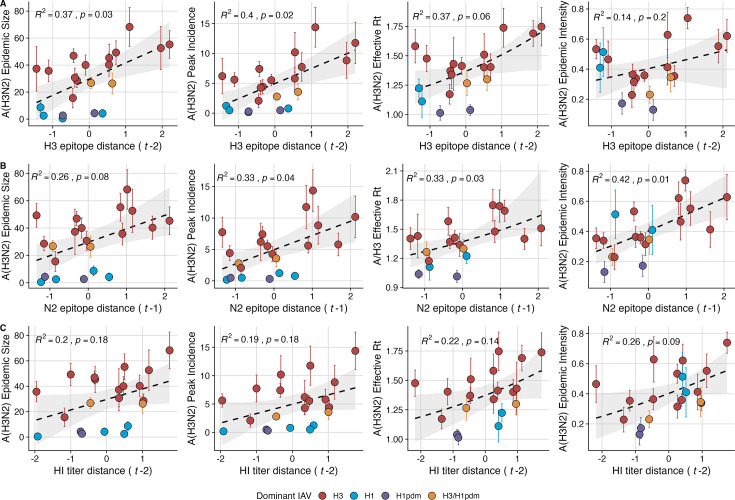
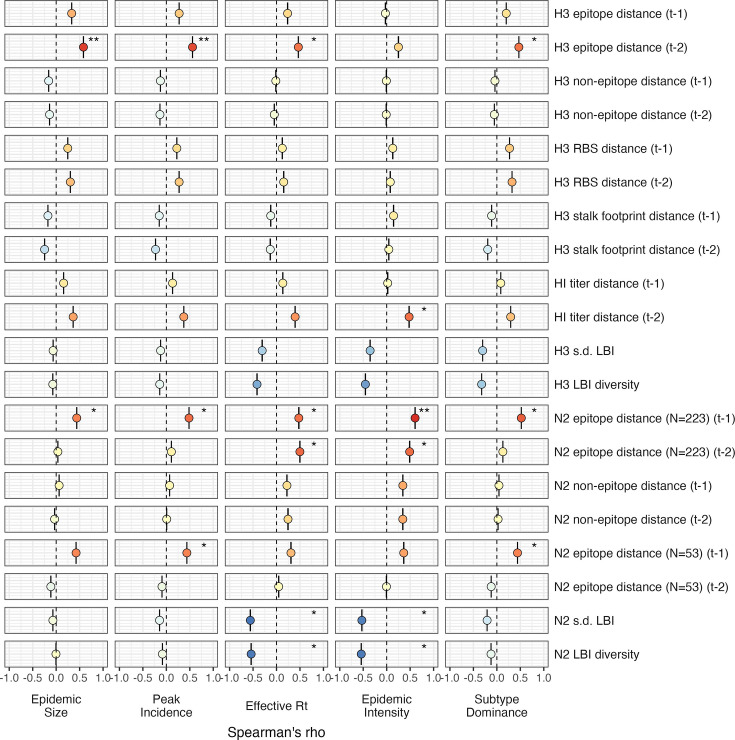
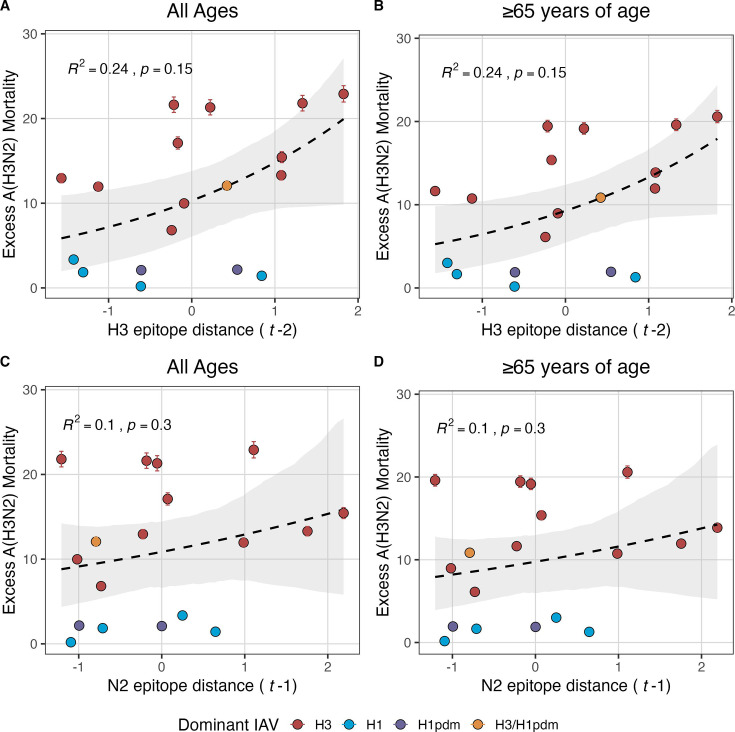
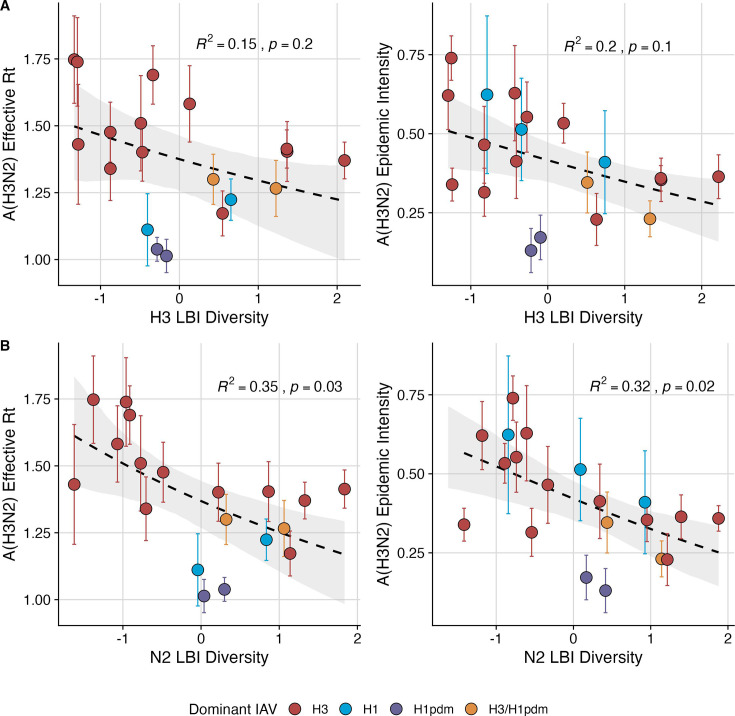
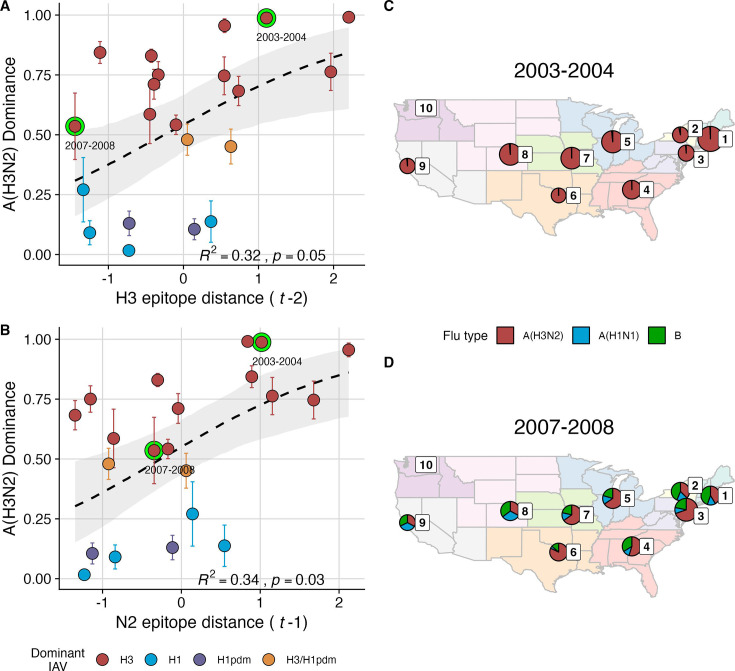
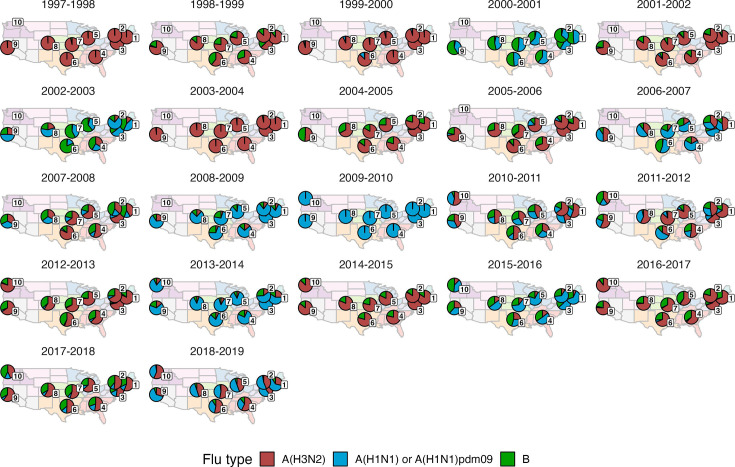
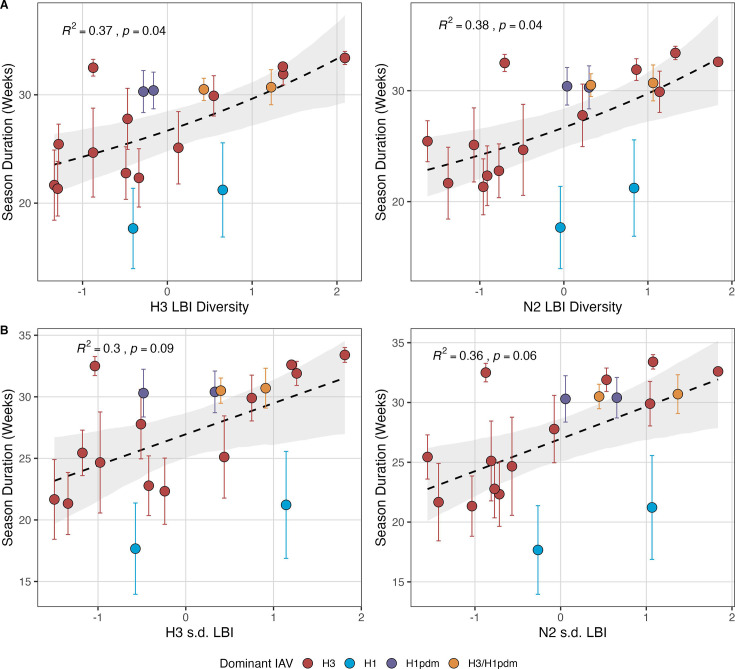
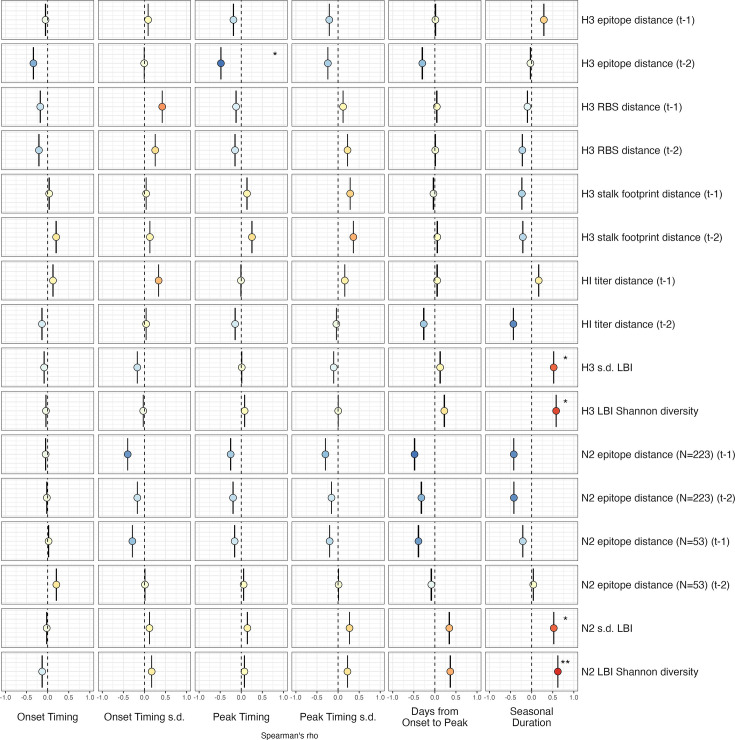
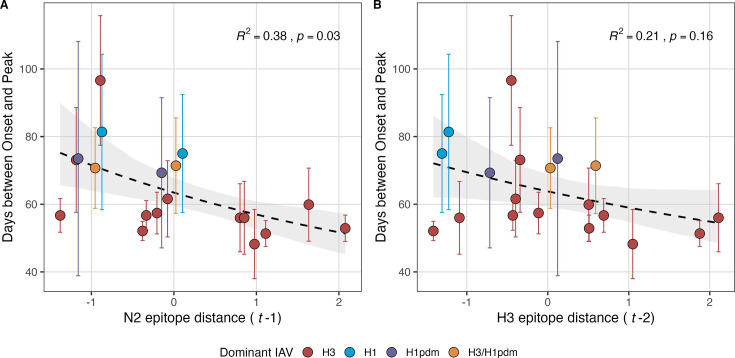
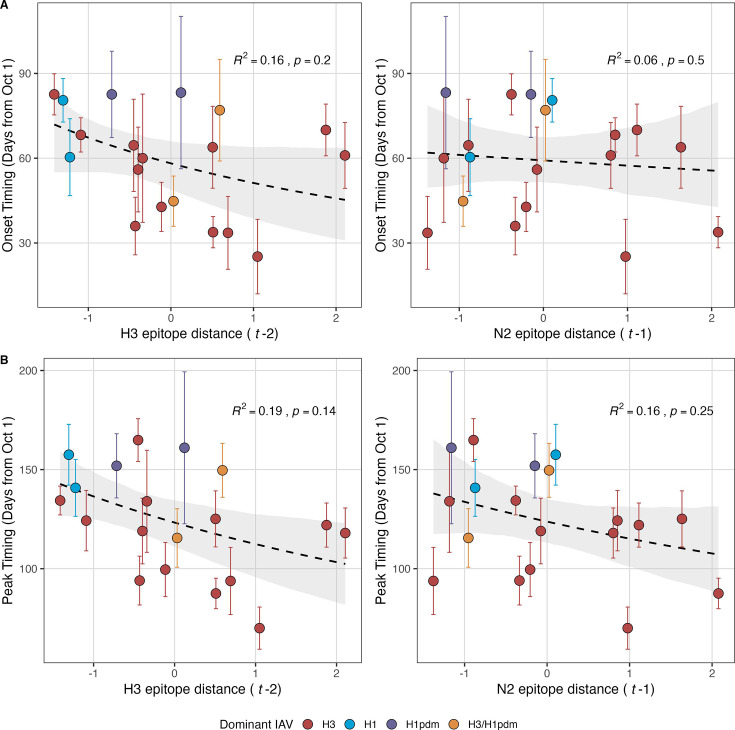
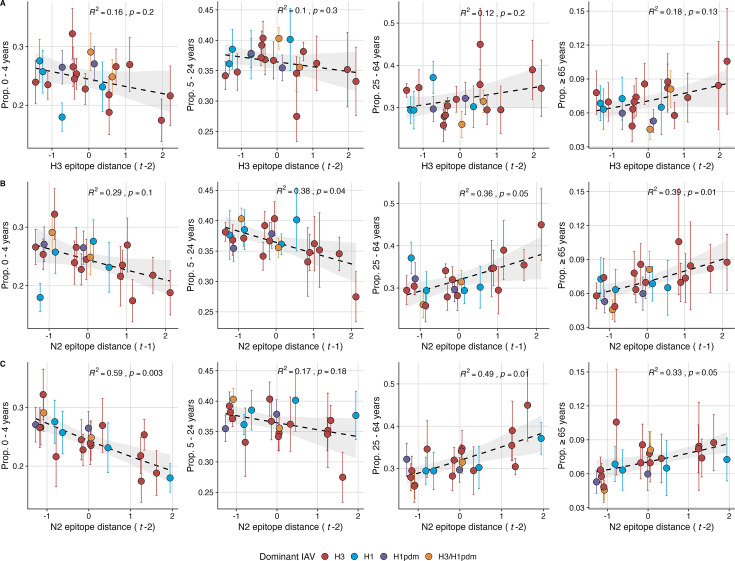
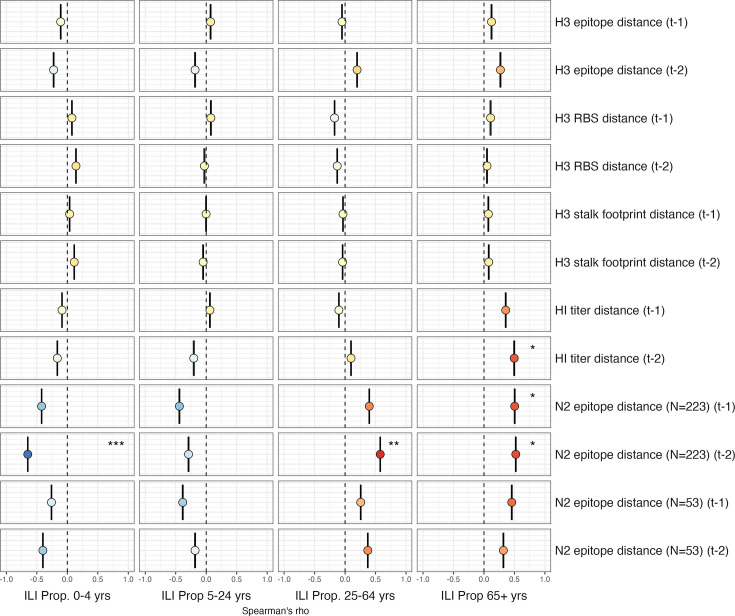
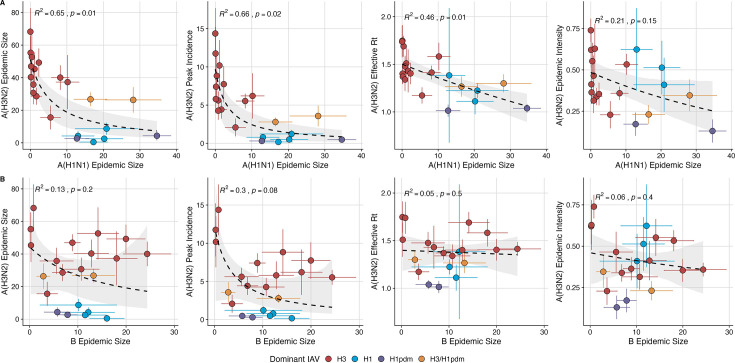
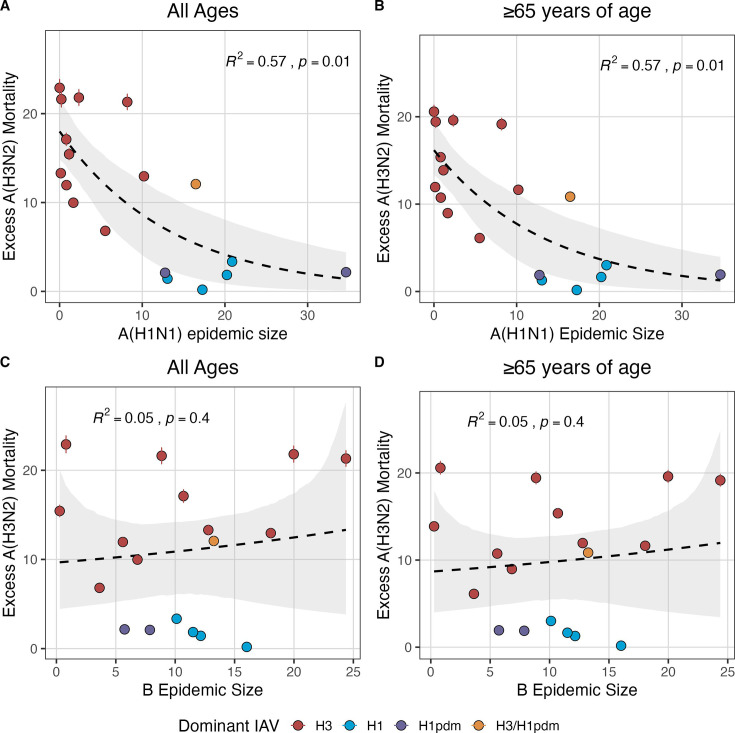
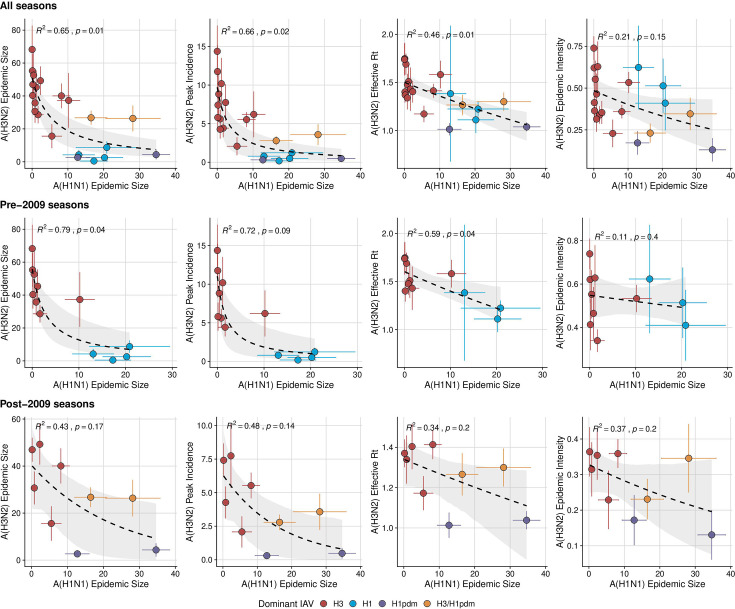
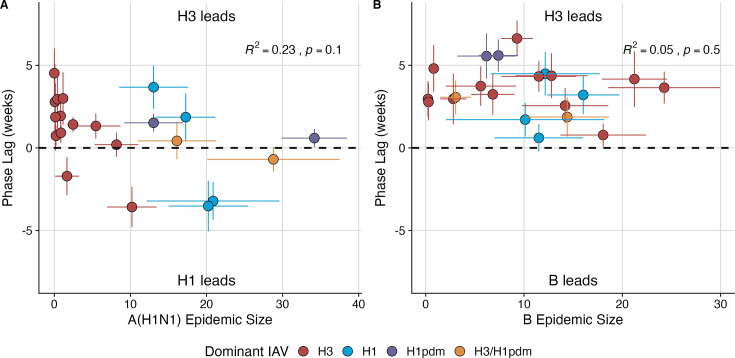
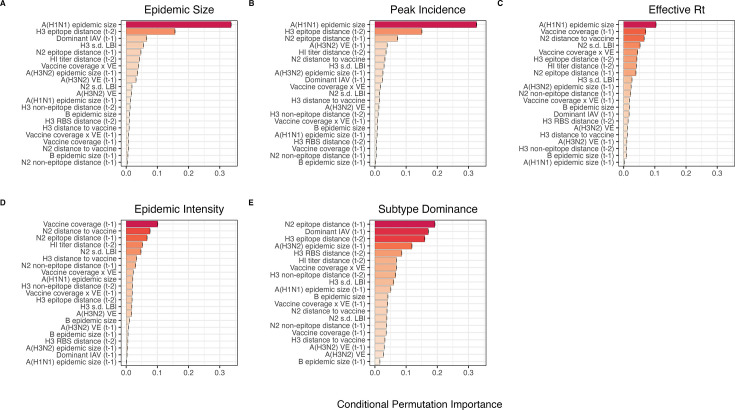
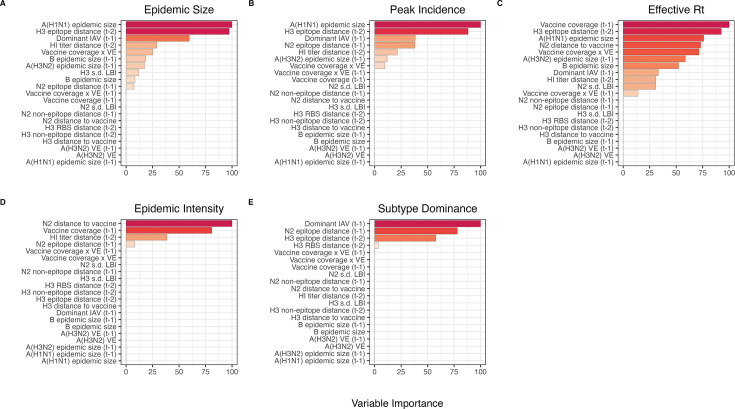
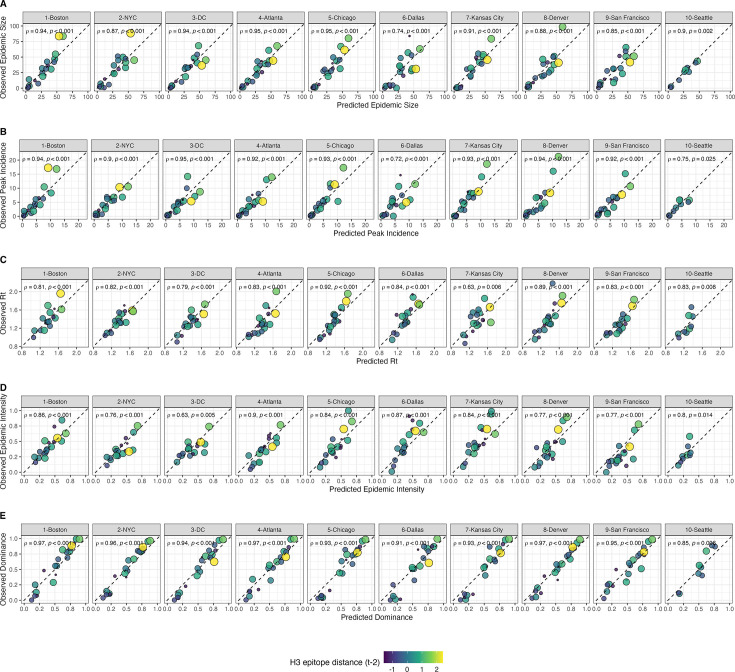
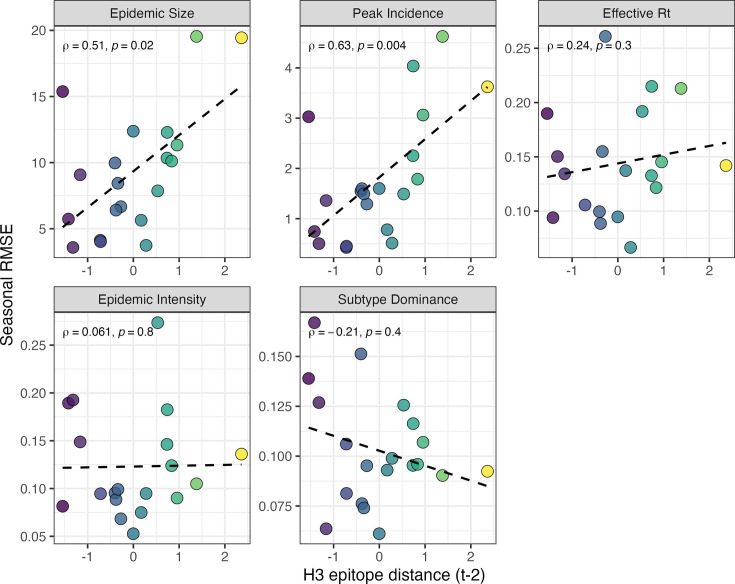
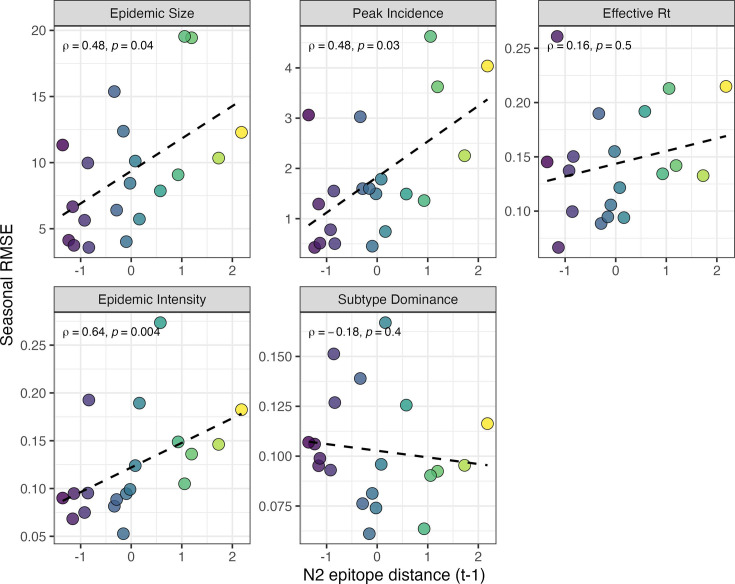
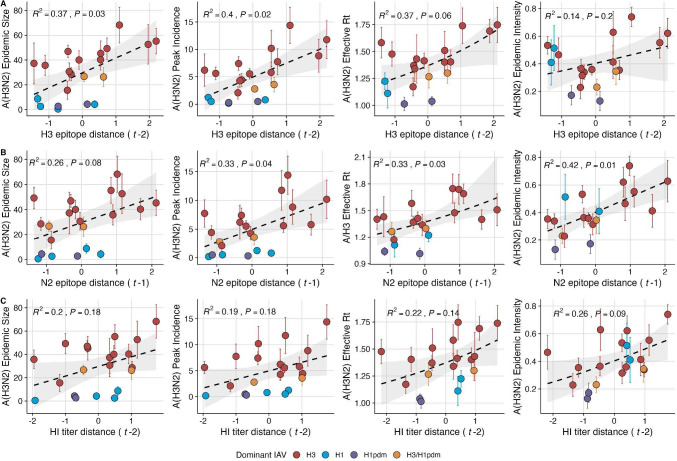
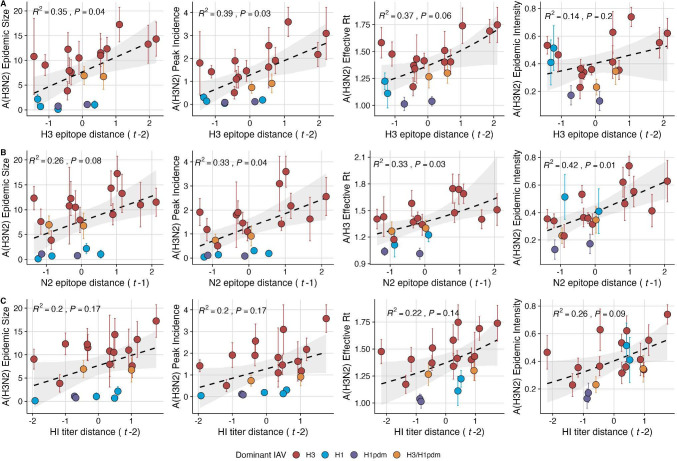
Influenza viruses continually evolve new antigenic variants, through mutations in epitopes of their major surface proteins, hemagglutinin (HA) and neuraminidase (NA). Antigenic drift potentiates the reinfection of previously infected individuals, but the contribution of this process to variability in annual epidemics is not well understood. Here, we link influenza A(H3N2) virus evolution to regional epidemic dynamics in the United States during 1997-2019. We integrate phenotypic measures of HA antigenic drift and sequence-based measures of HA and NA fitness to infer antigenic and genetic distances between viruses circulating in successive seasons. We estimate the magnitude, severity, timing, transmission rate, age-specific patterns, and subtype dominance of each regional outbreak and find that genetic distance based on broad sets of epitope sites is the strongest evolutionary predictor of A(H3N2) virus epidemiology. Increased HA and NA epitope distance between seasons correlates with larger, more intense epidemics, higher transmission, greater A(H3N2) subtype dominance, and a greater proportion of cases in adults relative to children, consistent with increased population susceptibility. Based on random forest models, A(H1N1) incidence impacts A(H3N2) epidemics to a greater extent than viral evolution, suggesting that subtype interference is a major driver of influenza A virus infection ynamics, presumably via heterosubtypic cross-immunity.

Keywords: H3N2; antigenic drift; epidemiology; global health; human; infectious disease; influenza virus; microbiology; virus.

Plain language summary

Seasonal influenza (flu) viruses cause outbreaks every winter. People infected with influenza typically develop mild respiratory symptoms. But flu infections can cause serious illness in young children, older adults and people with chronic medical conditions. Infected or vaccinated individuals develop some immunity, but the viruses evolve quickly to evade these defenses in a process called antigenic drift. As the viruses change, they can re-infect previously immune people. Scientists update the flu vaccine yearly to keep up with this antigenic drift. The immune system fights flu infections by recognizing two proteins, known as antigens, on the virus’s surface, called hemagglutinin (HA) and neuraminidase (NA). However, mutations in the genes encoding these proteins can make them unrecognizable, letting the virus slip past the immune system. Scientists would like to know how these changes affect the size, severity and timing of annual influenza outbreaks. Perofsky et al. show that tracking genetic changes in HA and NA may help improve flu season predictions. The experiments compared the severity of 22 flu seasons caused by the A(H3N2) subtype in the United States with how much HA and NA had evolved since the previous year. The A(H3N2) subtype experiences the fastest rates of antigenic drift and causes more cases and deaths than other seasonal flu viruses. Genetic changes in HA and NA were a better predictor of A(H3N2) outbreak severity than the blood tests for protective antibodies that epidemiologists traditionally use to track flu evolution. However, the prevalence of another subtype of influenza A circulating in the population, called A(H1N1), was an even better predictor of how severe A(H3N2) outbreaks would be. Perofsky et al. are the first to show that genetic changes in NA contribute to the severity of flu seasons. Previous studies suggested a link between genetic changes in HA and flu season severity, and flu vaccines include the HA protein to help the body recognize new influenza strains. The results suggest that adding the NA protein to flu vaccines may improve their effectiveness. In the future, flu forecasters may want to analyze genetic changes in both NA and HA to make their outbreak predictions. Tracking how much of the A(H1N1) subtype is circulating may also be useful for predicting the severity of A(H3N2) outbreaks.


Conflict of interest statement

AP, JH, JB, TR, XX, RK, DW, NL, LW, BE, RH, MG, RD, SF, KN, NK, SW, HH, TB No competing interests declared, CH Received personal fees from Sanofi outside the submitted work, JM Received consulting fees, honoraria, and travel support from Sanofi Pasteur and Sequris, SS The WHO Collaborating Centre for Reference and Research on Influenza in Melbourne has a collaborative research and development agreement (CRADA) with CSL Seqirus for isolation of candidate vaccine viruses in cells and an agreement with IFPMA for isolation of candidate vaccine viruses in eggs. SGS reports honoraria from CSL Seqirus, Moderna, Pfizer, and Evo Health, IB, KS The WHO Collaborating Centre for Reference and Research on Influenza in Melbourne has a collaborative research and development agreement (CRADA) with CSL Seqirus for isolation of candidate vaccine viruses in cells and an agreement with IFPMA for isolation of candidate vaccine viruses in eggs, FK The Icahn School of Medicine at Mount Sinai has filed patent applications relating to influenza virus vaccines (U.S. patent numbers: 12030928, 11865173, 11266734, 11254733, 10736956, 10583188, 10137189, 10131695, 9968670, 9371366; publication numbers: 20230181715, 20220403358, 20220249652, 20220242935, 20220153873, 20210260179, 20190125859, 20190106461, 20180333479), SARS-CoV-2 serological assays (publication number: 20240210415), and SARS-CoV-2 vaccines (publication numbers: 20230310583, 20230226171), which list FK as co-inventor. FK has consulted for Merck and Pfizer (before 2020), and is currently consulting for Pfizer, Seqirus, 3rd Rock Ventures, GSK and Avimex. The Krammer laboratory is also collaborating with Pfizer on animal models of SARS‐CoV‐2 and with Dynavax on universal influenza virus vaccines, CV Received honoraria for serving as an Editor in Chief of the journal Epidemics (Elsevier)

Figures

Figure 1.
Figure 1.. Annual influenza A(H3N2) epidemics in the United States, 1997 – 2019.
(A) Weekly incidence of influenza A(H1N1) (blue), A(H3N2) (red), and B (green) averaged across 10 HHS regions (Region 1: Boston; Region 2: New York City; Region 3: Washington, DC; Region 4: Atlanta; Region 5: Chicago; Region 6: Dallas, Region 7: Kansas City; Region 8: Denver; Region 9: San Francisco; Region 10: Seattle). Incidences are the proportion of influenza-like illness (ILI) visits among all outpatient visits, multiplied by the proportion of respiratory samples testing positive for each influenza type/subtype. Time series are 95% confidence intervals of regional incidence estimates. Vertical dashed lines indicate January 1 of each year. (B) Intensity of weekly influenza A(H3N2) incidence in 10 HHS regions. White tiles indicate weeks when influenza-like-illness data or virological data were not reported. Data for Region 10 are not available in seasons prior to 2009.
Figure 1—figure supplement 1.
Figure 1—figure supplement 1.. Annual influenza A(H1N1) and influenza B epidemics in the United States, 1997 - 2019.
Intensity of weekly (A) influenza A(H1N1) and (B) influenza B incidence in 10 HHS regions. Incidences are the proportion of influenza-like illness (ILI) visits among all outpatient visits, multiplied by the proportion of respiratory samples testing positive for each influenza type/subtype. Seasonal and pandemic A(H1N1) are combined as influenza A(H1N1), and the Victoria and Yamagata lineages of influenza B are combined as influenza B. White tiles indicate weeks when either influenza-like-illness cases or virological data were not reported. Data for Region 10 are not available in seasons prior to 2009.
Figure 1—figure supplement 2.
Figure 1—figure supplement 2.. Influenza test volume systematically increases in all HHS regions after the 2009 A(H1N1) pandemic.
Each point represents the total number of influenza tests in each HHS region in each season, as reported by the U.S. CDC WHO Collaborating Center for Surveillance, Epidemiology and Control of Influenza. In each boxplot, the whiskers extend to the first and third quartiles of the distribution, and the centre bar represents the median number of specimens. Data for Region 10 are not available in seasons prior to 2009.
Figure 1—figure supplement 3.
Figure 1—figure supplement 3.. Pairwise correlations between seasonal influenza A(H3N2), A(H1N1), and B epidemic metrics.
Spearman’s rank correlations among indicators of A(H3N2) epidemic timing, including onset week, peak week, regional variation (s.d.) in onset and peak timing, the number of days from epidemic onset to peak incidence, and seasonal duration, indicators of A(H3N2) epidemic magnitude, including epidemic intensity (i.e. the ‘sharpness’ of the epidemic curve), transmissibility (maximum effective reproduction number, Rt), subtype dominance, epidemic size, and peak incidence. Correlations between the circulation of other influenza types/subtypes and A(H3N2) epidemic burden and timing are also included. The color of each circle indicates the strength and direction of the association, from dark red (strong positive correlation) to dark blue (strong negative correlation). Stars within circles indicate statistical significance (adjusted p<0.05). The Benjamini and Hochberg method was used to adjust p-values for multiple testing.
Figure 2.
Figure 2.. Antigenic and genetic evolution of seasonal influenza A(H3N2) viruses, 1997 – 2019.
(A–B) Temporal phylogenies of (A) hemagglutinin (H3) and (B) neuraminidase (N2) gene segments. Tip color denotes the Hamming distance from the root of the tree, based on the number of substitutions at epitope sites in H3 (N=129 sites) and N2 (N=223 sites). Black ‘X’ marks indicate the phylogenetic positions of U.S. recommended vaccine strains. (C–D) Seasonal genetic and antigenic distances are the mean distance between A(H3N2) viruses circulating in the current season t and viruses circulating in the prior season (t – 1), measured by (C) five sequence-based metrics (HA epitope (N=129), HA receptor binding site (RBS) (N=7), HA stalk footprint (N=34), NA epitope (N=223 or N=53)) and (D) hemagglutination inhibition (HI) titer measurements. (E) The Shannon diversity of H3 and N2 local branching index (LBI) values in each season. Vertical bars in (C), (D), and (E) are 95% confidence intervals of seasonal estimates from five bootstrapped phylogenies.
Figure 2—figure supplement 1.
Figure 2—figure supplement 1.. The number of A/H3 sequences in five subsampled datasets in each month and in each influenza season.
In each figure, the five subsampled datasets are plotted individually but individual time series are difficult to discern due to minor differences in sequence counts across the datasets. (A) The number of sequences in subsampled datasets in each month collected in North America (purple) versus nine other world regions combined (dark green). (B) The total number of sequences in subsampled datasets collected in each month in all world regions combined. (C) The number of sequences in subsampled datasets in each season collected in North America (purple) versus nine other world regions combined (dark green). (D) The total number of sequences in subsampled datasets collected in each season in all world regions combined.
Figure 2—figure supplement 2.
Figure 2—figure supplement 2.. The number of A/N2 sequences in five subsampled datasets in each month and in each influenza season.
In each figure, the five subsampled datasets are plotted individually but individual time series are difficult to discern due to minor differences in sequence counts across the datasets. (A) The number of sequences in subsampled datasets in each month collected in North America (purple) versus nine other world regions combined (dark green). (B) The total number of sequences in subsampled datasets collected in each month in all world regions combined. (C) The number of sequences in subsampled datasets in each season collected in North America (purple) versus nine other world regions combined (dark green). (D) The total number of sequences in subsampled datasets in each season in all world regions combined.
Figure 2—figure supplement 3.
Figure 2—figure supplement 3.. Comparison of seasonal antigenic drift measured by substitutions at H3 epitope sites and HI log2 titer measurements, from seasons 1997–1998 to 2018–2019.
Spearman’s rank correlations between H3 epitope distance and HI log2 titer distance at (A) one-season lags and (B) two-season lags. Correlation coefficients and associated p-values are shown in the top right section of each plot. Seasonal antigenic distance is the mean distance between viruses circulating in the current season t and viruses circulating in the prior season (t – 1 year, one-season lags) or two prior seasons ago (t – 2 years, two-season lags). Seasonal distances are scaled because H3 epitope distance and HI log2 titer distance use different units of measurement. Point labels indicate the current influenza season, and point color denotes the relative timing of influenza seasons, with earlier seasons shaded dark purple (e.g. 1997–1998) and later seasons shaded light yellow (e.g. 2018–2019). H3 epitope distance and HI log2 titer distance at two-season lags capture expected ‘jumps’ in antigenic drift during key seasons previously associated with major antigenic transitions (Smith et al., 2004), such as the SY97 cluster seasons (1997–1998, 1998–1999, 1999–2000), the FU02 cluster season (2003–2004), and the CA04 cluster season (2004–2005).
Figure 2—figure supplement 4.
Figure 2—figure supplement 4.. Pairwise correlations between H3 and N2 evolutionary indicators (one-season lags).
Spearman’s rank correlations between seasonal measures of H3 and N2 evolution, including H3 RBS distance, H3 epitope distance, H3 non-epitope distance, H3 stalk footprint distance, HI log2 titer distance, N2 epitope distance based on 223 or 53 epitope sites, N2 non-epitope distance, and the standard deviation (s.d.) and Shannon diversity of H3 and N2 local branching index (LBI) values in the current season t. Seasonal distances were estimated as the mean distance between viruses circulating in the current season t and viruses circulating in the prior season (t – 1). The color of each circle indicates the strength and direction of the association, from dark red (strong positive correlation) to dark blue (strong negative correlation). Stars within circles indicate statistical significance (adjusted p<0.05). The Benjamini and Hochberg method was used to adjust p-values for multiple testing.
Figure 2—figure supplement 5.
Figure 2—figure supplement 5.. Pairwise correlations between H3 and N2 evolutionary indicators (two-season lags).
We measured Spearman’s rank correlations between seasonal measures of H3 and N2 evolution, including H3 RBS distance, H3 epitope distance, H3 non-epitope distance, H3 stalk footprint distance, HI log2 titer distance, N2 epitope distance based on 223 or 53 epitope sites, N2 non-epitope distance, and the standard deviation (s.d.) and Shannon diversity of H3 and N2 local branching index (LBI) values in the current season t. Seasonal distances were estimated as the mean distance between viruses circulating in the current season t and viruses circulating two prior seasons ago (t – 2). The color of each circle indicates the strength and direction of the association, from dark red (strong positive correlation) to dark blue (strong negative correlation). Stars within circles indicate statistical significance (adjusted p<0.05). The Benjamini and Hochberg method was used to adjust p-values for multiple testing.
Figure 2—figure supplement 6.
Figure 2—figure supplement 6.. Pairwise correlations between H3 and N2 evolutionary indicators (one- and two-season lags).
We measured Spearman’s rank correlations between seasonal measures of H3 and N2 evolution, including H3 RBS distance, H3 epitope distance, H3 non-epitope distance, H3 stalk footprint distance, HI log2 titer distance, N2 epitope distance based on 223 or 53 epitope sites, N2 non-epitope distance, and the standard deviation (s.d.) and Shannon diversity of H3 and N2 local branching index (LBI) values in the current season t. Seasonal distances were estimated as the mean distance between viruses circulating in the current season t and viruses circulating in the prior season (t – 1) or two prior seasons ago (t – 2). The color of each circle indicates the strength and direction of the association, from dark red (strong positive correlation) to dark blue (strong negative correlation). Stars within circles indicate statistical significance (adjusted p<0.05). The Benjamini and Hochberg method was used to adjust p-values for multiple testing.
Figure 2—figure supplement 7.
Figure 2—figure supplement 7.. Comparison of seasonal antigenic drift measured by substitutions at H3 and N2 epitope sites, from seasons 1997–1998 to 2018–2019.
Spearman’s rank correlations between H3 epitope distance and N2 epitope distance at (A) one-season lags and (B) two-season lags. Correlation coefficients and associated p-values are shown in the top right section of each plot. Seasonal epitope distance is the mean distance between viruses circulating in the current season t and viruses circulating in the prior season t – 1 (one-season lag) or two prior seasons ago t – 2 (two-season lag). Point labels indicate the current influenza season, and point color denotes the relative timing of influenza seasons, with earlier seasons shaded dark purple (e.g. 1997–1998) and later seasons shaded light yellow (e.g. 2018–2019). H3 epitope distance at two-season lags and N2 epitope distance at one-season lags capture expected ‘jumps’ in antigenic drift during key seasons previously associated with major antigenic transitions (Smith et al., 2004), such as the SY97 cluster seasons (1997–1998, 1998–1999, 1999–2000), the FU02 cluster season (2003–2004), and the CA04 cluster season (2004–2005).
Figure 3.
Figure 3.. Influenza A(H3N2) antigenic drift correlates with larger, more intense annual epidemics.
A(H3N2) epidemic size, peak incidence, transmissibility (effective reproduction number, Rt), and epidemic intensity increase with antigenic drift, measured by (A) hemagglutinin (H3) epitope distance, (B) neuraminidase (N2) epitope distance, and (C) hemagglutination inhibition (HI) log2 titer distance. Seasonal antigenic drift is the mean titer distance or epitope distance between viruses circulating in the current season t and viruses circulating in the prior season (t – 1) or two prior seasons ago (t – 2). Distances are scaled to aid in direct comparison of evolutionary indicators. Point color indicates the dominant influenza A virus (IAV) subtype based on CDC influenza season summary reports (red: A(H3N2), blue: A(H1N1), purple: A(H1N1)pdm09, orange: A(H3N2)/A(H1N1)pdm09 co-dominant), and vertical bars are 95% confidence intervals of regional estimates (pre-2009 seasons: 9 regions; post-2009 seasons: 10 regions). Seasonal mean A(H3N2) epidemic metric values were fit as a function of antigenic or genetic distance using LMs (epidemic size, peak incidence), Gaussian GLMs (effective Rt: inverse link), or Beta GLMs (epidemic intensity: logit link) with 1000 bootstrap resamples. In each plot, the black dashed line represents the mean regression fit, and the gray shaded band shows the 95% confidence interval, based on 1000 bootstrap resamples. The R2 and associated p-value from the mean regression fit are in the top left section of each plot.
Figure 3—figure supplement 1.
Figure 3—figure supplement 1.. Univariate correlations between influenza A(H3N2) evolutionary indictors and epidemic impact.
Mean Spearman’s rank correlation coefficients, 95% confidence intervals of correlation coefficients, and corresponding p-values of bootstrapped (N=1000) evolutionary indicators (rows) and epidemic metrics (columns). Point color indicates the strength and direction of the association, from dark red (strong positive correlation) to dark blue (strong negative correlation), and stars indicate statistical significance (* p<0.05, ** p<0.01, *** p<0.001). Abbreviations: t – 1, one-season lag; t – 2, two-season lag; RBS, receptor binding site; HI, hemagglutination inhibition; s.d., standard deviation; LBI, local branching index.
Figure 3—figure supplement 2.
Figure 3—figure supplement 2.. Excess influenza A(H3N2) mortality increases with H3 and N2 epitope distance, but correlations are not statistically significant.
Relationships between seasonal excess influenza A(H3N2) mortality and epitope distance are organized by gene segment and age group: (A) H3 epitope distance and all age groups, (B) H3 epitope distance and individuals aged ≥65 years, (C) N2 epitope distance and all age groups, and (D) N2 epitope distance and individuals aged ≥65 years. The number of excess influenza deaths attributable to A(H3N2) (per 100,000 people) were estimated from a seasonal regression model fit to weekly pneumonia and influenza-coded deaths in the United States (Hansen et al., 2022). Seasonal epitope distance is the mean distance between viruses circulating in the current season t and viruses circulating in the prior season (t – 1) or two prior seasons ago (t – 2). Distances are scaled to aid in direct comparison of evolutionary indicators. Point color indicates the dominant influenza A subtype based on CDC influenza season summary reports (red: A(H3N2), blue: A(H1N1), purple: A(H1N1)pdm09, orange: A(H3N2)/A(H1N1)pdm09 co-dominant), and vertical bars are 95% confidence intervals of excess mortality model estimates. Seasonal national excess mortality estimates were fit as a function of H3 or N2 epitope distance using Gaussian GLMs (log link) with 1000 bootstrap resamples. In each plot, the black dashed line represents the mean regression fit, and the gray shaded band shows the 95% confidence interval, based on 1000 bootstrap resamples. The R2 and associated p-value from the mean regression fit are in the top left section of each plot.
Figure 3—figure supplement 3.
Figure 3—figure supplement 3.. Low seasonal diversity in the clade growth rates of circulating A(H3N2) viruses, as measured by the standard deviation of local branching index values, correlates with higher transmissibility and greater epidemic intensity.
A(H3N2) effective Rt and epidemic intensity negatively correlate with the seasonal diversity of local branching index (LBI) values among circulating A(H3N2) lineages in the current season, measured by the standard deviation (s.d.) of (A) H3 LBI values, and (B) N2 LBI values. LBI values are scaled to aid in direct comparisons of H3 and N2 s.d. LBI values. Point color indicates the dominant influenza A subtype based on CDC influenza season summary reports (red: A(H3N2), blue: A(H1N1), purple: A(H1N1)pdm09, orange: A(H3N2)/A(H1N1)pdm09 co-dominant), and vertical bars are 95% confidence intervals of regional estimates (pre-2009 seasons: 9 regions; post-2009 seasons: 10 regions). Seasonal mean A(H3N2) epidemic metric values were fit as a function of H3 or N2 LBI diversity using Gaussian GLMs (effective Rt: inverse link) or Beta GLMs (epidemic intensity: logit link) with 1000 bootstrap resamples. In each plot, the black dashed line represents the mean regression fit, and the gray shaded band shows the 95% confidence interval, based on 1000 bootstrap resamples. The R2 and associated p-value from the mean regression fit are in the top right section of each plot.
Figure 3—figure supplement 4.
Figure 3—figure supplement 4.. Low seasonal diversity in the clade growth rates of circulating A(H3N2) viruses, as measured by the Shannon diversity of local branching index values, correlates with higher transmissibility and greater epidemic intensity.
A(H3N2) effective Rt and epidemic intensity negatively correlate with the seasonal diversity of local branching index (LBI) values among circulating A(H3N2) lineages in the current season, measured by the Shannon diversity of (A) H3 LBI values, and (B) N2 LBI values. LBI values are scaled to aid in direct comparisons of H3 and N2 LBI diversity values. Point color indicates the dominant influenza A subtype based on CDC influenza season summary reports (red: A(H3N2), blue: A(H1N1), purple: A(H1N1)pdm09, orange: A(H3N2)/A(H1N1)pdm09 co-dominant), and vertical bars are 95% confidence intervals of regional estimates (pre-2009 seasons: 9 regions; post-2009 seasons: 10 regions). Seasonal mean A(H3N2) epidemic metric values were fit as a function of H3 or N2 LBI diversity using Gaussian GLMs (effective Rt: inverse link) or Beta GLMs (epidemic intensity: logit link) with 1000 bootstrap resamples. In each plot, the black dashed line represents the mean regression fit, and the gray shaded band shows the 95% confidence interval, based on 1000 bootstrap resamples. The R2 and associated p-value from the mean regression fit are in the top right section of each plot.
Figure 4.
Figure 4.. The proportion of influenza positive samples typed as A(H3N2) increases with antigenic drift.
(A-B) Seasonal A(H3N2) subtype dominance increases with (A) hemagglutinin (H3) and (B) neuraminidase (N2) epitope distance. Seasonal epitope distance is the mean epitope distance between viruses circulating in the current season t and viruses circulating in the prior season (t - 1) or two prior seasons ago (t - 2). Distances were scaled to aid in direct comparison of evolutionary indicators. Point color indicates the dominant influenza A virus (IAV) subtype based on CDC influenza season summary reports (red: A(H3N2), blue: A(H1N1), purple: A(H1N1)pdm09, orange: A(H3N2)/A(H1N1)pdm09 co-dominant), and vertical bars are 95% confidence intervals of regional estimates (pre-2009 seasons: 9 regions; post-2009 seasons: 10 regions). Seasonal mean A(H3N2) dominance was fit as a function of H3 or N2 epitope distance using Beta GLMs with 1000 bootstrap resamples. In (A) and (B), the dashed black line represents the mean regression fit, and the gray shaded band shows the 95% confidence interval, based on 1000 bootstrap resamples. The R2 and associated p-value from the mean regression fit are in the bottom right section of each plot. (C–D) Regional patterns of influenza type and subtype incidence during two seasons when A(H3N2) was nationally dominant. Pie charts represent the proportion of influenza positive samples typed as A(H3N2) (red), A(H1N1) (blue), or B (green) in each HHS region. The sizes of regional pie charts are proportional to the total number of influenza positive samples. Data for Region 10 (purple) are not available for seasons prior to 2009. (C) Widespread A(H3N2) dominance during 2003–2004 after the emergence of a novel antigenic cluster, FU02 (A/Fujian/411/2002-like strains). (D) Spatial heterogeneity in subtype circulation during 2007–2008, a season with low A(H3N2) antigenic novelty relative to the prior season.
Figure 4—figure supplement 1.
Figure 4—figure supplement 1.. Regional patterns of influenza type and subtype circulation during seasons 1997–1998 to 2018–2019.
Pie charts represent the proportion of influenza positive samples that were typed as A(H3N2), A(H1N1) or A(H1N1)pdm09, and B in each HHS region. Data for Region 10 (purple) are not available for seasons prior to 2009.
Figure 5.
Figure 5.. Influenza A(H3N2) seasonal duration increases with the diversity of hemagglutinin (H3) and neuraminidase (N2) clade growth rates in each season.
Seasonal diversity of clade growth rates is measured as the (A) Shannon diversity or (B) standard deviation (s.d.) of H3 and N2 local branching index (LBI) values of viruses circulating in each season. LBI values are scaled to aid in direct comparisons of different LBI diversity metrics. Point color indicates the dominant influenza A subtype based on CDC influenza season summary reports (red: A(H3N2), blue: A(H1N1), purple: A(H1N1)pdm09, orange: A(H3N2)/A(H1N1)pdm09 co-dominant), and vertical bars are 95% confidence intervals of regional estimates (pre-2009 seasons: 9 regions; post-2009 seasons: 10 regions). Mean seasonal duration was fit as a function of H3 or N2 LBI diversity using Gaussian GLMs (inverse link) with 1000 bootstrap resamples. In each plot, the black dashed line represents the mean regression fit, and the gray shaded band shows the 95% confidence interval, based on 1000 bootstrap resamples. The R2 and associated p-value from the mean regression fit are in the top left section of each plot.
Figure 5—figure supplement 1.
Figure 5—figure supplement 1.. Univariate correlations between influenza A(H3N2) evolutionary indicators and epidemic timing.
Mean Spearman’s rank correlation coefficients, 95% confidence intervals of correlation coefficients, and corresponding p-values of bootstrapped (N=1000) evolutionary indicators (columns) and epidemic timing metrics (rows). Epidemic timing metrics are the week of epidemic onset, regional variation (s.d.) in onset timing, the week of epidemic peak, regional variation (s.d.) in peak timing, the number of days between epidemic onset and peak, and seasonal duration. Color indicates the strength and direction of the association, from dark red (strong positive correlation) to dark blue (strong negative correlation), and stars indicate statistical significance (* p<0.05, ** p<0.01, *** p<0.001). Abbreviations: t – 1, one-season lag; t – 2, two-season lag; RBS, receptor binding site; HI, hemagglutination inhibition; s.d., standard deviation; LBI, local branching index.
Figure 5—figure supplement 2.
Figure 5—figure supplement 2.. Epidemic speed increases with N2 antigenic drift.
N2 epitope distance significantly correlates with fewer days from epidemic onset to peak (A), while the relationship between H3 epitope distance and epidemic speed is weaker (B). Seasonal epitope distance is the mean distance between viruses circulating in the current season t and viruses circulating in the prior season (t – 1) or two prior seasons ago (t – 2). Distances are scaled to aid in direct comparison of evolutionary indicators. Point color indicates the dominant influenza A subtype based on CDC influenza season summary reports (red: A(H3N2), blue: A(H1N1), purple: A(H1N1)pdm09, orange: A(H3N2)/A(H1N1)pdm09 co-dominant), and vertical bars are 95% confidence intervals of regional estimates (pre-2009 seasons: 9 regions; post-2009 seasons: 10 regions). The seasonal mean number of days from onset to peak was fit as a function of H3 or N2 epitope distance using Gamma GLMs (inverse link) with 1000 bootstrap resamples. In each plot, the black dashed line represents the mean regression fit, and the gray shaded band shows the 95% confidence interval, based on 1000 bootstrap resamples. The R2 and associated p-value from the mean regression fit are in the top right section of each plot.
Figure 5—figure supplement 3.
Figure 5—figure supplement 3.. Influenza A(H3N2) epidemic onsets and peaks are earlier in seasons with high antigenic novelty, but correlations are not statistically significant.
(A) Epidemic onsets are earlier in seasons with increased H3 epitope distance (t – 2), but the correlation is not statistically significant. (B) Epidemic peaks are earlier in seasons with increased H3 epitope distance (t – 2) and N2 epitope distance (t – 1), but correlations are not statistically significant. Seasonal epitope distance is the mean distance between viruses circulating in the current season t and viruses circulating in the prior season (t – 1) or two prior seasons ago (t – 2). Distances are scaled to aid in direct comparison of evolutionary indicators. Point color indicates the dominant influenza A subtype based on CDC influenza season summary reports (red: A(H3N2), blue: A(H1N1), purple: A(H1N1)pdm09, orange: A(H3N2)/A(H1N1)pdm09 co-dominant), and vertical bars are 95% confidence intervals of regional estimates (pre-2009 seasons: 9 regions; post-2009 seasons: 10 regions). Seasonal mean epidemic onsets and peaks were fit as a function of H3 or N2 epitope distance using Gaussian GLMs (inverse link) with 1000 bootstrap resamples. In each plot, the black dashed line represents the mean regression fit, and the gray shaded band shows the 95% confidence interval, based on 1000 bootstrap resamples. The R2 and associated p-value from the mean regression fit are in the top left section of each plot.
Figure 6.
Figure 6.. The proportion of outpatient influenza-like illness (ILI) cases in adults increases with neuraminidase (N2) antigenic novelty.
N2 epitope distance, but not H3 epitope distance, significantly correlates with the age distribution of outpatient ILI cases. Seasonal epitope distance is the mean distance between viruses circulating in current season t and viruses circulating in the prior season (t – 1) or two prior seasons ago (t – 2). Distances are scaled to aid in direct comparison of evolutionary indicators. Point color indicates the dominant influenza A subtype based on CDC influenza season summary reports (red: A(H3N2), blue: A(H1N1), purple: A(H1N1)pdm09, orange: A(H3N2)/A(H1N1)pdm09 co-dominant), and vertical bars are 95% confidence intervals of regional age distribution estimates (pre-2009 seasons: 9 regions; post-2009 seasons: 10 regions). The seasonal mean fraction of cases in each age group were fit as a function of H3 or N2 epitope distance using Beta GLMs (logit link) with 1000 bootstrap resamples. In each plot, the black dashed line represents the mean regression fit, and the gray shaded band shows the 95% confidence interval, based on 1000 bootstrap resamples. The R2 and associated p-value from the mean regression fit are in the top right section of each plot.
Figure 6—figure supplement 1.
Figure 6—figure supplement 1.. Univariate correlations between A(H3N2) antigenic change and the age distribution of outpatient influenza-like illness (ILI) cases.
Mean Spearman’s rank correlation coefficients, 95% confidence intervals of correlation coefficients, and corresponding p-values of bootstrapped (N=1000) evolutionary indicators (rows) and the proportion of ILI cases in individuals aged <5 years, 5–24 years, 25–64 years, and ≥65 years (columns). Color indicates the strength and direction of the association, from dark red (strong positive correlation) to dark blue (strong negative correlation), and stars indicate statistical significance (* p<0.05, ** p<0.01, *** p<0.001). Abbreviations: t – 1, one-season lag; t – 2, two-season lag; RBS, receptor binding site; HI, hemagglutination inhibition.
Figure 7.
Figure 7.. The effects of influenza A(H1N1) and B epidemic size on A(H3N2) epidemic burden.
(A) Influenza A(H1N1) epidemic size negatively correlates with A(H3N2) epidemic size, peak incidence, transmissibility (effective reproduction number, Rt), and epidemic intensity. (B) Influenza B epidemic size does not significantly correlate with A(H3N2) epidemic metrics. Point color indicates the dominant influenza A virus (IAV) subtype based on CDC influenza season summary reports (red: A(H3N2), blue: A(H1N1), purple: A(H1N1)pdm09, orange: A(H3N2)/A(H1N1)pdm09 co-dominant), and vertical and horizontal bars are 95% confidence intervals of regional estimates (pre-2009 seasons: 9 regions; post-2009 seasons: 10 regions). Seasonal mean A(H3N2) epidemic metrics were fit as a function of mean A(H1N1) or B epidemic size using Gaussian GLMs (epidemic size and peak incidence: inverse link; effective Rt: log link) or Beta GLMs (epidemic intensity: logit link) with 1000 bootstrap resamples. In each plot, the black dashed line represents the mean regression fit, and the gray shaded band shows the 95% confidence interval, based on 1000 bootstrap resamples. The R2 and associated p-value from the mean regression fit are in the top left section of each plot.
Figure 7—figure supplement 1.
Figure 7—figure supplement 1.. National excess influenza A(H3N2) mortality decreases with A(H1N1) epidemic size but not B epidemic size.
Relationships between seasonal excess influenza A(H3N2) mortality and the circulation of A(H1N1) or B viruses are organized by influenza type/subtype and age group: (A) A(H1N1) epidemic size and all age groups, (B) A(H1N1) epidemic size and individuals aged ≥65 years, (C) B epidemic size and all age groups, and (D) B epidemic size and individuals aged ≥65 years. Excess influenza deaths attributable to A(H3N2) (per 100,000 people) were estimated from a seasonal regression model fit to weekly pneumonia and influenza-coded deaths. Point color indicates the dominant influenza A subtype based on CDC influenza season summary reports (red: A(H3N2), blue: A(H1N1), purple: A(H1N1)pdm09, orange: A(H3N2)/A(H1N1)pdm09 co-dominant), and vertical bars are 95% confidence intervals of excess mortality model estimates. Seasonal national excess mortality estimates were fit as a function of A(H1N1) or B epidemic size using Gaussian GLMs (log link) with 1000 bootstrap resamples. In each plot, the black dashed line represents the mean regression fit, and the gray shaded band shows the 95% confidence interval, based on 1000 bootstrap resamples. The R2 and associated p-value from the mean regression fit are in the top section of each plot.
Figure 7—figure supplement 2.
Figure 7—figure supplement 2.. The effect of influenza A(H1N1) epidemic size on A(H3N2) epidemic burden during the entire study period, pre-2009 seasons, and post-2009 seasons.
Influenza A(H1N1) epidemic size negatively correlates with A(H3N2) epidemic size, peak incidence, transmissibility (maximum effective reproduction number, Rt), and epidemic intensity during (A) the entire study period (1997 – 2019), (B) pre-2009 seasons, and (C) post-2009 seasons. Point color indicates the dominant influenza A virus (IAV) subtype based on CDC influenza season summary reports (red: A(H3N2), blue: A(H1N1), purple: A(H1N1)pdm09, orange: A(H3N2)/A(H1N1)pdm09 co-dominant), and vertical and horizontal bars are 95% confidence intervals of regional estimates (pre-2009 seasons: 9 regions; post-2009 seasons: 10 regions). Seasonal mean A(H3N2) epidemic metrics were fit as a function of A(H1N1) epidemic size using Gaussian GLMs (epidemic size, peak incidence: inverse link; effective Rt: log link) or Beta GLMs (epidemic intensity: logit link) with 1000 bootstrap resamples. In each plot, the black dashed line represents the mean regression fit, and the gray shaded band shows the 95% confidence interval, based on 1000 bootstrap resamples. The R2 and associated p-value from the mean regression fit are in the top left section of each plot.
Figure 7—figure supplement 3.
Figure 7—figure supplement 3.. Wavelet analysis of influenza A(H3N2), A(H1N1), and B epidemic timing.
(A) A(H3N2) incidence precedes A(H1N1) incidence in most seasons. Although A(H1N1) incidence sometimes leads or is in phase with A(H3N2) incidence (negative or zero phase lags), the direction of seasonal phase lags is not clearly associated with A(H1N1) epidemic size. (B) A(H3N2) incidence leads B incidence (positive phase lag) during every season, irrespective of B epidemic size. Point color indicates the dominant influenza A subtype based on CDC influenza season summary reports (red: A(H3N2), blue: A(H1N1), purple: A(H1N1)pdm09, orange: A(H3N2)/A(H1N1)pdm09 co-dominant), vertical bars are 95% confidence intervals (CIs) of regional phase lag estimates, and horizontal bars are 95% CIs of regional epidemic size estimates (pre-2009 seasons: 9 regions; post-2009 seasons: 10 regions). To estimate the relative timing of influenza subtype incidences, phase angle differences were calculated as phase in A(H3N2) minus phase in A(H1N1) (or B), with a positive value indicating that A(H1N1) (or B) incidence lags A(H3N2) incidence. To calculate seasonal phase lags, we averaged pairwise phase angle differences from epidemic week 40 to epidemic week 20. Seasonal phase lags were fit as a function of A(H1N1) or B epidemic size using LMs with 1000 bootstrap resamples. In each plot, the R2 and associated p-value from the mean regression fit are in the top right section, and the black dashed line shows y=0 (the two time series are in phase).
Figure 8.
Figure 8.. Variable importance rankings from conditional inference random forest models predicting seasonal region-specific influenza A(H3N2) epidemic dynamics.
Ranking of variables in predicting regional A(H3N2) (A) epidemic size, (B) peak incidence, (C) transmissibility (maximum effective reproduction number, Rt), (D) epidemic intensity, and (E) subtype dominance. Each forest was created by generating 3000 regression trees from a repeated leave-one-season-out cross-validated sample of the data. Variables are ranked by their conditional permutation importance, with differences in prediction accuracy scaled by the total (null model) error. Black error bars are 95% confidence intervals of conditional permutation scores (N=50 permutations). Abbreviations: t – 1, one-season lag; t – 2, two-season lag; IAV, influenza A virus subtype; s.d., standard deviation; HI, hemagglutination inhibition; LBI, local branching index; distance to vaccine, epitope distance between currently circulating viruses and the recommended vaccine strain; VE, vaccine effectiveness.
Figure 8—figure supplement 1.
Figure 8—figure supplement 1.. Variable importance rankings from LASSO regression models predicting seasonal region-specific influenza A(H3N2) epidemic dynamics.
Ranking of variables in predicting regional A(H3N2) (A) epidemic size, (B) peak incidence, (C) transmissibility (maximum effective reproduction number, Rt), (D) epidemic intensity, and (E) subtype dominance. Models were tuned using a repeated leave-one-season-out cross-validated sample of the data. Variables are ranked by their coefficient estimates, with differences in prediction accuracy scaled by the total (null model) error. Abbreviations: t – 1, one-season lag; t – 2, two-season lag; IAV, influenza A virus subtype; s.d., standard deviation; HI, hemagglutination inhibition; LBI, local branching index; distance to vaccine, epitope distance between currently circulating viruses and the recommended vaccine strain; VE, vaccine effectiveness.
Figure 9.
Figure 9.. Observed versus predicted values of seasonal region-specific influenza A(H3N2) epidemic metrics from conditional inference random forest models.
(A) Epidemic size, (B) peak incidence, (C) transmissibility (maximum effective reproduction number, Rt), (D) epidemic intensity, and (E) subtype dominance. Results are facetted by HHS region and epidemic metric. Point color and size corresponds to the mean H3 epitope distance between viruses circulating in the current season t and viruses circulating two prior seasons ago (t – 2). Large, yellow points indicate seasons with high antigenic novelty, and small blue points indicate seasons with low antigenic novelty. In each facet, the Spearman’s rank correlation coefficient and associated p-value are in the top left section, and the black dashed line shows y=x.
Figure 9—figure supplement 1.
Figure 9—figure supplement 1.. Relationships between the predictive accuracy of random forest models and seasonal H3 epitope distance.
Root mean squared errors between observed and model-predicted values were averaged across regions for each season, and results are facetted according to epidemic metric. Point color corresponds to the mean H3 epitope distance between viruses circulating in the current season t and viruses circulating two prior seasons ago (t – 2), with bright yellow points indicating seasons with greater antigenic novelty. In each facet, the Spearman’s rank correlation coefficient and associated p-value are in the top left section, and the black dashed line represents the linear regression fit.
Figure 9—figure supplement 2.
Figure 9—figure supplement 2.. Relationships between the predictive accuracy of random forest models and seasonal N2 epitope distance.
Root mean squared errors between observed and model-predicted values were averaged across regions for each season, and results are facetted according to epidemic metric. Point color corresponds to the mean N2 epitope distance between viruses circulating in the current season t and viruses circulating in the prior season (t – 1), with bright yellow points indicating seasons with greater antigenic novelty. In each facet, the Spearman’s rank correlation coefficient and associated p-value are in the top left section, and the black dashed line represents the linear regression fit.
Author response image 1.
Author response image 1.. Adjustment for pre- and post-2009 pandemic only.
Author response image 2.
Author response image 2.. Adjustment for pre- and post-2009 pandemic only.

Update of

Similar articles

Cited by

References

    1. Ali ST, Lau YC, Shan S, Ryu S, Du Z, Wang L, Xu XK, Chen D, Xiong J, Tae J, Tsang TK, Wu P, Lau EHY, Cowling BJ. Prediction of upcoming global infection burden of influenza seasons after relaxation of public health and social measures during the COVID-19 pandemic: a modelling study. The Lancet. Global Health. 2022;10:e1612–e1622. doi: 10.1016/S2214-109X(22)00358-8. - DOI - PMC - PubMed
    1. Altman MO, Bennink JR, Yewdell JW, Herrin BR. Lamprey VLRB response to influenza virus supports universal rules of immunogenicity and antigenicity. eLife. 2015;4:e07467. doi: 10.7554/eLife.07467. - DOI - PMC - PubMed
    1. Altmann A, Toloşi L, Sander O, Lengauer T. Permutation importance: a corrected feature importance measure. Bioinformatics. 2010;26:1340–1347. doi: 10.1093/bioinformatics/btq134. - DOI - PubMed
    1. Axelsen JB, Yaari R, Grenfell BT, Stone L. Multiannual forecasting of seasonal influenza dynamics reveals climatic and evolutionary drivers. PNAS. 2014;111:9538–9542. doi: 10.1073/pnas.1321656111. - DOI - PMC - PubMed
    1. Baker RE, Park SW, Yang W, Vecchi GA, Metcalf CJE, Grenfell BT. The impact of COVID-19 nonpharmaceutical interventions on the future dynamics of endemic infections. PNAS. 2020;117:30547–30553. doi: 10.1073/pnas.2013182117. - DOI - PMC - PubMed

MeSH terms

Substances