

Benchmarking transcriptome deconvolution methods for estimating tissue- and cell-type-specific extracellular vesicle abundances
- PMID: 39320021
- PMCID: PMC11423344
- DOI: 10.1002/jev2.12511
Benchmarking transcriptome deconvolution methods for estimating tissue- and cell-type-specific extracellular vesicle abundances
Abstract
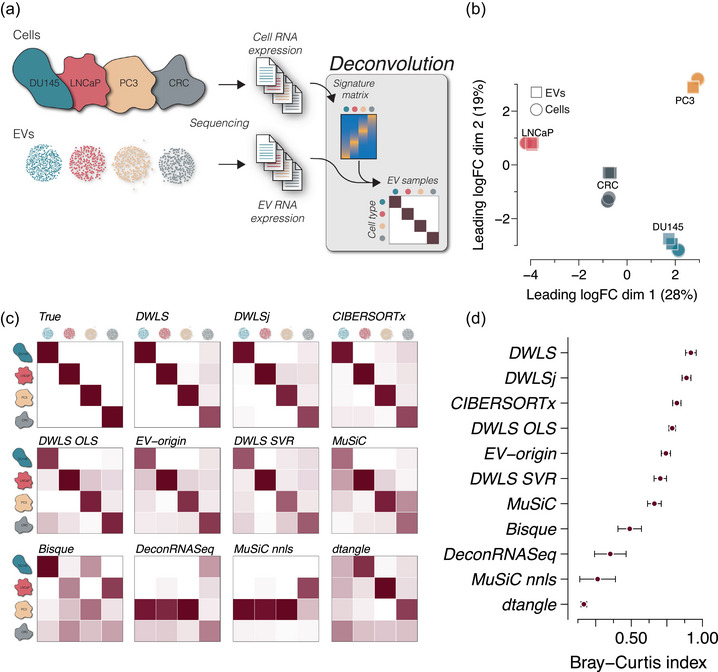
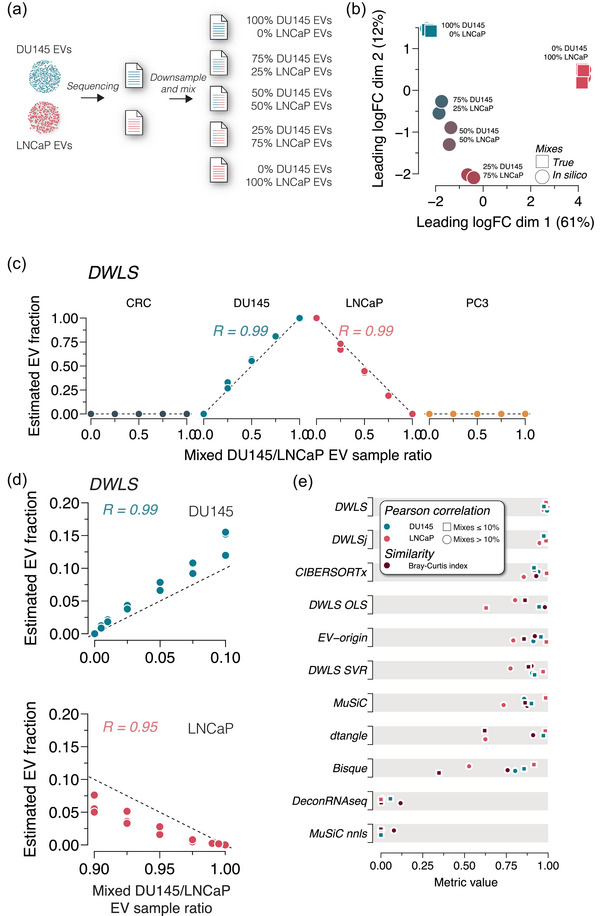
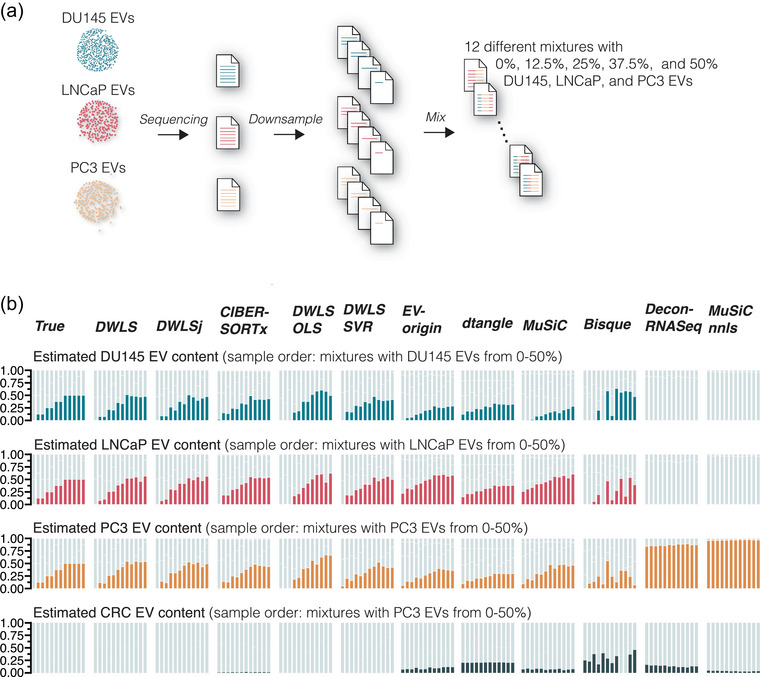
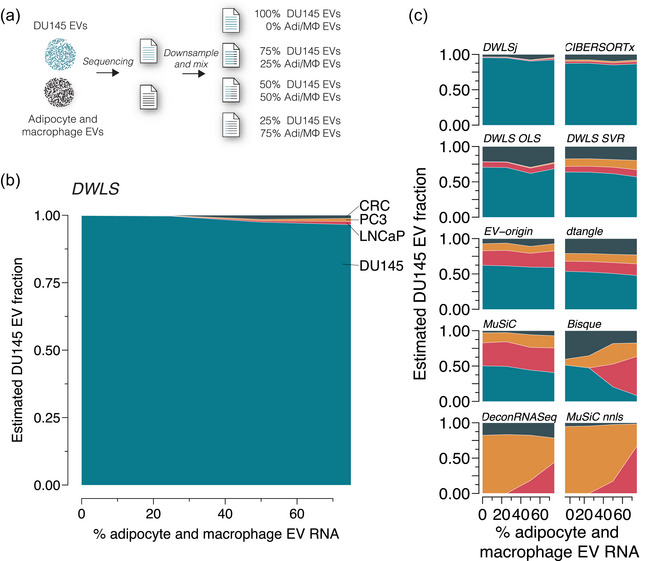
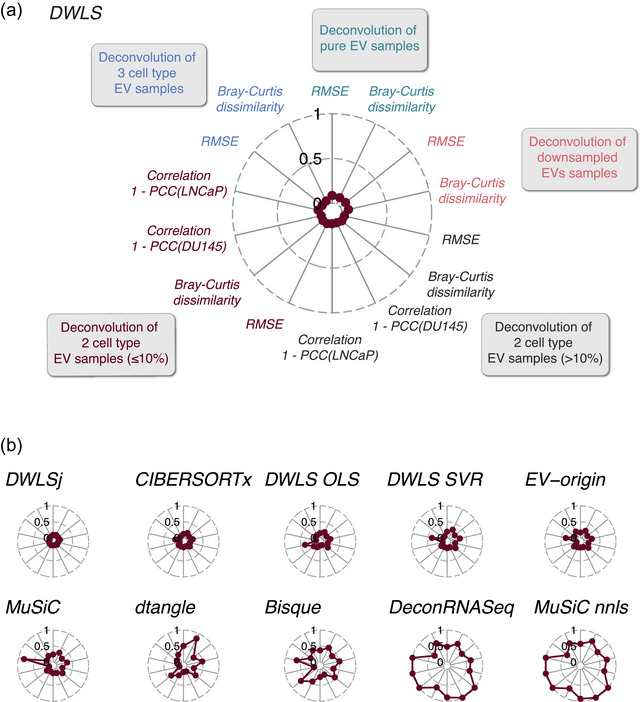
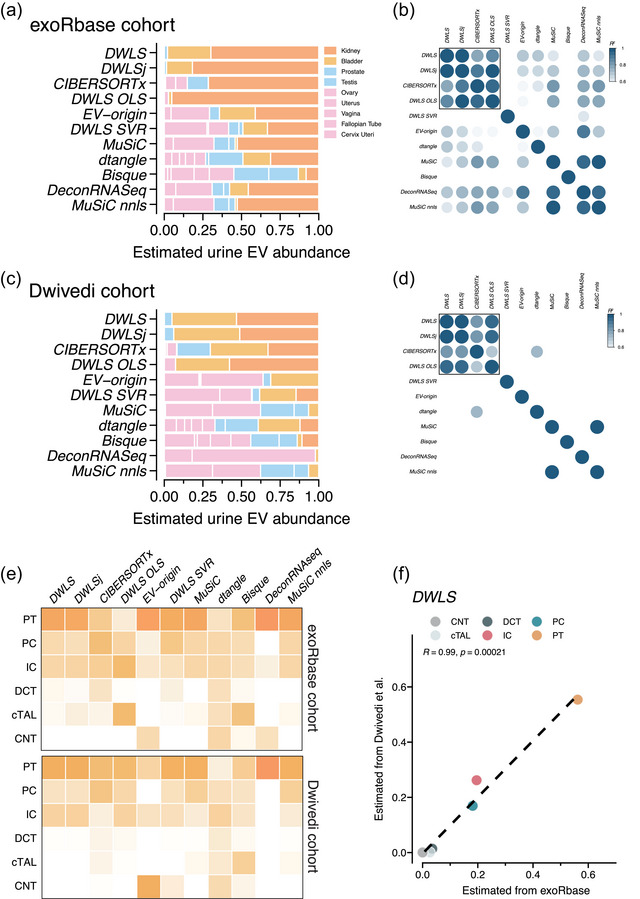
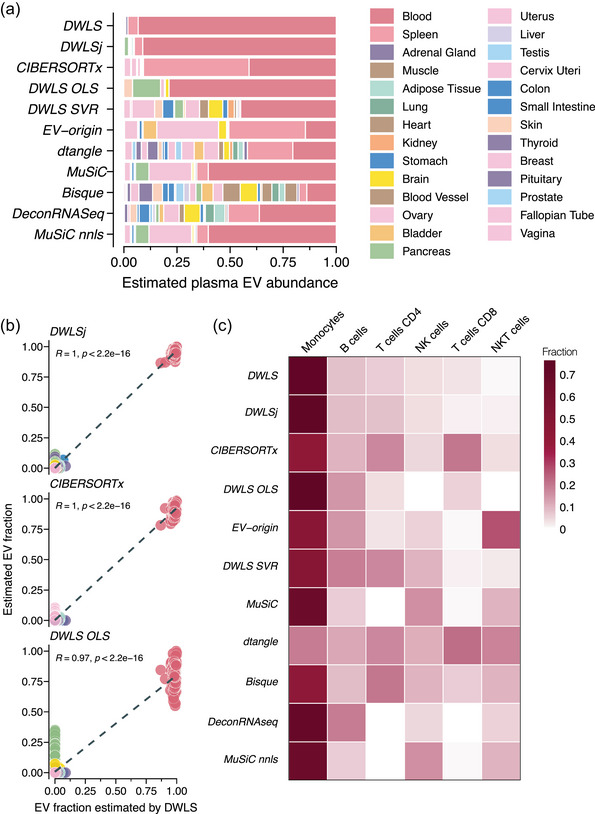
Extracellular vesicles (EVs) contain cell-derived lipids, proteins and RNAs; however, determining the tissue- and cell-type-specific EV abundances in body fluids remains a significant hurdle for our understanding of EV biology. While tissue- and cell-type-specific EV abundances can be estimated by matching the EV's transcriptome to a tissue's/cell type's expression signature using deconvolutional methods, a comparative assessment of deconvolution methods' performance on EV transcriptome data is currently lacking. We benchmarked 11 deconvolution methods using data from four cell lines and their EVs, in silico mixtures, 118 human plasma and 88 urine EVs. We identified deconvolution methods that estimated cell type-specific abundances of pure and in silico mixed cell line-derived EV samples with high accuracy. Using data from two urine EV cohorts with different EV isolation procedures, four deconvolution methods produced highly similar results. The three methods were also concordant in their tissue- and cell-type-specific plasma EV abundance estimates. We identified driving factors for deconvolution accuracy and highlighted the importance of implementing biological knowledge in creating the tissue/cell type signature. Overall, our analyses demonstrate that the deconvolution algorithms DWLS and CIBERSORTx produce highly similar and accurate estimates of tissue- and cell-type-specific EV abundances in biological fluids.
Keywords: cell‐conditioned medium; exosome; microvesicle; plasma; single‐cell RNA sequencing; transcriptome; urine.
© 2024 The Author(s). Journal of Extracellular Vesicles published by Wiley Periodicals LLC on behalf of International Society for Extracellular Vesicles.
Conflict of interest statement
The authors declare no conflicts of interest.
Figures
Similar articles
-
Extracellular vesicles carry transcriptional 'dark matter' revealing tissue-specific information.J Extracell Vesicles. 2024 Aug;13(8):e12481. doi: 10.1002/jev2.12481. J Extracell Vesicles. 2024. PMID: 39148266 Free PMC article.
-
Global transcriptomic changes occur in uterine fluid-derived extracellular vesicles during the endometrial window for embryo implantation.Hum Reprod. 2021 Jul 19;36(8):2249-2274. doi: 10.1093/humrep/deab123. Hum Reprod. 2021. PMID: 34190319 Free PMC article.
-
Defining candidate mRNA and protein EV biomarkers to discriminate ccRCC and pRCC from non-malignant renal cells in vitro.Med Oncol. 2021 Jul 31;38(9):105. doi: 10.1007/s12032-021-01554-2. Med Oncol. 2021. PMID: 34331598 Free PMC article.
-
Technological Approaches in the Analysis of Extracellular Vesicle Nucleotide Sequences.Front Bioeng Biotechnol. 2021 Dec 23;9:787551. doi: 10.3389/fbioe.2021.787551. eCollection 2021. Front Bioeng Biotechnol. 2021. PMID: 35004647 Free PMC article. Review.
-
Transcriptome of Extracellular Vesicles: State-of-the-Art.Front Immunol. 2019 Feb 28;10:202. doi: 10.3389/fimmu.2019.00202. eCollection 2019. Front Immunol. 2019. PMID: 30873152 Free PMC article. Review.
Cited by
-
Extracellular Vesicles as Emerging Therapeutic Strategies in Spinal Cord Injury: Ready to Go.Biomedicines. 2025 May 21;13(5):1262. doi: 10.3390/biomedicines13051262. Biomedicines. 2025. PMID: 40427089 Free PMC article. Review.
-
Roadblocks of Urinary EV Biomarkers: Moving Toward the Clinic.J Extracell Vesicles. 2025 Jul;14(7):e70120. doi: 10.1002/jev2.70120. J Extracell Vesicles. 2025. PMID: 40673839 Free PMC article. Review.
-
Detection and Isolation of Tissue-Specific Extracellular Vesicles From the Blood.J Extracell Biol. 2025 Jun 22;4(6):e70059. doi: 10.1002/jex2.70059. eCollection 2025 Jun. J Extracell Biol. 2025. PMID: 40552103 Free PMC article. Review.
References
-
- Almeida, A. , Gabriel, M. , Firlej, V. , Martin‐Jaular, L. , Lejars, M. , Cipolla, R. , Petit, F. , Vogt, N. , San‐Roman, M. , Dingli, F. , Loew, D. , Destouches, D. , Vacherot, F. , de la Taille, A. , Théry, C. , & Morillon, A. (2022). Urinary extracellular vesicles contain mature transcriptome enriched in circular and long noncoding RNAs with functional significance in prostate cancer. Journal of Extracellular Vesicles, 11(5), e12210. - PMC - PubMed
-
- Beckler, M. D. , Higginbotham, J. N. , Franklin, J. L. , Ham, A. J. , Halvey, P. J. , Imasuen, I. E. , Whitwell, C. , Li, M. , Liebler, D. C. , & Coffey, R. J. (2013). Proteomic analysis of exosomes from mutant KRAS colon cancer cells identifies intercellular transfer of mutant KRAS. Molecular & Cellular Proteomics: MCP, 12(2), 343–355. - PMC - PubMed
-
- Blijdorp, C. J. , Hartjes, T. A. , Wei, K. Y. , van Heugten, M. H. , Bovée, D. M. , Budde, R. P. J. , van de Wetering, J. , Hoenderop, J. G. J. , van Royen, M. E. , Zietse, R. , Severs, D. , & Hoorn, E. J. (2022). Nephron mass determines the excretion rate of urinary extracellular vesicles. Journal of Extracellular Vesicles, 11(1), e12181. - PMC - PubMed
-
- Dong, X. , Du, M. R. M. , Gouil, Q. , Tian, L. , Jabbari, J. S. , Bowden, R. , Baldoni, P. L. , Chen, Y. , Smyth, G. K. , Amarasinghe, S. L. , Law, C. W. , & Ritchie, M. E. (2023). Benchmarking long‐read RNA‐sequencing analysis tools using in silico mixtures. Nature Methods, 20(11), 1810–1821. - PubMed
MeSH terms
Grants and funding
LinkOut - more resources
Full Text Sources
