. 2024 Oct 29;9(10):e0062924.
doi: 10.1128/msphere.00629-24. Epub 2024 Sep 25.

Sialic acid and PirB are not required for targeting of neural circuits by neurotropic mammalian orthoreovirus

Affiliations

Sialic acid and PirB are not required for targeting of neural circuits by neurotropic mammalian orthoreovirus

Kira A Griswold et al. mSphere. .

Abstract

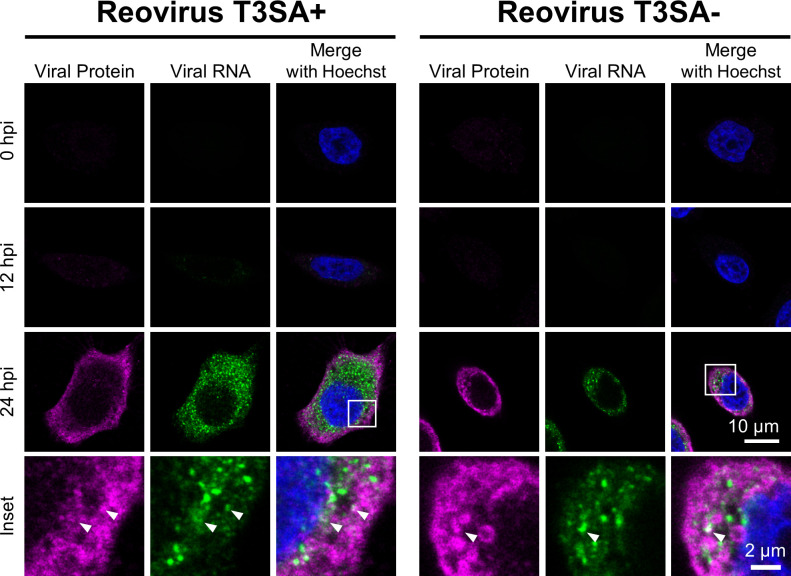
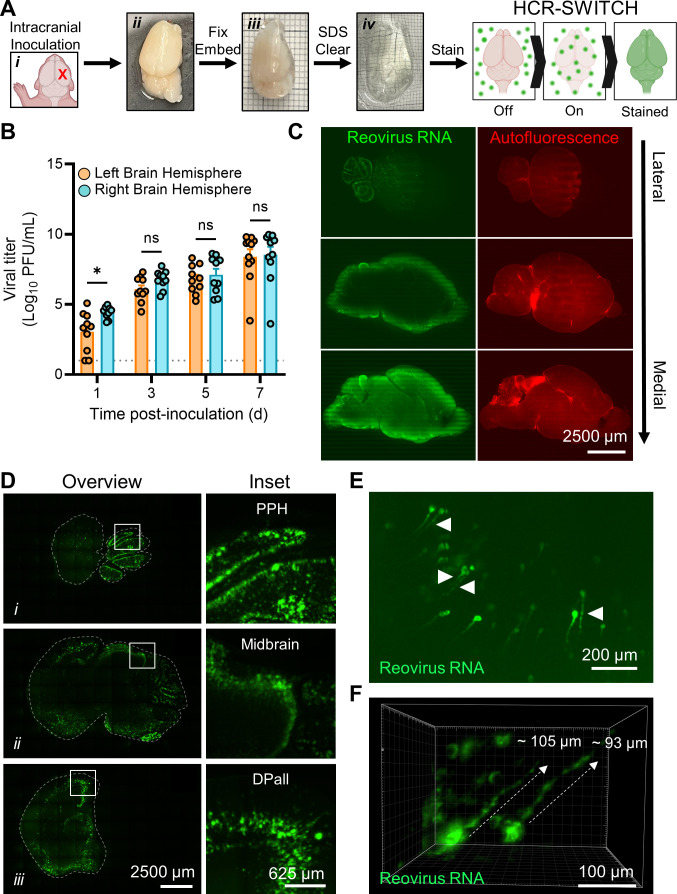
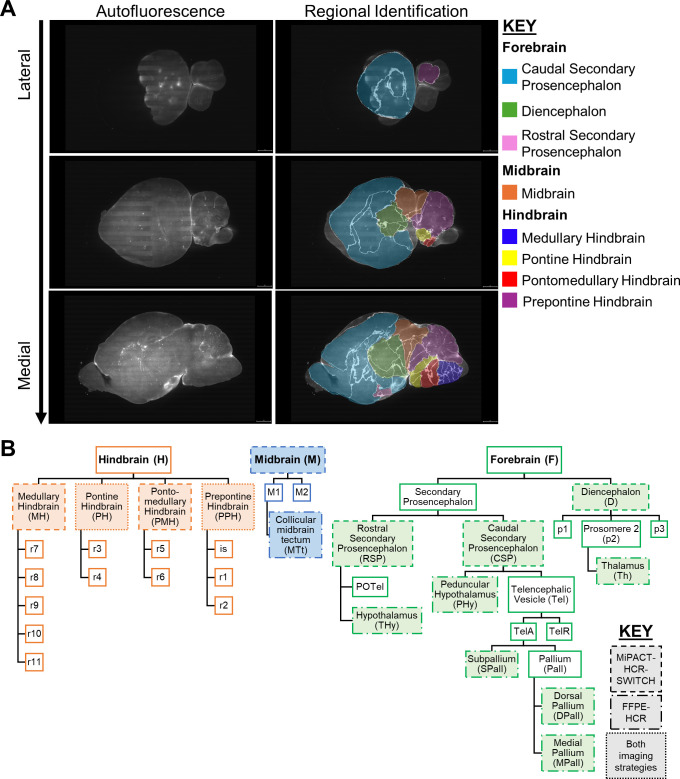
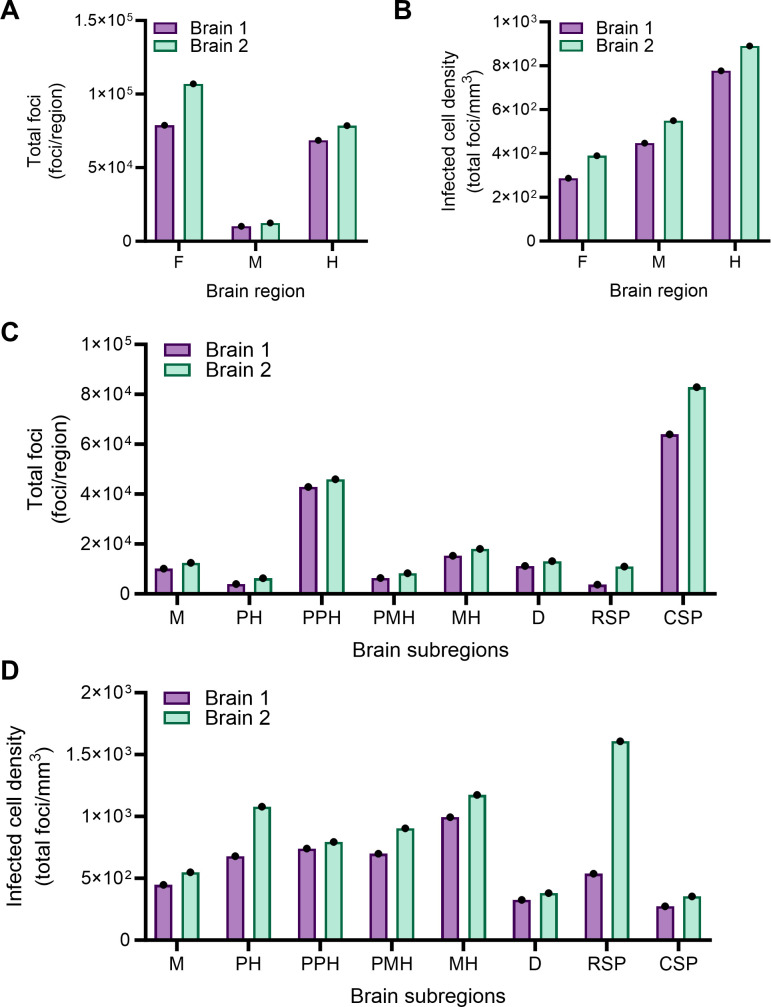
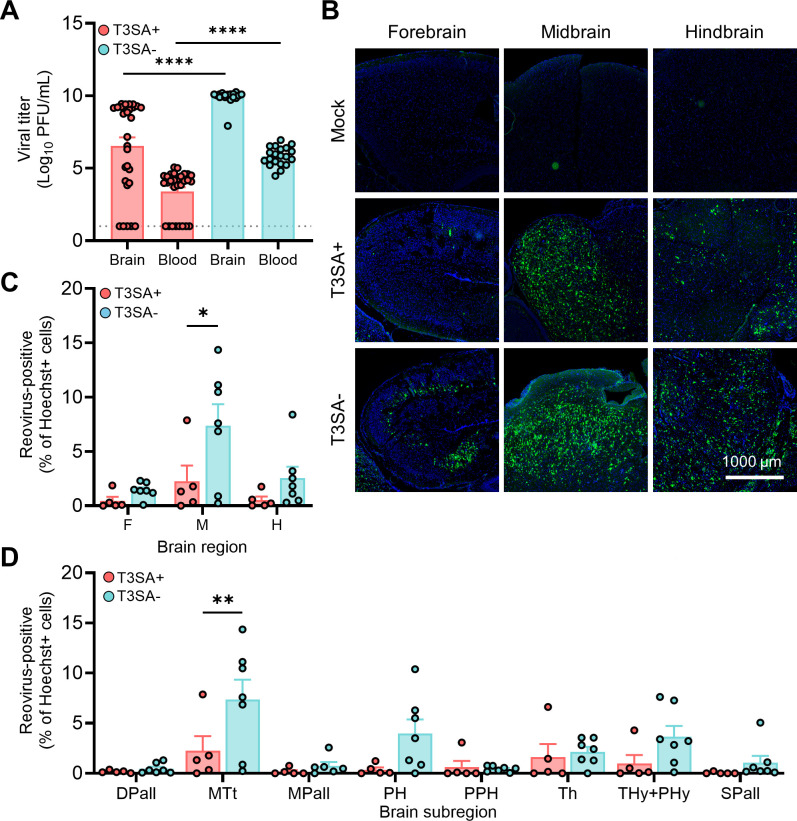
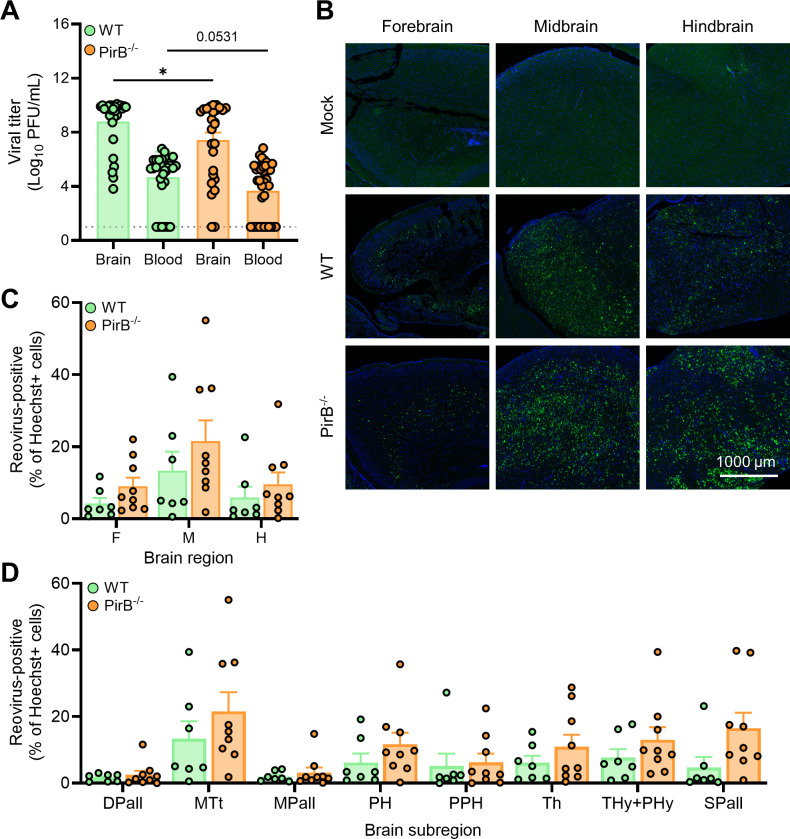
Serotype 3 (T3) strains of mammalian orthoreovirus (reovirus) spread to the central nervous system to infect the brain and cause lethal encephalitis in newborn mice. Although reovirus targets several regions in the brain, susceptibility to infection is not uniformly distributed. The neuronal subtypes and anatomic sites targeted throughout the brain are not precisely known. Reovirus binds several attachment factors and entry receptors, including sialic acid (SA)-containing glycans and paired immunoglobulin-like receptor B (PirB). While these receptors are not required for infection of some types of neurons, reovirus engagement of these receptors can influence neuronal infection in certain contexts. To identify patterns of T3 neurotropism, we used microbial identification after passive tissue clearance and hybridization chain reaction to stain reovirus-infected cells throughout intact, optically transparent brains of newborn mice. Three-dimensional reconstructions revealed in detail the sites targeted by reovirus throughout the brain volume, including dense infection of the midbrain and hindbrain. Using reovirus mutants incapable of binding SA and mice lacking PirB expression, we found that neither SA nor PirB is required for the infection of various brain regions. However, SA may confer minor differences in infection that vary by region. Collectively, these studies indicate that many regions in the brain of newborn mice are susceptible to reovirus and that patterns of reovirus infection are not dependent on reovirus receptors SA and PirB.IMPORTANCENeurotropic viruses invade the central nervous system (CNS) and target various cell types to cause disease manifestations, such as meningitis, myelitis, or encephalitis. Infections of the CNS are often difficult to treat and can lead to lasting sequelae or death. Mammalian orthoreovirus (reovirus) causes age-dependent lethal encephalitis in many young mammals. Reovirus infects neurons in several different regions of the brain. However, the complete pattern of CNS infection is not understood. We found that reovirus targets almost all regions of the brain and that patterns of tropism are not dependent on receptors sialic acid and paired immunoglobulin-like receptor B. These studies confirm that two known reovirus receptors do not completely explain the cell types infected in brain tissue and establish strategies that can be used to understand complete patterns of viral tropism in an intact brain.

Keywords: CLARITY; MiPACT-HCR; PirB; neuropathogenesis; neurotropic viruses; reovirus; sialic acid.


Conflict of interest statement

The authors declare no conflict of interest.

Figures

Fig 1
Fig 1
HCR assay detects reovirus RNA at late stages of infection in cultured cells. HeLa cells were adsorbed with 100 PFU/cell of reovirus strains T3SA+ or T3SA− for 1 h. At the times post-adsorption shown, cells were fixed and stained for reovirus S3 RNA (green) by HCR and viral protein (magenta) by indirect immunofluorescence. Cells were counterstained with Hoechst dye (blue) and imaged using confocal microscopy. Representative images are shown. Arrowheads indicate sites of colocalization. Scale bar, 10 µm (single cell) or 2 µm (inset).
Fig 2
Fig 2
Viral replication sites are detected throughout the brain in cleared, reovirus-infected brain hemispheres. (A–F) Two-day-old WT mice were inoculated IC with phosphate-buffered saline (mock) or 1,000 PFU of T3SA+. Mice were euthanized at 7 days post-inoculation, and brains were resected and hemisected along the latitudinal fissure. (A) Schematic of the approach to stain whole, cleared tissues using MiPACT, SWITCH, and HCR (MiPACT-SWITCH-HCR). The inoculation site is indicated with an X (i). Right-brain hemispheres were fixed with paraformaldehyde (ii), embedded in an acrylamide-based gel (iii), cleared using SDS (iv), and processed for the detection of viral RNA using the SWITCH-HCR approach. Minor gridlines in (iii) and (iv), 1 mm. Tissue in (iv) is partially immersed in refractive index-matching solution (RIMS). (B) Titers of the virus in homogenized hemispheres (right or left) were determined by plaque assay. Each symbol represents the viral titer from an individual animal. N = 10-11. Error bars indicate SEM. Values that differ significantly from the left-brain hemisphere by the mixed-effects model are indicated (*P < 0.05). ns, not significant. Dotted line indicates limit of detection. (C) Cleared, stained, and RIMS-submerged brain tissue was imaged in 3D using ribbon-scanning confocal microscopy. Data were processed using Imaris software (Oxford Instruments). Representative sagittal optical planes from a 3D-imaged brain data set depicting autofluorescence (right images, red) as a proxy for effective brain clearance or viral RNA signal (left images, green). Optical planes proceed from lateral (top) to medial (bottom) regions of the brain. Scale bars, 2,500 µm. (D) Representative sagittal optical planes from the 3D data set in panel (C) demonstrating reovirus-infected cells in different brain regions (i–iii). Left, brain (outlined by dashed line); right, enlarged inset boxed from the left image. Scale bars, 2,500 (whole-brain images) or 625 µm (insets). PPH, prepontine hindbrain; DPall, dorsal pallium. (E and F) Representative images from the 3D data set in panel (C) demonstrating reovirus-infected neurons in the brain. (E) Sagittal optical plane demonstrating reovirus RNA staining in viral factory-like patterns (arrowheads, globular structures). Scale bar, 200 µm. (F) Max projection reovirus RNA staining within axon-like extensions (dashed lines indicate approximate length). Scale bar, 100 µm.
Fig 3
Fig 3
Schematics detailing developing mouse brain atlas overlay and regional segmentation of cleared brains. (A and B) The 3D-reconstructed Allen Developing Mouse Brain Reference Atlas (P14) (31–33) was aligned and overlaid with reovirus-infected brain data sets using the brainreg Python package. Allen Developing Mouse Brain Reference Atlas, https://developingmouse.brain-map.org. (A) Representative sagittal optical plane images depicting autofluorescence from brain tissue (left column) alone or overlaid with the fitted model from the 3D-reconstructed Allen Developing Mouse Brain Atlas—P14 (right column) (31–33). Brain subregions are colored according to identity; see key for details. (B) Schematic describing relationships between brain regions and subregions used for imaging studies; see key for details.
Fig 4
Fig 4
Alignment of two reovirus-infected 3D brain data sets to a P14 mouse brain atlas indicates that most regions of the brain are susceptible to infection. (A–D) Two-day-old WT mice were inoculated IC with phosphate-buffered saline (mock) or 1,000 PFU of reovirus strain T3SA+. Mice were euthanized at 7 days post-inoculation, and brains were resected and processed by MiPACT-HCR as in Fig. 2. Brain 1 was imaged using ribbon-scanning confocal microscopy (purple bars), and brain 2 was imaged using MesoSPIM (green bars). Mock-inoculated samples stained for viral RNA showed no background staining. Data were processed using Imaris software (Oxford Instruments). The 3D-reconstructed Allen Developing Mouse Brain Atlas–P14 (31–33) was aligned and overlaid with reovirus-infected brain data sets using the brainreg Python package. Virus-infected cell bodies within subregions of the 3D data set were enumerated using the deepBlink tool modified on U-Net architecture followed by the DBSCAN clustering method. Data are presented as total infection foci (A and C) for different anatomical regions or infectivity density (total foci count per region volume based on alignment) (B and D) for different brain regions. Each bar indicates data from a single brain. F, forebrain; M, midbrain; H, hindbrain; PH, pontine hindbrain; PPH, prepontine hindbrain; PMH, pontomedullary hindbrain; MH, medullary hindbrain; D, diencephalon; RSP, rostral secondary prosencephalon; and CSP, caudal secondary prosencephalon.
Fig 5
Fig 5
Impaired reovirus binding to sialic acid does not limit infection of sites in the brain. (A–D) Two-day-old WT mice were inoculated IC with phosphate-buffered saline (mock) or 1,000 PFU of reovirus strain T3SA+ or T3SA−. Mice were euthanized at 7 days post-inoculation, and brain tissue and whole blood were collected. (A) Titers of virus in homogenized left-brain hemispheres and blood were determined by plaque assay. Each symbol represents the viral titer from an individual animal. Brain, N = 29/29 (T3SA+/T3SA−); blood, N = 19/20 (T3SA+/T3SA−). Error bars indicate SEM. Values that differ significantly from T3SA+ by unpaired t test are indicated (****P < 0.0001). Dotted line indicates limit of detection. (B–D) Right-brain hemispheres (with contralateral hemisphere viral loads between 3.4e8 and 7.3e9) were fixed with formalin, embedded in paraffin, and sectioned sagittally. Tissue sections were probed for reovirus RNA by HCR, counterstained with Hoechst dye, and imaged using a Lionheart FX automated imager. (B) Representative images are shown for the indicated brain regions. Reovirus RNA is depicted in green; nuclei are depicted in blue. Scale bar, 1,000 µm. (C and D) Reovirus infection in established regions of interest. Infection foci (HCR-positive) from each region (C) or subregion (D) of mock-infected and reovirus-infected sections were enumerated using the Spot Detector tool within Icy software. Data are presented as the percentage of infected cells, wherein a reovirus-positive cell was determined by signal intensity greater than background defined using a mock-infected brain. N = 5/7 (T3SA+/T3SA−). Error bars indicate SEM. Values that differ significantly from T3SA+ by Sidak’s multiple comparisons test are indicated (*P < 0.05 and **P < 0.005). DPall, dorsal pallium; MTt, collicular midbrain tectum; MPall, medial pallium; PH, pontine hindbrain; PPH, prepontine hindbrain; Th, thalamus; Thy+PHy, hypothalamus; and SPall, subpallium.
Fig 6
Fig 6
PirB expression does not dictate reovirus infection patterns in the brain. (A–D) Two-to-three-day-old WT or PirB-/- mice were inoculated IC with phosphate-buffered saline (mock) or 200 PFU of reovirus strain T3SA−. Mice were euthanized at 7–8 days post-inoculation, and brain tissue and whole blood were collected. (A) Titers of the virus in the homogenized left-brain hemisphere and blood were determined by plaque assay. Each symbol represents the viral titer from an individual animal. Brain, N = 28/27 (WT/PirB-/-); blood, N = 31/35 (WT/PirB-/-). Error bars indicate SEM. Values that differ significantly from WT by unpaired t test are indicated (*P < 0.05). Dotted line indicates limit of detection. (B–D) Right-brain hemispheres (with contralateral hemisphere viral load between 4.17e8 and 1.4e10) were fixed in formalin, embedded in paraffin, and sectioned sagittally. Tissue sections were probed for reovirus RNA by HCR, counterstained with Hoechst dye, and imaged using a Lionheart FX automated imager. (C) Representative images are shown. Reovirus RNA is depicted in green; nuclei are depicted in blue. Scale bar, 1,000 µm. (C and D) Reovirus infection in established ROIs. Infection foci (HCR-positive) from each region (C) or subregion (D) of mock-infected and reovirus-infected mouse sections were enumerated using the Spot Detector tool within Icy software. Data are presented as the percentage of infected cells, wherein a reovirus-positive cell was determined by signal intensity greater than background defined using a mock-infected brain. N = 7/9 (WT/PirB-/-). Error bars indicate SEM. Values that differ significantly from WT by Sidak’s multiple comparisons test are indicated. DPall, dorsal pallium; MTt, collicular midbrain tectum; MPall, medial pallium; PH, pontine hindbrain; PPH, prepontine hindbrain; Th, thalamus; Thy+PHy, hypothalamus; and SPall, subpallium.

Similar articles

References

    1. Koyuncu OO, Hogue IB, Enquist LW. 2013. Virus infections in the nervous system. Cell Host Microbe 13:379–393. doi:10.1016/j.chom.2013.03.010 - DOI - PMC - PubMed
    1. Lim SM, Koraka P, Osterhaus ADME, Martina BEE. 2011. West Nile virus: immunity and pathogenesis. Viruses 3:811–828. doi:10.3390/v3060811 - DOI - PMC - PubMed
    1. Ugolini G. 2010. Advances in viral transneuronal tracing. J Neurosci Methods 194:2–20. doi:10.1016/j.jneumeth.2009.12.001 - DOI - PubMed
    1. Dermody TS, Parker JS, Sherry B. 2023. Orthoreoviruses, p 318–361. In Howley PM, Knip DM (ed), Fields virology, 7th ed. Wolters Kluwer, Philadelphia.
    1. Masters C, Alpers M, Kakulas B. 1977. Pathogenesis of reovirus type 1 hydrocephalus in mice. Significance of aqueductal changes. Arch Neurol 34:18. doi:10.1001/archneur.1977.00500130038008 - DOI - PubMed

MeSH terms

LinkOut - more resources