. 2024 Nov 1;213(9):1349-1357.
doi: 10.4049/jimmunol.2400228.

The G Protein-Coupled Receptor GPR56 Is an Inhibitory Checkpoint for NK Cell Migration

Affiliations

The G Protein-Coupled Receptor GPR56 Is an Inhibitory Checkpoint for NK Cell Migration

Daniel Palacios et al. J Immunol. .

Abstract

G protein-coupled receptors (GPCRs) represent the largest family of surface receptors and are responsible for key physiological functions, including cell growth, neurotransmission, hormone release, and cell migration. The GPCR 56 (GPR56), encoded by ADGRG1, is an adhesion GPCR found on diverse cell types, including neural progenitor cells, melanoma cells, and lymphocytes, such as effector memory T cells, γδ T cells, and NK cells. Using RNA-sequencing and high-resolution flow cytometry, we found that GPR56 mRNA and protein expression increased with NK cell differentiation, reaching its peak in adaptive NK cells. Small interfering RNA silencing of GPR56 led to increased spontaneous and chemokine-induced migration, suggesting that GPR56 functions as an upstream checkpoint for migration of highly differentiated NK cells. Increased NK cell migration could also be induced by agonistic stimulation of GPR56 leading to rapid internalization and deactivation of the receptor. Mechanistically, GPR56 ligation and downregulation were associated with transcriptional coactivator with PDZ-binding motif translocation to the nucleus and increased actin polymerization. Together, these data provide insights into the role of GPR56 in the migratory behavior of human NK cell subsets and may open possibilities to improve NK cell infiltration into cancer tissues by releasing a migratory checkpoint.


Conflict of interest statement

K.-J.M. is a consultant for and has received research support for unrelated studies from Fate Therapeutics, has received research support from Oncopeptides, and is a consultant at Vycellix. All relationships have been approved by Oslo University Hospital, University of Oslo, and Karolinska Institute. The other authors have no financial conflicts of interest.

Figures
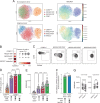
FIGURE 1.
FIGURE 1.
GPR56 (ADGRG1) mRNA and protein expression in NK cell subsets. (A) scRNAseq analysis of sorted PBNK cell subsets from two healthy blood donors, one with and one without adaptive NK cell population. Analysis performed by Scanpy (17). (B) Dot plot summarizing scRNAseq analysis of ADGRG1 expression in different PBNK cell subsets. (C) Flow density plots showing GPR56 protein expression on gated NK subsets from one representative experiment. The gating strategy of NK subsets is visualized in Supplemental Fig. 1A. (D) Fraction of GPR56+ cells in the different NK subsets, and (E) GPR56 surface protein expression, analyzed by flow cytometry, and measured as % positive cells and mean fluorescence intensity (MFI) (n = 42). Statistics were performed with repeated measures one-way ANOVA. (F) GPR56 surface expression analyzed by mass cytometry and measured in MFI from conventional donors (n = 13) and adaptive donors (n = 7). The gating strategy of NK subsets is visualized in Supplemental Fig. 1B. Statistics were performed with Welch’s t test. (G) GPR56 surface expression measured in MFI from educated and uneducated donors in single KIR-expressing NK cells from C1C1 donors (n = 18) and C2C2 donors (n = 11). Statistics were performed with paired t test. *p ≤ 0.05, **p ≤ 0.01, ***p ≤ 0.001, ****p ≤ 0.0001.
FIGURE 2.
FIGURE 2.
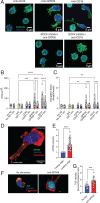
GPR56 modulates the migratory capacity of NK cells. (A) Cell-surface GPR56 expression measured in mean fluorescence intensity (MFI) in nonmigrated and migrated primary NK cells in a transwell setting (n = 8). Statistics were performed by a paired t test. (B) GPR56 knockdown efficiency measured in MFI and percent comparing a nontargeting siRNA control and GPR56 targeting siRNA treatment (n = 7). Statistics were performed using paired t test. (C) Spontaneous, IL-8 (10 ng/ml), and CX3CL1 (10 ng/ml) primary NK cell migration in a transwell setting in bulk NK cells, CD56bright NK cells, and NKG2AKIR+CD57+ NK cells comparing NK cells with a nontargeting siRNA treatment and GPR56 knockdown NK cells by siRNA (n = 6). Statistics were performed by a paired t test. (D) Spontaneous, IL-8 (10 ng/ml), and CX3CL1 (10 ng/ml) primary NK cell migration in a transwell setting in bulk NK cells, CD56bright NK cells, and NKG2AKIR+CD57+ NK cells comparing unstimulated NK cells and NK cells stimulated with an anti-GPR56 Ab (n = 7). Statistics were performed using a Wilcoxon test. (E) Confocal imaging of GPR56 in freshly isolated PBNKs after Ab stimulation for 1 h. Green: WGA tagged with Alexa Fluor 488. Blue: Hoechst 33342. Red: GPR56 stained with Alexa Fluor 568 secondary Abs. One representative image for 0 and 1 h from a single experiment is shown. (F) Counted GPR56 clusters detected in the cell surface (membrane) at 0 h versus intracellular and 1 h after stimulation with anti-GPR56 Ab (n = 3 donors/110 NK cells). Statistics were performed by a mixed-effects analysis. (G) Intracellular-to-surface ratio of GPR56 clusters (n = 3 donors/110 NK cells). Statistics were performed using a paired t test. (H) Surface expression of GPR56 was detected by flow cytometry after Ab stimulation for 0 or 1 h (n = 7). Statistics were performed by a paired t test. *p ≤ 0.05, **p ≤ 0.01, ***p ≤ 0.001.
FIGURE 3.
FIGURE 3.
Transcriptional regulation of GPR56 expression. (A) Surface expression of GPR56 measured by flow cytometry upon IL-15 stimulation (10 ng/ml) at different time points (n = 3 donors). (B) Dot plot showing transcriptional levels of ADGR1 in the indicated subset after stimulation with IL-15 for 5 d. (C) GPR56 surface expression upon target cell stimulation (K562) and PMA (2.5 µg/ml)/ionomycin (0.5 µg/ml) activation (n = 6). Statistics were performed using repeated measures one-way ANOVA. (D) GPR56 surface expression measured as MFI upon stimulation with DNAM1/2B4 and CD16 using a P815 cell line in a reverse Ab-dependent cytotoxicity assay. (E) UMAP representing the CD56bright and CD56dim compartment and the clusters induced by target cell stimulation with the dot plot showing the relative ADGRG1 transcripts in the indicated clusters. Statistics were performed using repeated measures one-way ANOVA (n = 4). nsp > 0.05, **p ≤ 0.01, ***p ≤ 0.001, ****p ≤ 0.0001.
FIGURE 4.
FIGURE 4.
GPR56 is involved in Rho-dependent actin remodeling and translocation of TAZ. (A) Confocal microscopy of freshly isolated NK cells stimulated with anti-GPR56 for 1 h in the presence or absence of 100 µM/ml ROCK inhibitor. Cells were stimulated with anti-CD45 and anti-CD16 as negative and positive control, respectively. Actin filaments were stained by Phalloidin AF 488 (green), and cell nuclei were stained with Hoechst 33342 (blue). One representative image for each setting from a single experiment is shown. (B) Actin remodeling is visualized by the flattening over an area (measured by µm2). Average cell area from all cells present in the view field; total 10–11 view fields (n = 3 donors). Statistics were performed using Kruskal-Wallis multiple comparisons test. (C) The elongation factor (cell length/breadth) of the cells described in (B). Statistics were performed using Kruskal-Wallis multiple comparisons test. (D) Representative image of an NK cell with a clear leading edge and trailing edge showing GPR56 in green and F-actin in red. (E) GPR56 intensity ratio comparing GPR56 clusters in the trailing edge and leading edge (n = 3 donors). Total cells analyzed = 57. Statistics were performed using a paired t test. (F) Stimulation with anti-GPR56 for 1 h induces nuclear translocation of TAZ. Actin filaments were visualized with Phalloidin AF555 and nuclei with Hoechst 33342. Translocation was measured as the ratio of nuclear/cytoplasmic TAZ intensity. (G) TAZ expression intensity within the nucleus/cytoplasmatic comparing unstimulated versus anti-GPR56 treatment for 1 h (n = 3 donors). Each dot represents TAZ intensity per view field. Statistics were performed using unpaired t test. **p ≤ 0.01, ***p ≤ 0.001, ****p ≤ 0.0001.

References

    1. Laskowski, T. J., Biederstädt A., Rezvani K.. 2022. Natural killer cells in antitumour adoptive cell immunotherapy. Nat. Rev. Cancer 22: 557–575. - PMC - PubMed
    1. Ran, G. H., Lin Y. Q., Tian L., Zhang T., Yan D. M., Yu J. H., Deng Y. C.. 2022. Natural killer cell homing and trafficking in tissues and tumors: from biology to application. Signal Transduct. Target. Ther. 7: 205. - PMC - PubMed
    1. Domagala, J., Lachota M., Klopotowska M., Graczyk-Jarzynka A., Domagala A., Zhylko A., Soroczynska K., Winiarska M.. 2020. The tumor microenvironment: a metabolic obstacle to NK cells’ activity. Cancers (Basel) 12: 3542. - PMC - PubMed
    1. Walzer, T., Vivier E.. 2011. G-protein-coupled receptors in control of natural killer cell migration. Trends Immunol. 32: 486–492. - PubMed
    1. Ganesh, R. A., Venkataraman K., Sirdeshmukh R.. 2020. GPR56: an adhesion GPCR involved in brain development, neurological disorders and cancer. Brain Res. 1747: 147055. - PubMed

MeSH terms

Substances