. 2024 Dec 1;73(12):2045-2054.
doi: 10.2337/db24-0355.

Optimized Proteomic Analysis of Insulin Granules From MIN6 Cells Identifies Scamp3, a Novel Regulator of Insulin Secretion and Content

Affiliations

Optimized Proteomic Analysis of Insulin Granules From MIN6 Cells Identifies Scamp3, a Novel Regulator of Insulin Secretion and Content

Nicholas Norris et al. Diabetes. .

Abstract

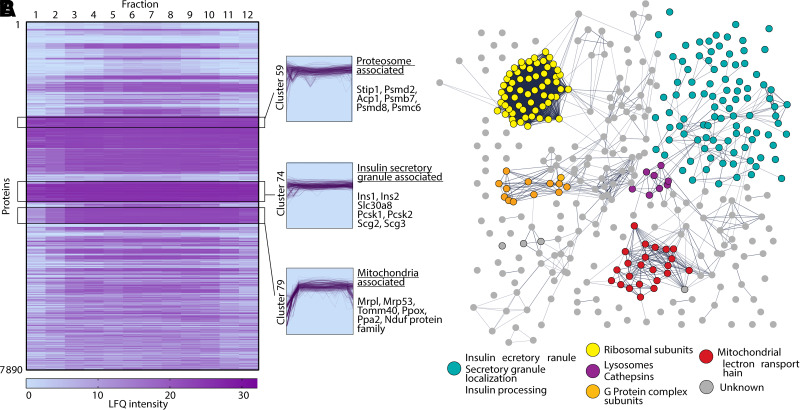
Pancreatic β-cells in the islets of Langerhans are key to maintaining glucose homeostasis by secreting the peptide hormone insulin. Insulin is packaged within vesicles named insulin secretory granules (ISGs), which recently have been considered to have intrinsic structures and proteins that regulate insulin granule maturation, trafficking, and secretion. Previously, studies have identified a handful of novel ISG-associated proteins, using different separation techniques. The present study combines an optimized ISG isolation technique and mass spectrometry-based proteomics, with an unbiased protein correlation profiling and targeted machine-learning approach to uncover 211 ISG-associated proteins with confidence. Four of these proteins, syntaxin-7, synaptophysin, synaptotagmin-13, and Scamp3 have not been previously associated with ISG. Through colocalization analysis of confocal imaging, we validate the association of these proteins to the ISG in MIN6 and human β-cells. We further validate the role for one (Scamp3) in regulating insulin content and secretion from β-cells for the first time. Scamp3 knockdown INS-1 cells have reduced insulin content and dysfunctional insulin secretion. These data provide the basis for future investigation of Scamp3 in β-cell biology and the regulation of insulin secretion.


Conflict of interest statement

Duality of Interest. No potential conflicts of interest relevant to this article were reported.

Figures

None
Graphical abstract
Figure 1
Figure 1
Analysis of isolation of iISGs and mISGs from MIN6 cells by Optiprep and Percoll. A: Optiprep workflow. MIN6 postnuclear supernatant is loaded atop five fixed concentrations of Optiprep and ultracentrifuged for 80 min at 100,000g. B: Representative example of visible subcellular fractionation distribution after ultracentrifugation. C: Representative quantification of insulin enrichment from 16 fractions of Optiprep by insulin ELISA. D: Western blot analysis of pro- and insulin enrichment of Optiprep fractions, as well as marker proteins for subcellular components of β-cells, E: Percoll workflow. Fractions 11 and 12 from Optiprep gradients, after insulin enrichment analysis, are loaded on top of 27% Percoll and ultracentrifuged for 60 min at 35,000g. F: SDS-PAGE analysis of insulin enrichment of Percoll fractionation, as well as marker proteins for subcellular components of MIN6 cells. MW, molecular weight; PNS, postnuclear supernate.
Figure 2
Figure 2
Heat map of protein enrichment hierarchical clustering across 12 fractions after three-step purification of mISGs. A: Representative heat map of abundance levels of proteins across 12 fractions. All heat maps for five experimental replicates are available in Supplementary Fig. 1. Outlined boxes indicate clusters enriched in proteasome, ISG, and mitochondrial proteins. B: Gene ontology enrichment analysis of cluster 74 (ISG-associated proteins), with individual proteins colored based on enriched biological processes. LFQ, label-free quantification.
Figure 3
Figure 3
Colocalization analysis on immunofluorescent stained MIN6 cells for candidate proteins from LC-MS/MS analysis. A: Confocal fluorescence imaging of MIN6 cells labeled with anti-insulin costained with anti-synaptophysin (n = 3), anti–synaptotagmin-13 (n = 4), anti–syntaxin-7 (n = 3), anti-Scamp3 (n = 3), anti–chromogranin A (n = 3), anti-PDI (n = 3), and anti-GM130 (n = 3). Scale bars = 10 μm. Enrichment profile of each candidate protein across 12 fractions from LC-MS/MS analysis to show protein abundance and co-enrichment. B: Quantification of colocalization of candidate proteins with insulin using Pearson correlation coefficient (with Costes automatic thresholds). Filled dots in purple represent the number of experiments (run no.) these proteins appear within pRoloc analyses. C: Confocal fluorescence imaging of human islets labeled with anti-insulin, costained with anti-synaptophysin (n = 4), anti–synaptotagmin-13 (n = 4), anti–syntaxin-7 (n = 4), and anti-Scamp3 (n = 5). Scale bars = 50 μm. D: Quantification of colocalization of candidate proteins with insulin using Pearson correlation coefficient (with automatic thresholds). All error bars represent SEM. CgA, chromogranin-A; LFQ, label-free quantification.
Figure 4
Figure 4
Functional investigation of Scamp3 in INS-1 β-cells and human non-T2D (ND) and T2D pancreatic islets. A: SDS-PAGE analysis of INS-1 cell lysates 48 h after transfection with a control nontargeting siRNA and two unique siRNAs specific to Scamp3 (siScamp3#1 [si#1] and siScamp3#2 [si#2]) in three experimental replicates together. B: Densitometry quantification of KD efficiency of Scamp3 48 h after transfection (n = 3) normalized to GAPDH. C: Insulin SDS-PAGE analysis of INS-1 cell lysates 48 h after transfection of control and siRNA KD INS-1 cells. D: Densitometry quantification of insulin content in control and siRNA KD INS-1 cells (n = 3) normalized to β-actin. E: Quantification of total insulin content 48 h after transfection of control and siRNA KD INS-1 cells by insulin ELISA (n = 9). F: Quantification of total proinsulin content 48 h after transfection of control and siRNA KD cells by proinsulin ELISA. G: GSIS assay. Insulin concentration after basal (2.8 mmol/L) and stimulation (16.7 mmol/L) glucose conditions from INS-1 control and siRNA KD cells measured by insulin homogeneous time-resolved fluorescence (n = 8). H: Fold-change of basal to stimulation glucose conditions from E (n = 8). I: Representative confocal fluorescence imaging of human ND (n = 5) and T2D (n = 5) islets labeled with anti-insulin and costained with Scamp3. J: Mean fluorescence intensity of Scamp3 within β-cells of human ND and T2D islets. K: Quantification of colocalization of Scamp3 with insulin using Pearson correlation coefficient (with Costes automatic thresholds) in human ND and T2D islets. All error bars represent SEM. *P < 0.05, **P < 0.01, ***P < 0.001. siNTC, siRNA against a non-targeting control.

References

    1. Honka M-J, Latva-Rasku A, Bucci M, et al. . Insulin-stimulated glucose uptake in skeletal muscle, adipose tissue and liver: a positron emission tomography study. Eur J Endocrinol 2018;178:523–531 - PMC - PubMed
    1. Thurmond DC, Gaisano HY. Recent insights into beta-cell exocytosis in type 2 diabetes. J Mol Biol 2020;432:1310–1325 - PMC - PubMed
    1. Gandasi NR, Yin P, Omar-Hmeadi M, et al. . Glucose-dependent granule docking limits insulin secretion and is decreased in human type 2 diabetes. Cell Metab 2018;27:470–478 e474 - PubMed
    1. Germanos M, Gao A, Taper M, Yau B, Kebede MA. Inside the insulin secretory granule. Metabolites 2021;11(8):515. - PMC - PubMed
    1. Ramzy A, Asadi A, Kieffer TJ. Revisiting proinsulin processing: evidence that human β-cells process proinsulin with prohormone convertase (PC) 1/3 but not PC2. Diabetes 2020;69:1451–1462 - PubMed