. 2024 Sep 25;18(9):e0012454.
doi: 10.1371/journal.pntd.0012454. eCollection 2024 Sep.

ST8Sia2 polysialyltransferase protects against infection by Trypanosoma cruzi

Affiliations

ST8Sia2 polysialyltransferase protects against infection by Trypanosoma cruzi

Bruno Rafael Barboza et al. PLoS Negl Trop Dis. .

Abstract

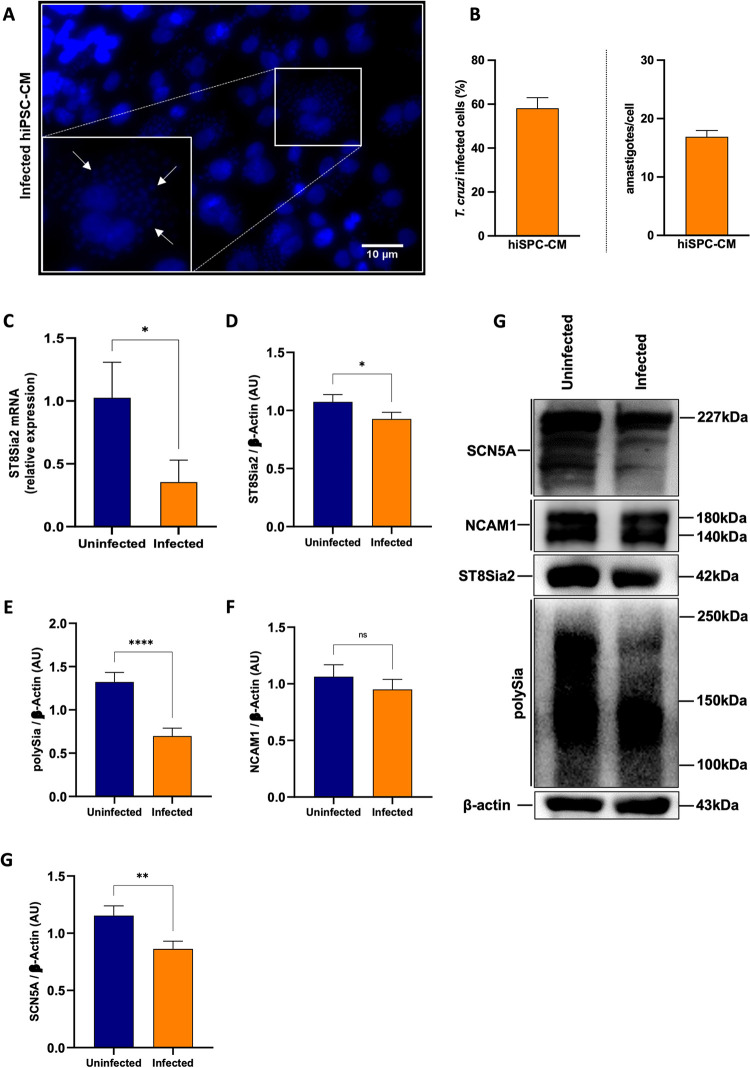
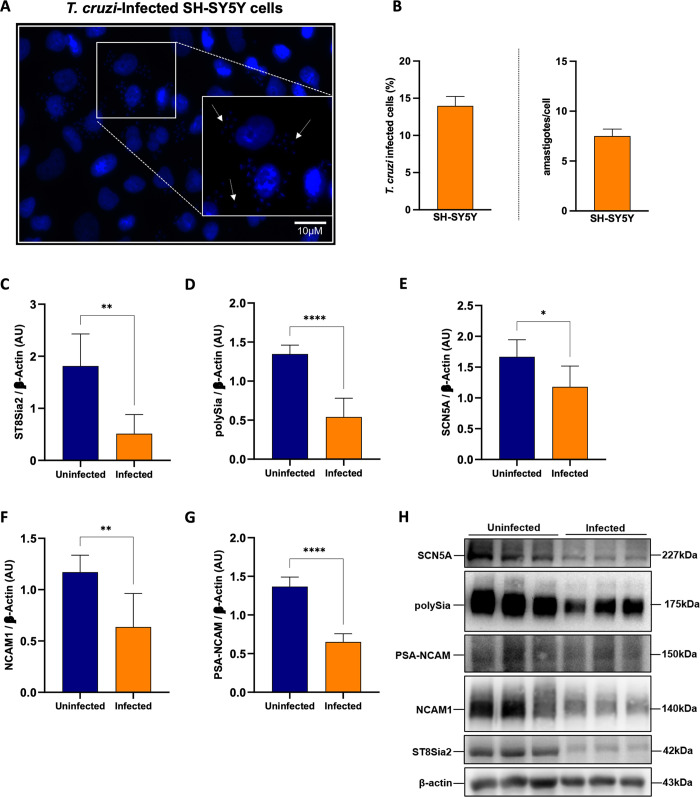
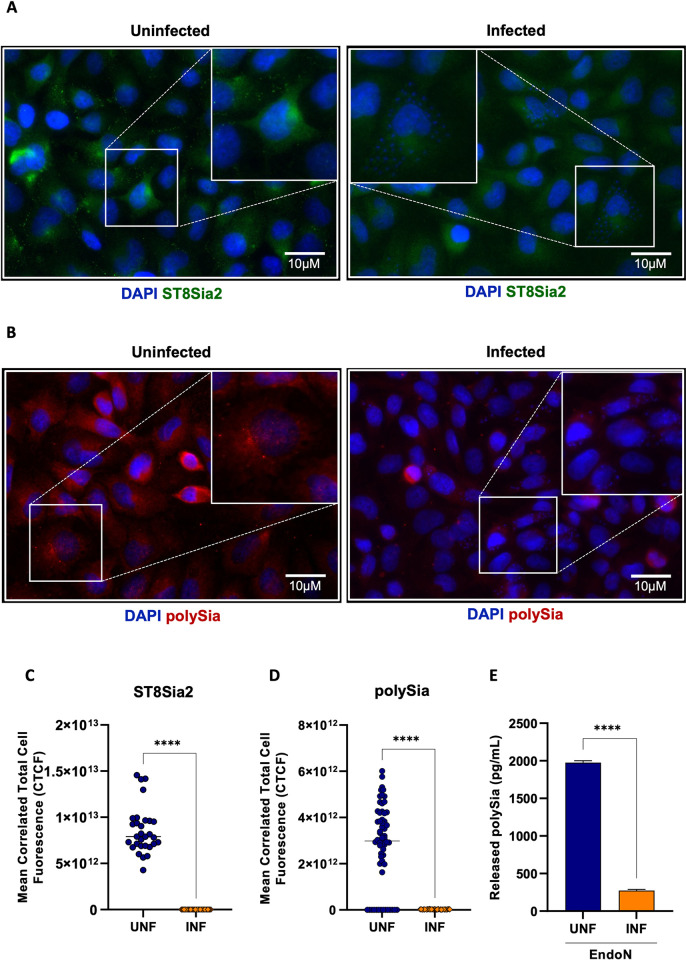
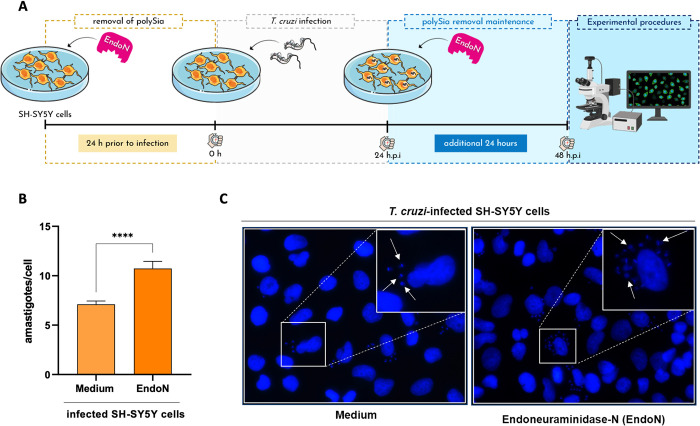
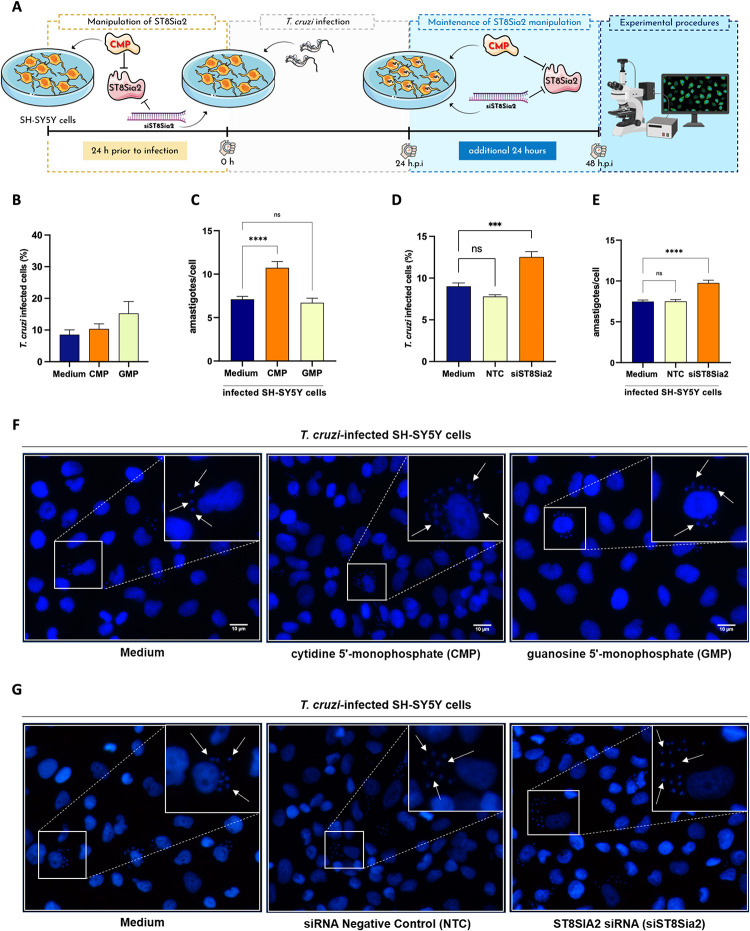
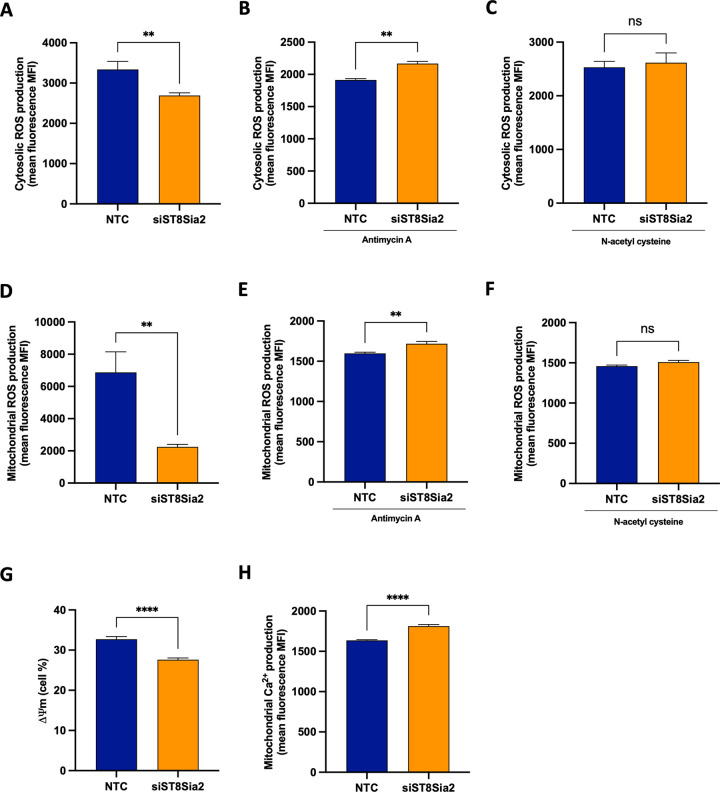
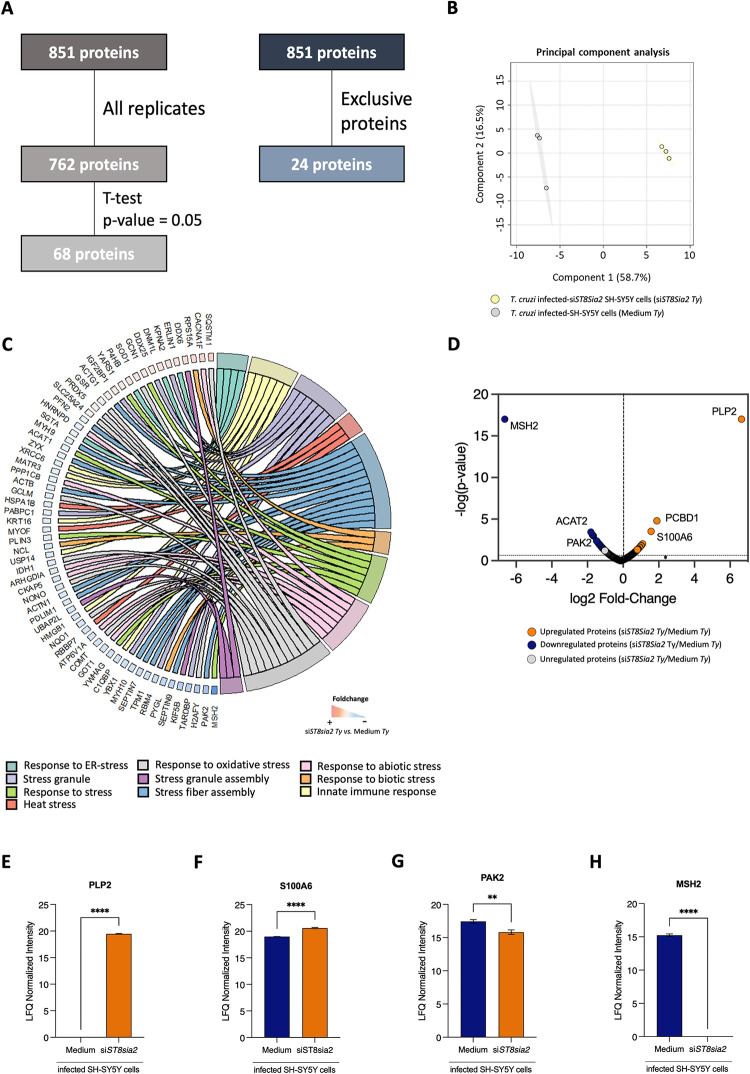
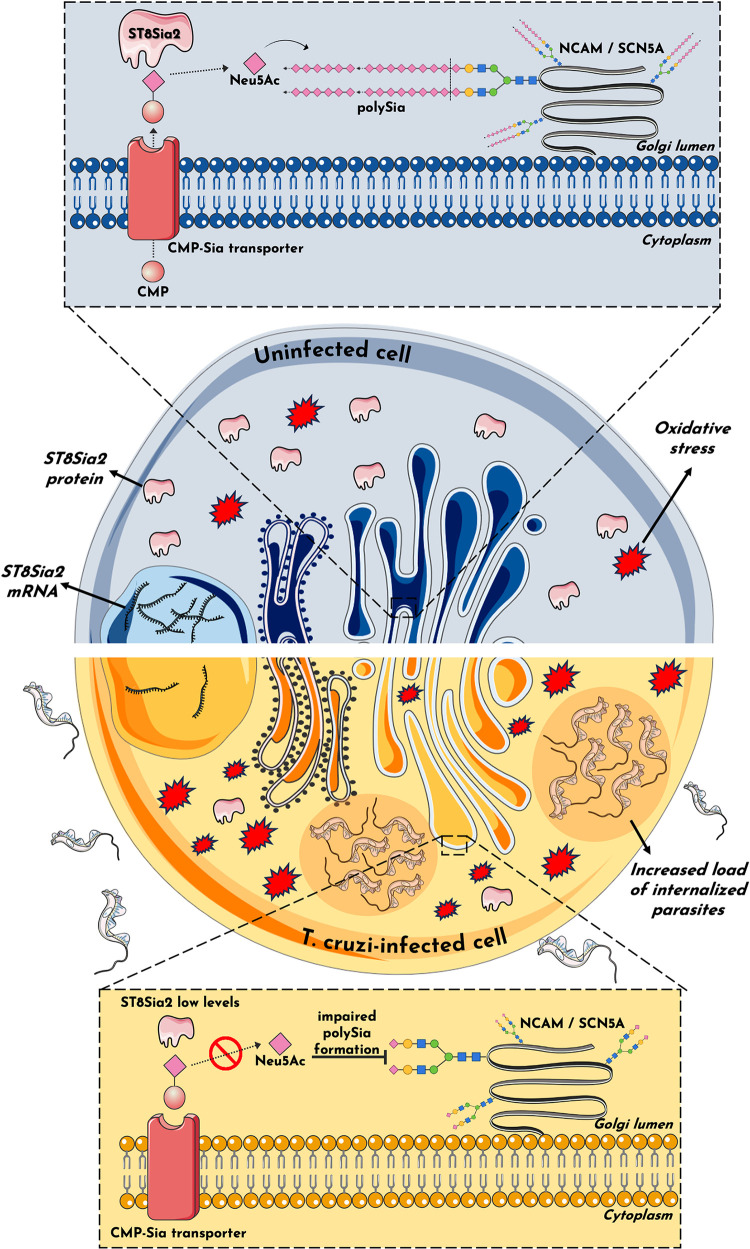
Glycosylation is one of the most structurally and functionally diverse co- and post-translational modifications in a cell. Addition and removal of glycans, especially to proteins and lipids, characterize this process which has important implications in several biological processes. In mammals, the repeated enzymatic addition of a sialic acid unit to underlying sialic acids (Sia) by polysialyltransferases, including ST8Sia2, leads to the formation of a sugar polymer called polysialic acid (polySia). The functional relevance of polySia has been extensively demonstrated in the nervous system. However, the role of polysialylation in infection is still poorly explored. Previous reports have shown that Trypanosoma cruzi (T. cruzi), a flagellated parasite that causes Chagas disease (CD), changes host sialylation of glycoproteins. To understand the role of host polySia during T. cruzi infection, we used a combination of in silico and experimental tools. We observed that T. cruzi reduces both the expression of the ST8Sia2 and the polysialylation of target substrates. We also found that chemical and genetic inhibition of host ST8Sia2 increased the parasite load in mammalian cells. We found that modulating host polysialylation may induce oxidative stress, creating a microenvironment that favors T. cruzi survival and infection. These findings suggest a novel approach to interfere with parasite infections through modulation of host polysialylation.


Conflict of interest statement

The authors have declared that no competing interests exist.

Figures

Fig 1
Fig 1. T. cruzi infection modulates the abundance of ST8Sia2, SCN5A, and polysialylation on hiPSC-CM.
(A-G) hiPSC-CM cells were seeded in 24-well microplates (2 x 10⁵ cells/well) and infected with T. cruzi trypomastigotes (Y strain) at ratio of 1:5 (hiPSC-CM:trypomastigotes), follow by 48 h incubation at 37°C. hiPSC-CM cells incubated with medium alone (Uninfected) were used as negative control; (A) Representative immunofluorescence images of T. cruzi-infected hiPSC-CM. Cell nuclei were stained with DAPI (scale bars = 10 μm). White arrows are representative of T. cruzi amastigotes inside hiPSC-CM cells; (B) Representative graphs of the percentage of T. cruzi-infected hiPSC-CM (left), and quantification of the number of intracellular parasites (amastigotes) per infected cell (right); (C) Relative expression of mRNA ST8Sia2 measured by qRT-PCR in T. cruzi-infected hiPSC-CM. The Ct values of the target transcripts were normalized to the relative expression of GAPDH as endogenous control, and the relative expression of ST8Sia2 transcripts was quantified by the 2-ΔΔ Ct method. Each bar represents the mean of three independent experiments performed in triplicate; (D-H) Representative Western blotting quantification of ST8Sia2 (D), polySia (E), NCAM1 (F), and SCN5A (G) in T. cruzi-infected hiPSC-CM cells. The protein levels were analyzed by Western blotting of RIPA cell lysates (15 μg protein) performed under reducing conditions. Results are presented as arbitrary densitometry units (AU). After normalization to the corresponding β-actin content (endogenous control), data were plotted as the ratio between the values obtained in infected and uninfected cells in their respective endogenous controls. Each bar represents the mean of three independent experiments performed in triplicate; (H) Representative Western blotting images of levels of ST8Sia2 (D), polySia (E), NCAM1 (F), and SCN5A (G) in T. cruzi-infected hiPSC-CM cells. Results are expressed as mean ± SEM. Significant differences compared to the uninfected cells are shown by (*) p < 0.05, (**) p < 0.001, and (***) p <0.0001; ns = not significant.
Fig 2
Fig 2. T. cruzi infection modulates the polysialylation on SH-SY5Y cells and affects the abundance of polysialylated molecules.
(A) Representative immunofluorescence images of T. cruzi-infected SH-SY5Y cells. SH-SY5Y cells were seeded in 24-well microplates (5 x 10⁵ cells/well) and infected with T. cruzi trypomastigotes (Y strain) at ratio of 1:5 (SH-SY5Y:trypomastigotes) at 37°C. 48 h.p.i SH-SY5Y cells incubated with medium alone (Uninfected) was used as negative control. Cell nuclei were stained with DAPI (scale bars = 10 μm). White arrows are representative of T. cruzi amastigotes inside in SH-SY5Y cells; (B) Representative graphs of the percentage of T. cruzi-infected hiPSC-CM (left), and quantification of the number of intracellular parasites (amastigotes) per infected cell (right); (C-H) Western blotting quantification of ST8Sia2 levels (C), polysialic acid (polySia) (D), SCN5A (E), NCAM1 (F) and PSA-NCAM (G) in T. cruzi-infected SH-SY5Y cells. SH-SY5Y cells were seeded in 6-well microplates (1 x 10⁶ cells/well) and infected with T. cruzi as in A. 48 h.p.i, the proteins levels were analyzed by Western blotting of RIPA cell lysates (15 μg protein) performed under reducing conditions. Results are presented as arbitrary densitometry units (AU). After normalization to the corresponding β-actin content (endogenous control), data were plotted as the ratio between the values obtained in infected and uninfected cells in their respective endogenous controls. Each bar represents the mean of three independent experiments performed in triplicate; (H) Representative Western blot images of ST8Sia2 (C), polySia (D), SCN5A (E), NCAM1 (F), and PSA-NCAM (G) in T. cruzi-infected SH-SY5Y cells. Results are expressed as mean ± SEM. Significant differences compared to the uninfected cells are shown by (*) p < 0.05, (**) p < 0.001, and (****) p < 0.0001.
Fig 3
Fig 3. T. cruzi infection reduces ST8Sia2 and PolySia levels in SH-SY5Y cells.
(A,B) Representative images of ST8Sia2 (A) and PolySia (B) levels in T. cruzi-infected SH-SY5Y cells. SH-SY5Y cells were seeded in 24-well microplates (5 x 10⁵ cells/well) and infected with T. cruzi trypomastigotes (Y strain) at ratio of 1:5 (SH-SY5Y:trypomastigotes) at 37°C. After 48 h.p.i, T. cruzi-infected SH-SY5Y cells were stained with specific anti-ST8Sia2 (A) and anti-polySia (B) antibodies, and labeling for the targets was visualized by immunofluorescence microscopy. SH-SY5Y cells incubated with medium alone (Medium) was used as negative controls. Cell nuclei were stained with DAPI (scale bars = 10 μm); (C,D) Quantification of ST8Sia2 (C) and polySia (D) fluorescence intensity in T. cruzi-infected SH-SY5Y cells using the calculation for corrected total cell fluorescence (CTCF) as explained in Material and Methods section. Each dot represents the CTCF read out from one cell. A total of 50 SH-SY5Y cells per condition (infected and uninfected) were quantified. The values are expressed as Mean CTCF ± standard error of the mean (SEM); (E) polySia levels measured in T. cruzi-infected and non-infected SH-SY5Y cells supernatants. SH-SY5Y cells were seeded in T75-flasks (5 x 10⁵ cells/mL) and infected with T. cruzi trypomastigotes (Y strain) at ratio of 1:5 (SH-SY5Y:trypomastigotes) at 37°C. After 48 h.p.i, T. cruzi-infected SH-SY5Y cells were treated with EndoN [0.5 μg/ml] for 1h at 37°C, and polySia levels were measured in supernatants using UHPLC. The same procedure was applied to non-infected SH-SY5Y cells. The results are expressed in pg/mL. Significant differences compared to the uninfected are shown by (****) p < 0.0001.
Fig 4
Fig 4. Removal of polySia in SH-SY5Y cells favors T. cruzi infection by increasing the number of internalized parasites.
(A) Experimental workflow adopted to investigate the effect of enzymatic removal of polySia in T. cruzi-infected SH-SY5Y cells by EndoNeuraminidase (EndoN) [0.5 μg/ml]. SH-SY5Y cells were seeded in 24-well microplates (5 x 10⁵ or 5 x 10⁴ cells/well) and treated with EndoN [0.5 μg/ml] for 24h before infection, followed by addition of T. cruzi trypomastigotes (Y strain) at ratio of 1:5 (SH-SY5Y:trypomastigotes). After 24 h.p.i, T. cruzi-infected SH-SY5Y cells were submitted to another treatment with EndoN [0.5 μg/ml] for an additional 24h. Medium alone (Medium) were used as negative control; (B) Quantification of the number of intracellular parasites (amastigotes) per infected cell. Cell nuclei were stained with DAPI and following the experimental approach shown in B, amastigotes were counted in a total of 100 infected SH-SY5Y cells. Results are expressed as mean ± standard error of the mean (SEM) performed in triplicates; (C) Representative immunofluorescence images of T. cruzi-infected SH-SY5Y cells following the strategy adopted in the experimental workflow presented in B. Cell nucleus were stained with DAPI (scale bars = 10 μm). White arrows are representative of T. cruzi amastigotes inside in SH-SY5Y cells. Significant differences compared to the T. cruzi-infected SH-SY5Y treated with medium alone (Medium) are shown by (****) p < 0.0001; ns: not significant. Parts of the figure were drawn by using pictures from Servier Medical Art. Servier Medical Art by Servier is licensed under a Creative Commons Attribution 3.0 Unported License (https://creativecommons.org/licenses/by/3.0/), and BioRender.com under academic license.
Fig 5
Fig 5. Chemical and genetic inhibition of ST8Sia2 polysialyltransferase activity in SH-SY5Y cells favors T. cruzi proliferation.
(A) Experimental workflow adopted to investigate the effect of chemical and genetic inhibition of ST8Sia2 in T. cruzi-infected SH-SY5Y cells using 0.5 mM of CMP. SH-SY5Y cells were seeded in 24-well microplates (5 x 10⁵ or 5 x 10⁴ cells/well), and previously treated with CMP [0.5 mM] or siRNA ST8Sia2 [100 nM] for 24h before infection, followed by infection with T. cruzi trypomastigotes (Y strain) at ratio of 1:5 (SH-SY5Y:trypomastigotes). After 24 h.p.i, T. cruzi-infected SH-SY5Y cells were treated with CMP [0.5 mM] or siRNA ST8Sia2 [100 nM] for an additional 24h. Guanosine 5’-monophosphate (GMP), siRNA negative control (NTC), and/or medium alone (Medium) were used as negative controls for chemical or genetic inhibition of ST8Sia2. In all controls used in experiments with siRNA was added Lipofectamine RNAiMAX; (B) Representative graphs of the percentage of T. cruzi-infected SH-SY5Y treated with CMP; (C) Quantification of the number of intracellular parasites (amastigotes) per infected cell treated with CMP. Cell nuclei were stained with DAPI and following the experimental approach shown in A, amastigotes were counted in a total of 100 infected SH-SY5Y cells. (D) Representative graphs of the percentage of T. cruzi-infected SH-SY5Y treated with siRNA ST8Sia2 (siST8Sia2); (E) Quantification of the number of intracellular parasites (amastigotes) per infected cell. Cell nuclei were stained with DAPI and following the experimental approach shown in A, amastigotes were counted in a total of 100 infected SH-SY5Y cells. Results are expressed as mean ± standard error of the mean (SEM) performed in triplicates; (F,G) Representative immunofluorescence images of T. cruzi-infected SH-SY5Y cells treated with CMP (F), and T. cruzi-infected SH-SY5Y treated with siRNA ST8Sia2 (G), following the strategy adopted in the experimental workflow presented in A. Cell nuclei were stained with DAPI (scale bars = 10 μm). White arrows are representative of T. cruzi amastigotes inside in SH-SY5Y cells. Significant differences compared to the T. cruzi-infected SH-SY5Y treated with medium alone (Medium) are shown by (***) p < 0.0005, (****) p < 0.0001; ns: not significant. Parts of the figure were drawn by using pictures from Servier Medical Art. Servier Medical Art by Servier is licensed under a Creative Commons Attribution 3.0 Unported License (https://creativecommons.org/licenses/by/3.0/), and BioRender.com under academic license.
Fig 6
Fig 6. Silencing of ST8Sia2 in SH-SY5Y cells modulates oxidative stress.
SH-SY5Y cells were seeded in 6-well microplates (1 x 10⁶ cells/well) and treated with siRNA ST8Sia2 [100 nM] for 24 hours. After this time, SH-SY5Y siST8Sia2 cells were treated or not with Antimycin A [50 μM] or N-acetyl cysteine [50 μM] for 4 hours. Negative control siRNA (NTC) was used as the negative control for silencing of ST8Sia2. In all controls used in experiments with siRNA was added Lipofectamine RNAiMAX. (A-C) SH-SY5Y siST8Sia2 cells previously treated or not with Antimycin A and/or N-acetyl cysteine were incubated with Dihydroethidium [3 μM] at 37°C for 40 minutes to determine cytosolic reactive oxygen species (ROS) levels; (D-F) SH-SY5Y siST8Sia2 cells previously treated or not with Antimycin A and/or N-acetyl cysteine were incubated with MitoSOX Red [5 μM] at 37°C for 10 minutes to determine mitochondrial reactive oxygen species (ROS) levels; (G) SH-SY5Y siST8Sia2 cells were incubated with MitoTracker Red CMXRos Dye [100 nM] at 37°C for 30 minutes to determine mitochondrial membrane potential (ΔΨm); (H) SH-SY5Y siST8Sia2 cells were incubated with Rhod-2 [5 μM] at 37°C for 60 minutes to determine mitochondrial calcium ion (Ca2+) levels. Results are expressed as mean ± SEM. Significant differences compared to SH-SY5Y cells treated with negative control siRNA (NTC) are indicated by (**) p < 0.005, (****) p < 0.0001; ns: not significant.
Fig 7
Fig 7. Proteomic analysis of SH-SY5Y cells with ST8sia2 gene silencing (siST8sia2) and Lipofectamine RNAiMAX-treated control (Medium), both infected with T. cruzi (Ty).
SH-SY5Y cells were seeded in 6-well microplates (1 x 10⁶ cells/well), and previously treated with siRNA ST8Sia2 [100 nM] for 24h before infection, followed by infection with T. cruzi trypomastigotes (Y strain) at ratio of 1:5 (SH-SY5Y:trypomastigotes). After 24 h.p.i, T. cruzi-infected SH-SY5Y cells were treated with siRNA ST8Sia2 [100 nM] for an additional 24h. Medium alone (Medium) was used as negative control for genetic inhibition of ST8Sia2. In all controls used in experiments with siRNA was added Lipofectamine RNAiMAX. (A) Proteins identified in all biological replicates or exclusively in one of the evaluated groups: cells silenced for ST8sia2 (siST8sia2, n = 3) and medium-treated with Lipofectamine RNAiMAX (Medium, n = 3); (B) Principal component analysis (PCA) of SH-SY5Y cells silenced for ST8sia2 (siST8sia2, green) and Medium-treated control (Medium, grey), both infected with T. cruzi; (C) Chord plot showing the proteins involved in biological pathways and processes related to the different stress responses; (D) Volcano plot illustrating the differentially regulated proteins in the T. cruzi-infected siST8si2 SH-SY5Y vs. Medium comparison, with upregulated proteins shown in orange, downregulated proteins in blue, and unregulated proteins in grey (p-value < 0.05); (E) Boxplot of differentially regulated stress response proteins in T. cruzi-infected SH-SY5Y Cells with ST8Sia2 Silencing. Significant differences compared to T. cruzi-infected siST8Sia2 SH-SY5Y cells with T. cruzi-infected SH-SY5Y cells treated with medium (negative control for genetic silence of ST8Sia2 are indicated by p <0.0001 (****); p <0.001 (***); p <0.01 (**); p < 0.05 (*).
Fig 8
Fig 8. Potential mechanism of host polysialylation modulation during T. cruzi infection.
The findings in this study suggest an impact on host polysialylation during T. cruzi infection. Under conditions of homeostasis, ST8Sia2 catalyzes the transfer of Neu5Ac monomers from cytidine monophosphate N-acetylneuraminic acid (CMP-Neu5Ac) to glycoproteins within the Golgi complex, forming a polymer of α-2,8-glycosidic linkages between Neu5Ac monomers known as polySia. This phenomenon, termed polysialylation, assumes pivotal roles across a spectrum of cellular functions. The addition of polySia into molecules such as NCAM1 and SCN5A influences cardiac contractility and neural communication, exemplifying its multifaceted significance. In this study, we show that host polysialylation impact T. cruzi infection dynamics. Our investigation has unveiled that T. cruzi infection diminishes the expression/abundance of the ST8Sia2 enzyme, compromising polySia formation, and its subsequent addition to polysialylated target molecules, including SCN5A and NCAM1. Consequently, the attenuation of ST8Sia2 and polySia levels may influence the host cell susceptibility to generate an oxidative stress environment that may favor T. cruzi infection, as polysialylation modulation is accompanied by an increase in the number of internalized parasites and susceptibility to oxidative stress. It is plausible to posit that the modulation of host polysialylation by the parasite serves as a determinant in the pathogenesis of Chagas disease. Parts of the figure were drawn by using pictures from Servier Medical Art. Servier Medical Art by Servier is licensed under a Creative Commons Attribution 3.0 Unported License (https://creativecommons.org/licenses/by/3.0/).

References

    1. Gu J, Taniguchi N. Potential of N-glycan in cell adhesion and migration as either a positive or negative regulator. Cell Adh Migr. 2008;2: 243–245. doi: 10.4161/cam.2.4.6748 - DOI - PMC - PubMed
    1. Giovannone N, Liang J, Antonopoulos A, Geddes Sweeney J, King SL, Pochebit SM, et al.. Galectin-9 suppresses B cell receptor signaling and is regulated by I-branching of N-glycans. Nat Commun. 2018;9: 3287. doi: 10.1038/s41467-018-05770-9 - DOI - PMC - PubMed
    1. Barboza BR, Thomaz SM de O, Junior A de C, Espreafico EM, Miyamoto JG, Tashima AK, et al.. ArtinM Cytotoxicity in B Cells Derived from Non-Hodgkin’s Lymphoma Depends on Syk and Src Family Kinases. Int J Mol Sci. 2023;24. doi: 10.3390/ijms24021075 - DOI - PMC - PubMed
    1. Baum LG, Cobb BA. The direct and indirect effects of glycans on immune function. Glycobiology. 2017;27: 619–624. doi: 10.1093/glycob/cwx036 - DOI - PubMed
    1. Smith BAH, Bertozzi CR. The clinical impact of glycobiology: targeting selectins, Siglecs and mammalian glycans. Nat Rev Drug Discov. 2021;20: 217–243. doi: 10.1038/s41573-020-00093-1 - DOI - PMC - PubMed

Substances