. 2024 Dec 2;30(23):5459-5472.
doi: 10.1158/1078-0432.CCR-24-1454.

Multidimensional Immunotyping of Human NF1-Associated Peripheral Nerve Sheath Tumors Uncovers Tumor-Associated Macrophages as Key Drivers of Immune Evasion in the Tumor Microenvironment

Affiliations

Multidimensional Immunotyping of Human NF1-Associated Peripheral Nerve Sheath Tumors Uncovers Tumor-Associated Macrophages as Key Drivers of Immune Evasion in the Tumor Microenvironment

Lindy Zhang et al. Clin Cancer Res. .

Abstract

Purpose: Malignant peripheral nerve sheath tumors (MPNST) are aggressive soft-tissue sarcomas and the leading cause of mortality in individuals with neurofibromatosis type 1 (NF1). Despite many clinical trials, outcomes for patients with MPNST have remained stagnant, and most succumb to their disease; thus, novel therapeutic approaches are needed. A better understanding of the MPNST immune ecosystem will aid in the development of strategies to activate the immune system against the tumor. In this study, we profile the tumor immune microenvironment (TIME) in NF1-associated peripheral nerve sheath tumors (PNST) to discover insights on the role played by tumor-infiltrating immune cells in malignant transformation.

Experimental design: Using fresh and formalin-fixed paraffin-embedded tissue from patients diagnosed with NF1-PNST, we dissected the TIME through IHC, multiparameter flow cytometry, and comparative transcriptomic studies.

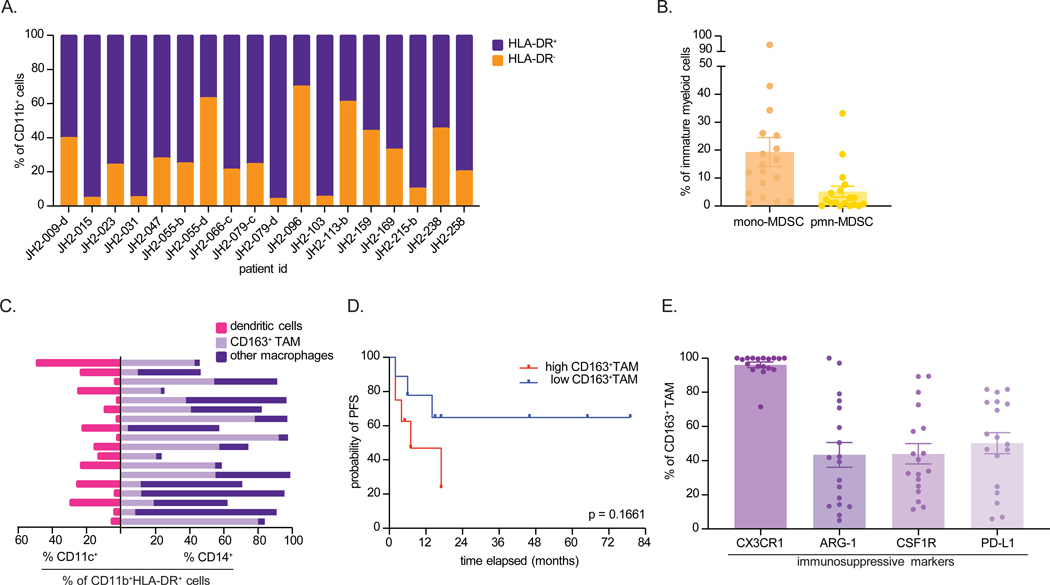
Results: Immunophenotyping confirmed increased immune cell infiltration during malignant progression, with a predominance of infiltrating myeloid cells, particularly CD163+ tumor-associated macrophages (TAM). The T cells within MPNST exhibited signs of tumor activation, characterized by high programmed cell death 1 expression. Additionally, MPNST specimens demonstrated elevated levels of immunosuppressive TAM, with heightened PD-L1 expression. The proportion of CD163+ myeloid cells within the TIME correlated with poorer progression-free survival. Notably, loss of H3K27 trimethylation correlated with low immune cell infiltration in MPNST.

Conclusions: Malignant transformation of NF1-PNST is characterized by an immunosuppressive microenvironment comprising TAM with high expression of PD-L1, which is associated with inferior outcomes. These findings suggest the clinical potential of immune-modulating therapeutics that can unleash an antitumor immune response.


Conflict of interest statement

Conflict of interest: C.A.P. is a recipient of research grants from Novartis (not relevant to the current manuscript) and Kura Oncology (not relevant to the current manuscript) and has received consulting fees from Day One Therapeutics and Genentech (not relevant to the current manuscript). J.W. and C.A.P. are inventors on the patent application (publication date: 10 November 2022; WO2022234409A1) held/submitted by the Johns Hopkins University and Novartis that covers compounds and compositions for the treatment of MPNST. A.J.B. has received consulting fees from AstraZeneca (not relevant to the current manuscript). J.O.B. is a national co-investigator for clinical trials supported by Alexion, SpringWorks, and Takeda (none are relevant to this current manuscript). The other co-authors declare that they have no competing interests.

Figures

Figure 1.
Figure 1.. Increased immunosuppressive inflammation during malignant transformation
Digital image quantification of intratumoral immune cells densities from immunohistochemistry tissue slides of 16 PN, 7 ANNUBP, and 29 MPNST human specimen. (A) Quantification of tumor-infiltrating lymphoid cells (CD19, CD3, CD8 and FOXP3). (B) Calculated ratio of the density of tumor-infiltrating regulatory T cells (FOXP3+) to cytotoxic T cells (CD8+), and (C) Quantification of tumor-infiltrating myeloid cells in NF1-associated PNST, stratified by PN, ANNUBP, or MPNST. Data are represented as individual values by specimen (dots), and median with 95% confidence intervals. Significant p-values (p<0.05) calculated by nonparametric Mann-Whitney test are shown. (D) The ratios of CD8+ to CD163+ cell densities were calculated for the malignant specimens and the black bar indicates the median (0.153). Low CD8:CD163 was defined as less than median and high CD8:CD163 was defined as equal to or greater than the median. Kaplan-Meier survival curve of OS of patients whose MPNST sample had high vs low CD8:CD163 with median survival of undefined versus 13 months, and log-rank test p = 0.0092. (E) QuanTIseq deconvolution of bulk PNST expression data of 39 PN and 18 MPNST. Significant enrichment of NK cells (p=0.0001), neutrophils (p<0.0001), monocytes (p=0.0009), M2 macrophages (p=0.01), and M1 macrophages (p=0002). in MPNST compared to PN. Significant p-values (p<0.05) calculated by nonparametric Kolmogorv-Smirnov test. Abbreviations: OS = overall survival
Figure 2.
Figure 2.. High percentage of T cells are tumor-activated within malignant tumors
Flow cytometric data of isolated intratumoral T cells from 18 human MPNST specimens. (A) Proportion of CD8+ and CD4+ T cells relative to the total single-positive CD3+ T cells. (B) PD-1 positivity on T cell subsets and a simple linear regression of PD-1 positivity on CD8+ vs CD4+ T cells (r2=0.4945, P = 0.0011). (C) Kaplan-Meier survival curve (PFS) of patients whose MPNST sample had high CD8PD1:CD4PD1 (greater than or equal to median) vs low CD8PD1:CD4PD1 (less than median) ratio. The ratio was calculated from flow cytometric data of percent of PD-1 positivity on CD8+ T cells divided by percent of PD-1 positivity on CD4+ T cells. Median survival of high vs low CD8:CD4 was undefined vs 6.5 months, and log-rank test p=0.493. (D) Quantification of Th2 markers (GATA2, IL-4, TSLPR, CX3CR1, and CCR4) on CD4+PD-1+ T cells. Data are represented as mean ± SEM. Abbreviations: PFS = progression free survival
Figure 3.
Figure 3.. TAM with immunosuppressive phenotype dominate the TIME in MPNST
Flow cytometric data of isolated intratumoral myeloid cells from 18 human MPNST specimens. (A) Relative proportions of immature (CD11b+HLA-DR-) and mature (CD11b+HLA-DR+) among all live myeloid cells within each specimen. (B) Percentage of m-MDSC and pmn-MDSC within immature myeloid cell populations. Data are represented as mean ± SEM. (C) Percentage of CD11c+ dendritic cells and CD14+ macrophages within mature myeloid cell populations. Macrophages were subdivided to show proportion of CD163+ TAM. (D) Kaplan-Meier survival curve of PFS of patients whose MPNST sample has lower (less than median) vs higher (greater than or equal to median) CD163+ TAM. CD163+ TAM proportions were calculated by percentage out of all live immune cells. Median PFS of low vs high CD163 was undefined vs 7.0 months, with log-rank test p=0.1661. (E) Quantification of relevant immunosuppressive surface proteins (CX3CR1, ARG-1, CSF1R, PD-L1) on CD163+ TAM. Data are represented as mean ± SEM. Abbreviations: m-MDSC = monocytic myeloid-derived suppressor cells; pmn-MDSC = polymorphonuclear myeloid-derived suppressor cells; TAM = tumor associated macrophages; PFS = progression free survival; PNST = peripheral nerve sheath tumor
Figure 4.
Figure 4.. The role of PD-L1 expression on TAM in shaping the immunosuppressive microenvironment during malignancy
Digital image quantification of immunoregulatory proteins from immunohistochemistry tissue slides of 16 PN, 7 ANNUBP, and 29 MPNST human specimens. (A) Quantification of HLA-class I, CSF1R, and PD-L1 protein expression. Densities calculated as percent of total nucleated cells. Data are represented as median with 95% confidence intervals. Significant p-values (p<0.05) calculated by nonparametric Mann-Whitney test are shown. (B) Representative tissue specimen stained for PD-L1 from an individual in which a neuropathologist confirmed presence of PN, ANNUBP, and MPNST fragments within one tumor. (C) MFC data represented as a scatterplot showing percentage of PD-L1 positivity on CD163+ macrophages and live non-immune cells (CD45-). Data are represented as mean ± SEM. Images of IHC from corresponding samples verified MFC findings. (D) Two representative tissue specimens from different individuals displaying distribution of immune cells within malignant tumors. There is spatial convergence of CD8, PD-L1 and CD163 positive cells within clusters. Abbreviations: MFC = multiparameter flow cytometry; IHC = immunohistochemistry
Figure 5.
Figure 5.. H3K27me3 status defines immune phenotypes in MPNST
Assessment of H3K27me3 status in 26 MPNST tissue specimens and the association with immune cell infiltration. (A) IHC of representative samples with loss or retained H3K27me3. (B) Digital quantification of immune cells within MPNST specimens, differentiated by loss or retention of H3K27 methylation status. Data are represented as median with 95% confidence intervals.

References

    1. Prudner BC, Ball T, Rathore R, Hirbe AC. Diagnosis and management of malignant peripheral nerve sheath tumors: Current practice and future perspectives. Neurooncol Adv. 2020;2(Suppl 1):i40–i9. - PMC - PubMed
    1. Hirbe AC, Gutmann DH. Neurofibromatosis type 1: a multidisciplinary approach to care. Lancet Neurol. 2014;13(8):834–43. - PubMed
    1. Miettinen MM, Antonescu CR, Fletcher CDM, Kim A, Lazar AJ, Quezado MM, et al. Histopathologic evaluation of atypical neurofibromatous tumors and their transformation into malignant peripheral nerve sheath tumor in patients with neurofibromatosis 1-a consensus overview. Hum Pathol. 2017;67:1–10. - PMC - PubMed
    1. Kim A, Stewart DR, Reilly KM, Viskochil D, Miettinen MM, Widemann BC. Malignant Peripheral Nerve Sheath Tumors State of the Science: Leveraging Clinical and Biological Insights into Effective Therapies. Sarcoma. 2017;2017:7429697. - PMC - PubMed
    1. Carli M, Ferrari A, Mattke A, Zanetti I, Casanova M, Bisogno G, et al. Pediatric malignant peripheral nerve sheath tumor: the Italian and German soft tissue sarcoma cooperative group. J Clin Oncol. 2005;23(33):8422–30. - PubMed

MeSH terms