. 2024 Oct 7;221(10):e20231193.
doi: 10.1084/jem.20231193. Epub 2024 Sep 25.

Precursor central memory versus effector cell fate and naïve CD4+ T cell heterogeneity

Affiliations

Precursor central memory versus effector cell fate and naïve CD4+ T cell heterogeneity

Deeksha Deep et al. J Exp Med. .

Erratum in

Abstract

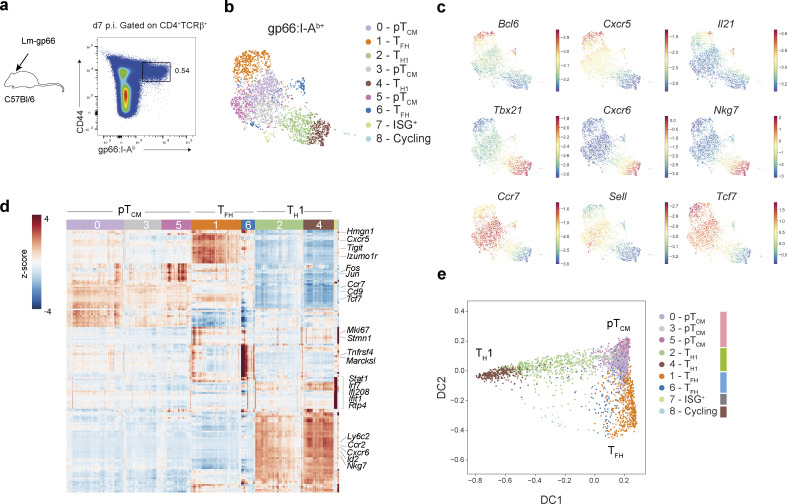
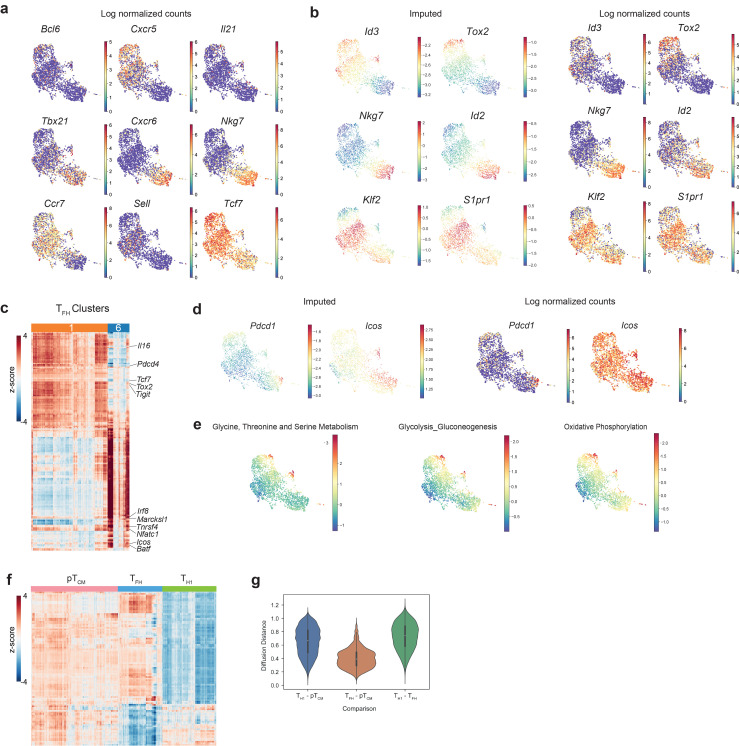
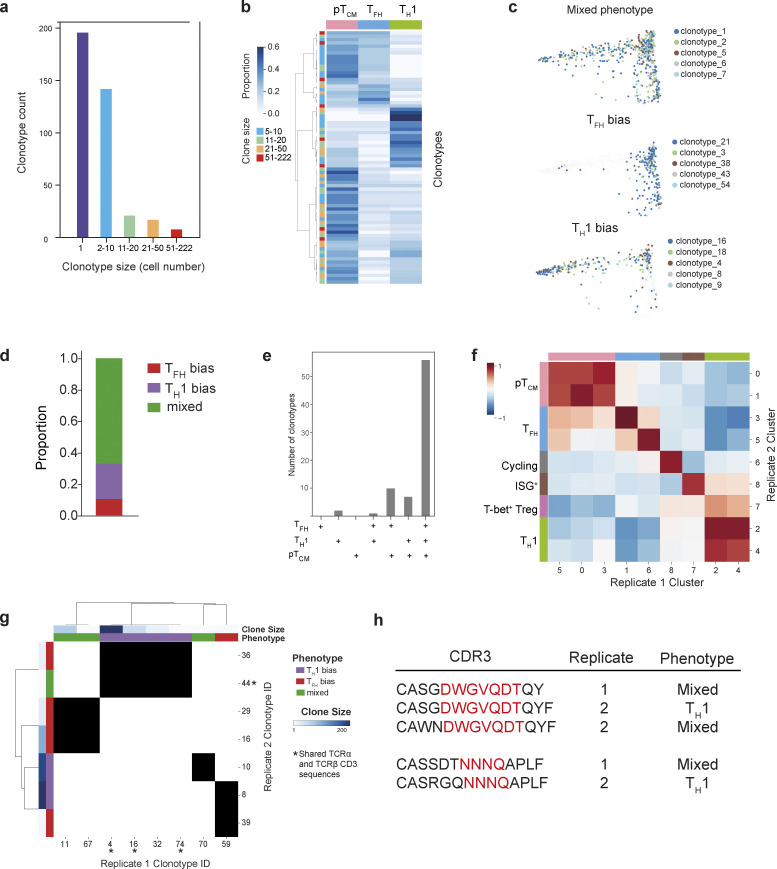
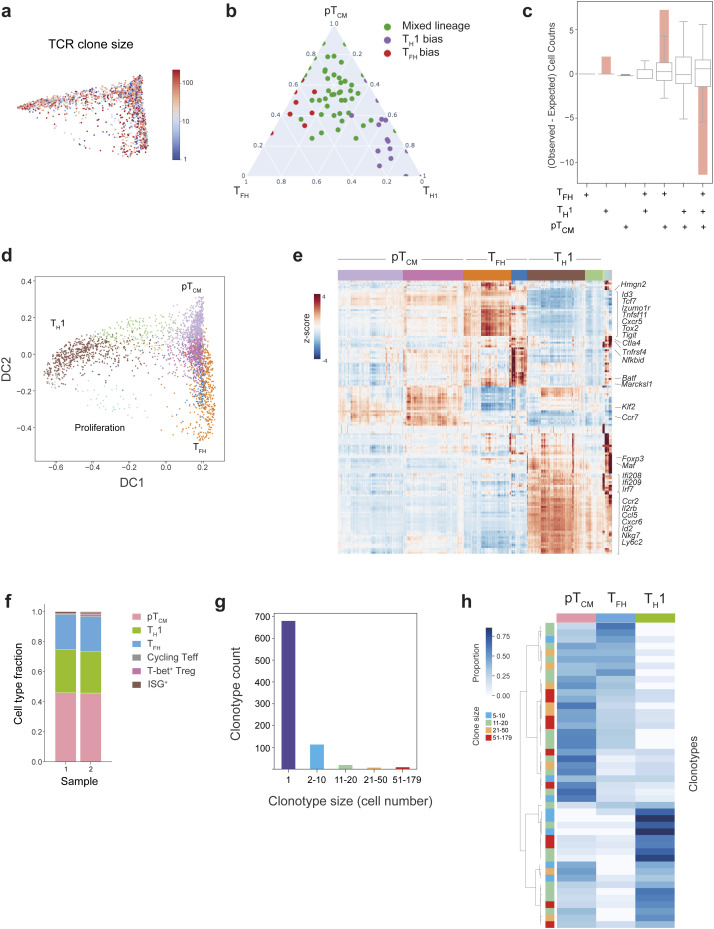
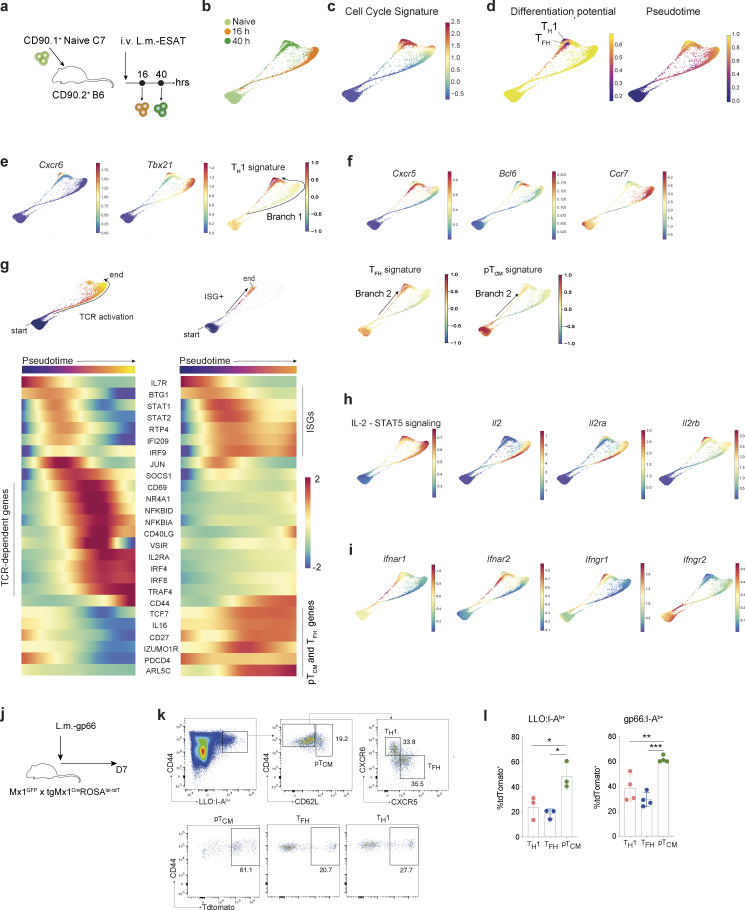
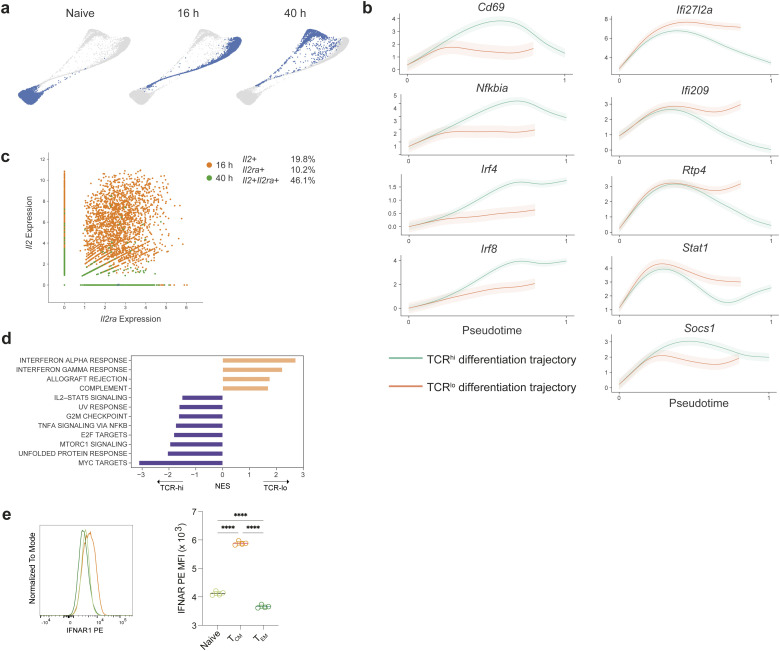
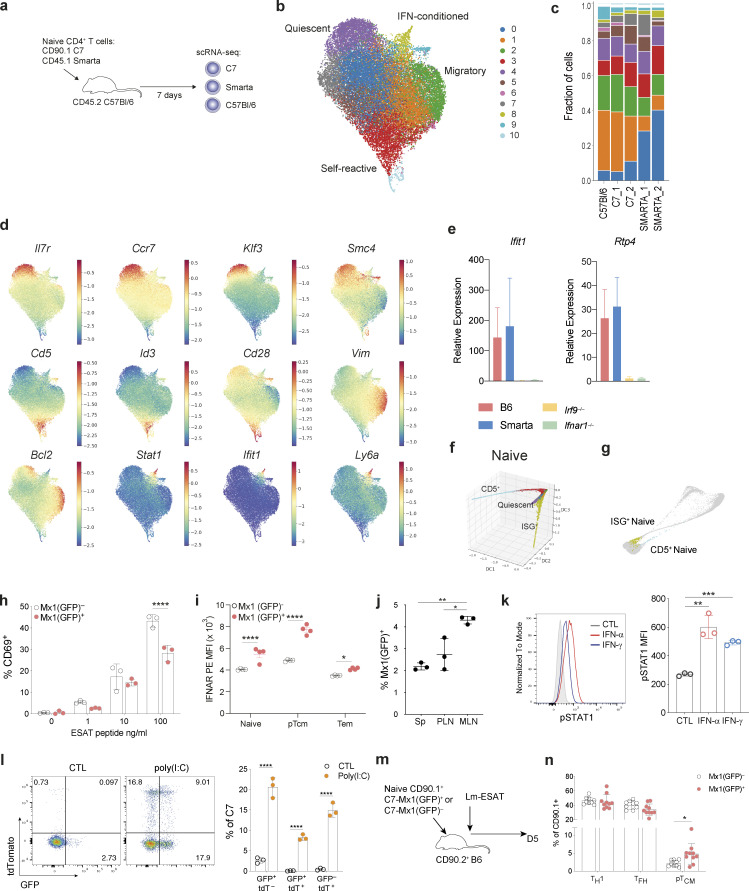
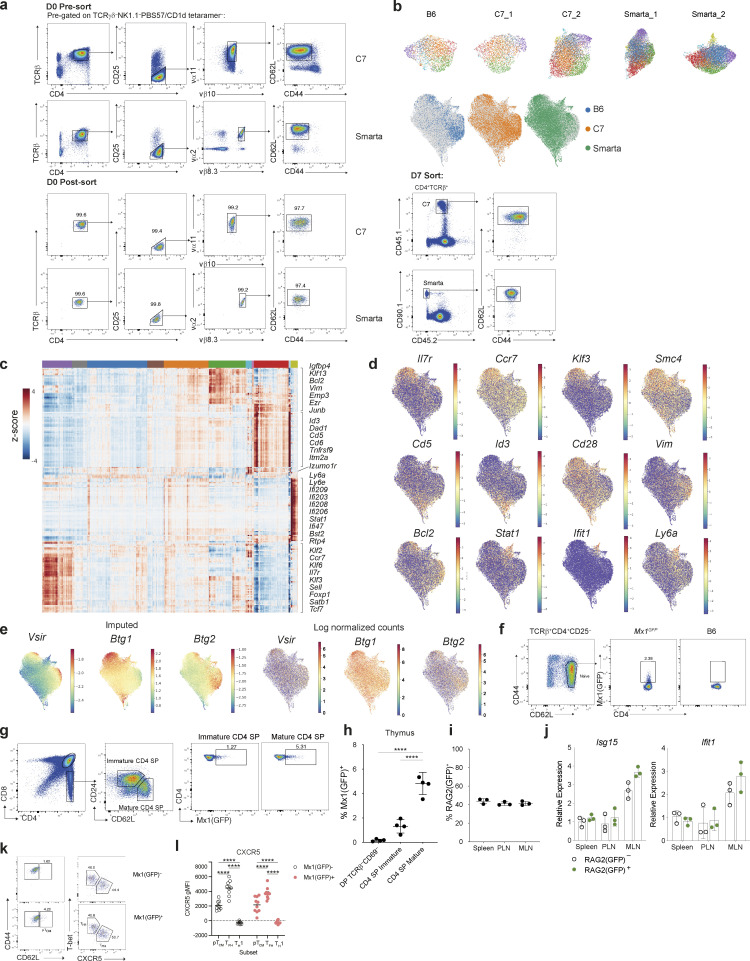
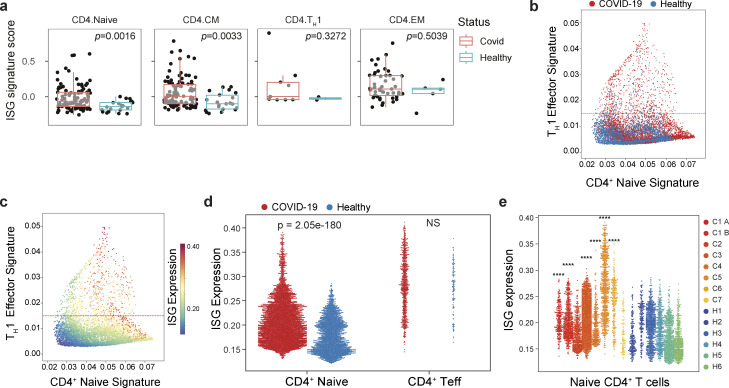
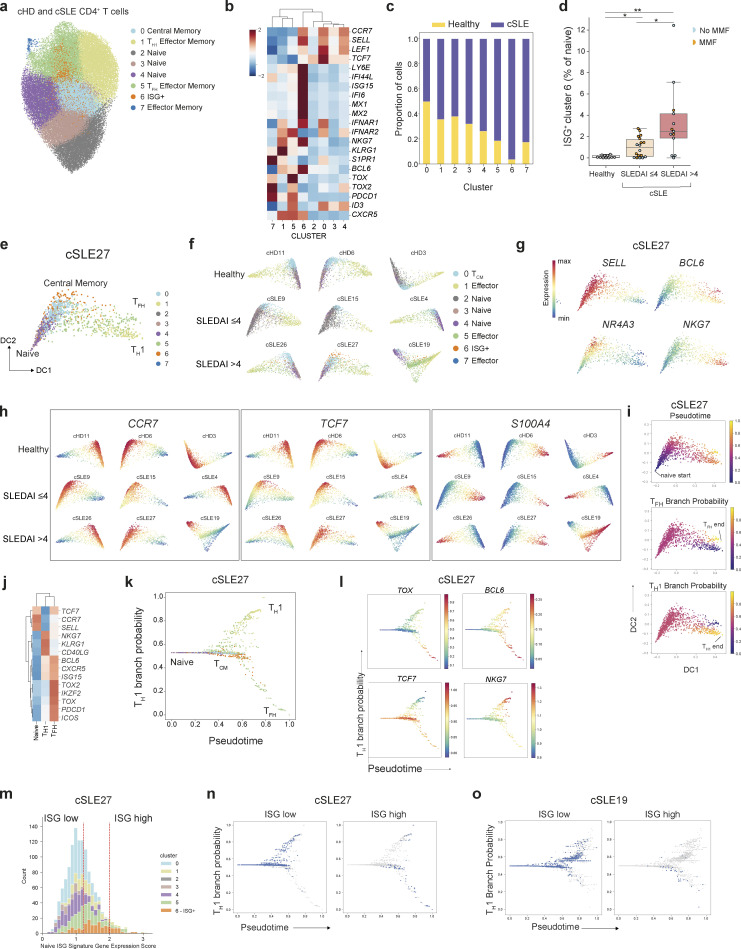
Upon antigenic stimulation, naïve CD4+ T cells can give rise to phenotypically distinct effector T helper cells and long-lived memory T cells. We computationally reconstructed the in vivo trajectory of CD4+ T cell differentiation during a type I inflammatory immune response and identified two distinct differentiation paths for effector and precursor central memory T cells arising directly from naïve CD4+ T cells. Unexpectedly, our studies revealed heterogeneity among naïve CD4+ T cells, which are typically considered homogeneous save for their diverse T cell receptor usage. Specifically, a previously unappreciated population of naïve CD4+ T cells sensing environmental type I IFN exhibited distinct activation thresholds, suggesting that naïve CD4+ T cell differentiation potential may be influenced by environmental cues. This population was expanded in human viral infection and type I IFN response-lined autoimmunity. Understanding the relevance of naïve T cell heterogeneity to beneficial and maladaptive T cell responses may have therapeutic implications for adoptive T cell therapies in cancer immunotherapy and vaccination.


Conflict of interest statement

Disclosures: Z.-M. Wang reported personal fees from Genentech outside the submitted work. V. Pascual reported grants from Sanofi Pasteur, and personal fees from Merck, Moderna, Regeneron, and Novartis outside the submitted work. D. Pe’er reported personal fees from the Insitro Scientific Advisory Board outside the submitted work. A.Y. Rudensky serves as an SAB member of Vedanta Biosciences, Santa Ana Bio, BioInvent, Amgen, and Odyssey Therapeutics, and holds IP for Treg depletion cancer immunotherapy, which are unrelated to the content of this publication. No other disclosures were reported.

Figures

Figure 1.
Figure 1.
Effector memory CD4+ T cell heterogeneity during acute bacterial infection. (a) Strategy to isolate wild-type gp66:I-Ab+ CD4+ T cells for scRNA-seq, 7 days after infection with L.m.-gp66. (b) UMAP of 2964 gp66:I-Ab-specific CD4+ T cells colored by Phenograph clusters and annotated by inferred CD4+ T cell effector/memory lineage. (c) UMAP overlaid with imputed expression of canonical TFH, TH1, or TCM genes. (d) Imputed, log-normalized expression of top 20 DEGs (log2FC > 0.5, FDR < 0.01) for each phenograph cluster shown in Fig. 1 b. Colored bar at the top of the heatmap indicates cluster assignments. (e) Diffusion map of gp66:I-Ab-specific CD4+ T cells using the first two DCs reflecting distinct CD4+ T cell fates. Cells are colored by cluster as in Fig. 1 b.
Figure S1.
Figure S1.
Analysis of CD4+ T cell responses to systemic L.m. infection. Related to Fig. 1. (a) UMAP overlaid with log normalized counts of canonical TFH, TH1, or TCM genes for comparison with imputed expression Fig. 1 c. (b) UMAP overlaid with imputed (left) and log normalized (right) expression of TFH, TH1, or TCM genes. (c) Heatmap showing imputed, log-normalized expression of all DEGs (log2FC > 0.5, FDR < 0.01) identified for each TFH cluster (cluster 6 or cluster 1). The 177 differentially expressed TFH genes shown include the union of DEGs identified in each replicate in one vs. rest comparisons for each TFH cluster. The colored bar at the top of the heatmap shows the assignment of cells to these clusters. (d) UMAP of single-cell transcriptomes from gp66:I-Ab+ CD4+ T cells colored by imputed (left) and log-normalized (right) expression of canonical germinal center TFH genes. (e) UMAP overlaid with the mean expression of genes from the indicated KEGG pathway geneset. (f) Heatmap showing pTCM-specific gene expression. Heatmap shows imputed, log-normalized expression of all DEGs (log2FC > 0.5, FDR < 0.01) in pTCM versus TFH or pTCM versus TH1 comparisons. pTCM, TFH, and TH1 clusters were merged prior to differential gene expression calculation. (g) Diffusion distances between pair-wise comparisons of TFH, TH1, and TCM cells.
Figure 2.
Figure 2.
CD4+ T cell fate is independent of TCR specificity. (a) Frequency and sizes of clonotypes amongst gp66:I-Ab-specific CD4+ T cells. (b) Proportion of cells with a TH1, TFH, or pTCM phenotype for each expanded clonotype (≥5 cells). Each row represents an individual clonotype. Clonotypes are ordered by hierarchical clustering with complete linkage and correlation distance. (c) Diffusion map of gp66:I-Ab+ CD4+ T cells overlaid with the five largest clonotypes for each clonotype-phenotype pattern. (d) Proportion of clonotypes (≥5 cells) exhibiting bias toward a particular TH cell lineage. Clonotypes exhibiting no lineage bias are labeled as “mixed.” (e) Observed number of clonotypes with cells distributed across the TFH, TH1, and TCM phenotypes indicated along the x axis. (f) Shared gene signatures representing TH lineages across two independent experiments identifying matched clusters. Pearson correlation between transcriptomes of replicate gp66:I-Ab-specific CD4+ T cell clusters demonstrating high concordance between independent samples. (g) Shared clonotypes with distinct phenotypes in biological replicate samples. Each depicted clonotype has ≥5 cells and an overlap in TCRα, TCRβ, or paired TCRα/TCRβ sequences across replicate samples. Matching clonotypes between replicate samples indicated by black shading. Shared paired TCRα and TCRβ CDR3 sequences, but distinct phenotypes across replicate samples (clonotype 44 [replicate 2], and clonotypes 4, 74, and 16 [replicate 1]) are indicated by an asterisk. (h) CDR3 sequences and TH lineage bias for clonotypes with a shared TCR specificity group across the two biological replicate samples.
Figure S2.
Figure S2.
Paired TCR and transcriptomic analysis of antigen-specific CD4+ T cell responses to L.m. Related to Fig. 2. (a) Diffusion map of gp66:I-Ab+ CD4+ T cells colored by clone size, showing a similar degree of clonal expansion across TH cell subsets. (b) Clonotypes ≥5 cells were clustered on the basis of their phenotypic distribution using Phenograph. Three distinct phenotypic patterns were identified: TH1 bias, TFH bias, or mixed lineage phenotypes. Ternary plot showing the proportion of TH1, TFH, or pTCM cells for each clonotype. Each dot represents an individual clonotype, colored by its phenotype. (c) Bar graph showing the overrepresentation or underrepresentation (observed–expected counts) of clonotype frequency for each combination of TFH, TH1, and TCM phenotypes with respect to randomized permutations. Box plots indicate the expected clonotype frequencies for each phenotype combination if clones were randomly distributed. The solid pink bars represent the deviation of the observed clonotype frequency for each phenotype combination from the randomized expectation. (d) Diffusion map visualization of single cell transcriptomes from replicate gp66:I-Ab+ CD4+ T cells, colored by their Phenograph cluster identity, illustrating three distinct cell fates: TH1, TFH, and pTCM. (e) Heatmap showing MAGIC imputed, log-normalized expression of top 20 DEGs (log2FC > 0.5, FDR < 0.01), for each Phenograph cluster shown in d. The colored bar at the top of the heatmap shows the assignment of cells to these clusters. (f) Fraction of cells within each effector CD4+ T cell lineage for replicate samples. Equivalent proportions of TH1, TFH, and pTCM cells were observed in two independent experiments. (g) Graph showing frequency and size distribution of clonotypes amongst replicate gp66:I-Ab+ CD4+ T cells. (h) Heatmap demonstrating the proportion of cells within a given clonotype with a TH1, TFH, or pTCM phenotype, for clonotypes ≥5 cells for the replicate gp66:I-Ab+ CD4+ T cell sample. Each row represents an individual clonotype. The color bar on the left indicates clone size. Clonotypes are ordered by hierarchical clustering with complete linkage and correlation distance.
Figure 3.
Figure 3.
Emergence of pTCM from naïve CD4+ T cells. (a) Experimental strategy to study in vivo naïve C7 TCR transgenic CD4+ T cell differentiation during acute L.m.-ESAT infection. (b–i) Force-directed layout, following Harmony normalization, of naïve and effector C7 CD4+ T cells, sampled 16 and 40 h after infection with L.m.-ESAT, and overlaid by different coloring schemes: (b) time of sampling. (c) Expression of a cell cycle (G1/S and G2/M) gene signature (d) Palantir differentiation potential (left panel) and pseudotime (right panel) using a quiescent (Ccr7hiIl7rhi) naïve start cell, demonstrating two regions of reduced differentiation potential that indicate lineage specification and commitment. (e) Expression of genes associated with TH1 CD4+ T cell lineage and average expression of TH1 signature genes with delineation of a proposed Branch 1. (f) Expression of genes associated with TFH or pTCM CD4+ T cell lineages and average expression of TFH or pTCM signature genes with delineation of a proposed Branch 2 (g) Pseudotemporal ordering of alternative differentiation trajectories for naïve CD4+ T cells, showing selected start and end points on the force directed layouts (top panels). Heatmaps depict inferred temporal gene expression trends along the two differentiation pathways; left represents cells with high TCR signaling-dependent gene expression (“TCR-hi”), right represents “TCR-lo” pTCM differentiation. (h) Force-directed layouts colored by expression of genes associated with IL-2 -STAT5 signaling. (i) Type I IFN and IFN-γ receptor gene expression, overlaid on CD4+ T cell force-directed layout. (j) C7 × Mx1GFP × tgMx1CreRosa26lsl-tdT mice were infected with L.m.-gp66 and analyzed 7 days post infection (dpi). (k) Representative flow cytometric analysis of Listeriolysin O (LLO) peptide-specific CD4+ T cells demonstrating increased proportion of Mx1 fate-mapped cells amongst CD62L+ pTCM cells. (l) Proportion of LLO:I-Ab- (left) and gp66:I-Ab-specific effector memory CD4+ T cell subsets that are Mx1 fate-mapped. Each symbol represents an individual mouse (l). Data from one of two experiments (l) Error bars: means ± SEM of replicates. Statistical significance determined by one-way ANOVA (l); *P < 0.05; **P < 0.01; ***P < 0.001.
Figure S3.
Figure S3.
Pseudotemporal analysis of CD4+ T cell fates during L.m. infection. Related to Fig. 3. (a) Force-directed layout depicting the developmental relationship between C7 CD4+ naïve and effector T cells during infection with L.m.-ESAT. Cells are colored by sampling time point after infection. (b) Gene expression trends along the two branches of T effector/memory differentiation. Cells exhibiting low levels of TCR-dependent genes (“TCR-lo”) exhibit sustained expression of ISGs. (c) Unimputed log normalized expression of Il2 and Il2ra for individual C7 effectors profiled at 16 and 40 h post activation, demonstrating coexpression of these two genes. Each dot represents an individual cell colored by the time-point of sampling. Percentages of cells expressing Il2, Il2ra, or both are listed on the right. (d) Enrichment of MsigDB Hallmark pathways in “TCR-lo” (pTCM) versus “TCR-hi” (effector) differentiation branches. (e) Histogram of IFNAR1 staining of naïve CD4+ T cells, TCM and TEM (left) and quantification (right). Representative of two independent experiments. Statistical significance determined by one-way ANOVA; ****P < 0.0001.
Figure 4.
Figure 4.
Naïve CD4+ T cell heterogeneity. (a) Experimental strategy for profiling splenic naïve CD4+ T cells. TCRγδPBS57/CD1d tetramerNK1.1TCRβ+CD4+CD25CD44loCD62Lhi cells, were sorted from the spleen of C7 or Smarta tgTCR mice and adoptively transferred into CD45.2 B6 recipients. After 7 days, naïve host B6 and tgTCR CD4+ T cells were isolated and profiled by scRNA-seq. (b) UMAP visualization of 28,146 naïve CD4+ T cells, colored by Phenograph cluster. (c) Fraction of cells within each naïve CD4+ T cell cluster detected across strains and biological replicate samples colored by Phenograph cluster as shown in Fig. 1 b. C57Bl/6, 3,026 cells; C7_1, 2,675 cells; C7_2, 6,159 cells; Smarta_1, 7,834 cells; Smarta_2, 8,452 cells. (d) UMAP colored by MAGIC imputed expression of cluster-defining genes. (e) Quantitative real-time PCR analysis of ISGs in bulk splenic naïve CD4+ T cells from B6, Smarta, Irf9−/−, or Ifnar1−/− mice. (f) Naïve T cells, as shown in Fig. 4 b, visualized using diffusion map embedding of the first three DCs, with distinctive ISG+, quiescent, and CD5+ “self-reactive” cells labeled. Cells colored by Phenograph cluster as in Fig. 4 b. (g) Cells in the ISG+ naïve CD4+ T cell cluster (cluster 8, Fig. 4 b) and CD5+ naïve cells (cluster 10, Fig. 4 b), highlighted in distinct differentiation trajectories of early CD4+ T cell differentiation from Fig. 3 g. (h) Proportion of CD69+ cells among naïve C7 CD4+ T cells cultured for 36 h with irradiated T cell–depleted splenocytes (as antigen-presenting cells) and limiting concentrations of ESAT peptide. (i) IFNAR1 mean fluorescence intensity (MFI) on Mx1(GFP)+ versus Mx1(GFP) populations in uninfected mice. (j) Mx1(GFP)+ naïve CD4+ T cells are present in all lymphoid tissues, with varying frequencies across anatomically distinct LNs; PLN and MLN. (k) Representative MFI (histogram) (left) and summary bar graph (right) showing expression of pSTAT1 in sort-purified naïve Smarta CD4+ T cells treated in vitro with IFN-α or IFN-β for 4 h. (l) Naïve tdTomatoGFP CD4+ T cells from C7 × Mx1GFP × tgMx1CreRosa26lsl-tdT mice were adoptively transferred into congenic B6 mice, administered the following day with poly(I:C) i.p. Representative flow cytometry plot showing expression of tdTomato and GFP in transferred splenic C7 naïve CD4+ T cells, 4 days after treatment (left) and quantification (right). (m) Mx1(GFP)+ or Mx1(GFP) naïve C7 CD4+ T cells were adoptively transferred into congenic B6 mice, subsequently infected intravenously with L.m.-ESAT and analyzed at 5 dpi. (n) Proportion of splenic pTCM (CD62L+), TH1 (T-bet+CXCR5), and TFH (T-betCXCR5+) T cells amongst transferred C7 T cells at 5 dpi. Results are from one experiment representative of 4 (j), 3 (m and n), 2 (e, i, k, and l) independent experiments with n = 3 (e, j, and l), n = 4 (i), n = 9 (n) mice per group and three replicate wells in h and k. Statistical significance by two-way ANOVA (h, i, and l); one-way ANOVA (j and k); unpaired t test (n); *P < 0.05; **P < 0.01; ***P < 0.001; ****P < 0.0001. Error bars: means ± SEM.
Figure S4.
Figure S4.
Characterization of naïve CD4+ T cell heterogeneity. Related to Fig. 4. (a) Representative flow cytometry showing sorting strategy for isolation of naïve CD4+ Smarta or C7 cells on day 0, prior to transfer into CD45.2 recipient mice (upper and middle panel). On day 7 after transfer, tgTCR T cells and host B6 naïve CD4+CD25CD44loCD62Lhi T cells were sorted for scRNA-seq analysis (right panel). At day 7, tgTCR T cells retained their naïve cell surface phenotype. (b) Top: UMAP visualization of individual naive CD4+ T cell replicate samples, each colored by their collective Phenograph clustering from Fig. 4 b performed after batch-correction. Bottom: UMAP colored by donor cell origin sorted according to a: B6 (blue) from one donor mouse, C7 (orange) and SMARTA (green) each from two donor mice. (c) Heatmap showing imputed expression of top 50 DEGs across splenic naïve T cell clusters (log2FC > 0.5, FDR < 0.01). The colored bar at the top of the heatmap shows the assignment of cells to clusters labeled in Fig. 4 b. Genes of interest are shown on the right. (d) Log-normalized expression values for comparison with imputed expression Fig. 4 d. (e) UMAP of naïve CD4+ T cells colored by imputed (left) or log normalized (right) expression of genes implicated in maintenance of naïve T cell quiescence. (f) Representative flow cytometry of naïve CD4+ T cells from the spleen (Sp) of Mx1GFP mice. (g) Representative flow cytometry demonstrating gating strategy for analysis of CD4+ thymocyte populations from Mx1(GFP)+ mice. (h) Summary graph showing frequency of Mx1+ cells for each thymocyte population gated in g. Increased frequency of Mx1+ cells is observed as cells undergo progressive maturation from CD4+CD8+ DP thymocytes to mature single positive (SP) CD4+ T cells. Representative of two independent experiments, n = 4. Statistical significance was determined by one-way ANOVA; ****P < 0.0001. (i) Frequency of RAG2(GFP)+ cells within PLN, MLN, or spleen. (j) Expression of indicated ISGs in RAG2(GFP)+ or RAG2(GFP) naïve T cells, determined by qPCR. Representative of two independent experiments of n = 3. (k) Representative flow cytometric analysis of immune cell composition within the spleen of recipient mice, 5 days after infection, demonstrating frequency of pTCM (CD62L+), TH1 (T-bet+CXCR5), and TFH (T-betCXCR5+) cells amongst transferred C7 T cells. (l) CXCR5 geometric MFI (gMFI) in T cell subsets from k. Representative of two independent experiments. Statistical significance determined by two-way ANOVA; ****P < 0.0001.
Figure 5.
Figure 5.
Type I IFN signaling in naïve CD4+ T cells in COVID-19. (a) ISG expression in patients with acute severe COVID-19 (Stephenson et al., 2021). ISG signature scores were averaged within each subset for each sample, with only samples having >10 cells for a particular CD4+ subset (central memory [CM], effector memory [EM], naïve, TH1) being used. Differential ISG signature score values between COVID-19 and healthy samples were assessed by a two-sided Wilcoxon rank-sum test. (COVID-19, n = 101; healthy control, n = 21). (b–e) ISG expression (as in Fig. 4 b) in patients with acute severe COVID-19 (Wilk et al., 2020). (b and c) Scatter plot of peripheral blood CD4+ T cell transcriptomes from healthy donors (H1–H6) or patients with acute severe COVID-19 (C1–C7). Each dot represents a cell, plotted by mean expression of the top 50 signature naïve T cell (x-axis) and TH1 effector genes, 6 days after viral infection (y-axis) and overlaid with disease status (b) or ISG signature expression (c). Cells above the dashed line representing the 10th percentile are considered effector T cells; cells below are considered naïve. (d) Naïve CD4+ T cell signature ISG genes (as in Fig. 4 b) are expressed higher amongst naïve CD4+ T cells, defined in Fig. 5 c, in patients with COVID-19 compared with healthy controls. (e) ISG signature gene expression in naïve CD4+ T cells for each individual patient and healthy control. Statistical significance by nonparametric Mann–Whitney U test between total COVID and total healthy populations (d), and between the individual COVID patient and total healthy populations (e); ****P < 0.0001.
Figure 6.
Figure 6.
Type I IFN signaling in naïve CD4+ T cells in SLE. (a) UMAP visualization of 55,072 peripheral blood CD4+ T cells from 11 healthy children and 33 pediatric SLE patients. (b) Scaled expression of T cell lineage genes within clusters shown in a. (c) Proportion of healthy donor or cSLE derived cells in each cluster. (d) Proportion of cluster 6 ISG+ cells amongst naïve CD4+ T cells across healthy donors and cSLE patients, grouped according to low (SLEDAI ≤ 4) or high (SLEDAI > 4) disease activity. Two patients with an incomplete SLEDAI assessment were excluded from this analysis. (e) Diffusion map visualization of CD4+ T cells from an individual cSLE patient (cSLE_27) with high disease activity, colored by their cluster identity. (f) Individual diffusion maps from three representative healthy controls, three representative patients with low disease activity (SLEDAI ≤ 4) or three representative patients with high disease activity (SLEDAI > 4). (g) Diffusion map visualization of CD4+ T cells from an individual cSLE patient (cSLE_27) with high disease activity, colored by their expression of T cell lineage genes. (h) Individual diffusion maps (as in f) colored by imputed expression of indicated genes. (i) Palantir pseudotime and branch probabilities illustrating two differentiation trajectories from naïve to TH1 or TFH cells. (j) Heatmap showing scaled expression of T cell lineage genes across the naïve and terminal effector memory cell states identified in e. (k and l) Reconstruction of effector T cell differentiation for patient cSLE27. TH1 branch probability across pseudotime, with cells (dots) colored by cluster identity (k), expression of T cell lineage genes (l). (m) Distribution of expression of mean ISG signature score for each cluster (as in Fig. 4 b) from patient cSLE_27. Cells below the 60th percentile were classified as “ISG-low,” and cells in the top 5% were labeled as “ISG-high.” (n) TH1 branch probability across pseudotime, with cells (dots) colored by level of ISG expression, for an individual patient, cSLE_27. ISG-low cells adopt a TH1 effector memory phenotype, whereas high levels of ISG expression are associated with a TCM or TFH memory phenotype. (o) TH1 branch probability across pseudotime, with cells (dots) colored by level of ISG expression, for an individual patient, cSLE_19. Statistical significance determined by Mann–Whitney test (d); *P < 0.05; **P < 0.01.
Figure S5.
Figure S5.
Validation of parameters for scRNA-seq analysis of CD4+ T cells. Related to Figs. 1, 2, 3, and 4. (a–d) Related to Figs. 1 and 2. Degree of overlap measured by adjusted Rand index between Phenograph clustering in gp66:I-Ab+ CD4+ T cell replicates with varying input number of PCs (a and b) and k (c and d). (e–h) Related to Fig. 3. Validation of imputation and diffusion mapping for C7 differentiation during acute L.m.-ESAT infection. Average Pearson correlation per gene of MAGIC imputed expression values with varying input ka (e) and t parameters (f). (g) Average Pearson correlation distance per gene between successive applications of the MAGIC diffusion operator indicated by t. (h) Pearson correlation in cell–cell diffusion distances calculated for C7 differentiation dataset with varying numbers of diffusion components (DCs). (i–k) Related to Fig. 4. Validation of naïve CD4+ T cell batch-correction, clustering, and imputation. (i) Heatmap showing the overlap coefficient of DEGs recovered in each individual replicate sample after Phenograph clustering (20PCs, k = 30) followed by one-vs-rest cluster comparisons performed with MAST (log2FC > 0.5, FDR < 1e-10). (j) Heatmap showing the degree of overlap measured by the adjusted Rand index between clustering in individual samples using varying numbers of HVGs as compared with clustering in individual samples using all expressed genes. (k) Pearson correlation between average cluster expression profiles calculated separately in each individual sample. Colored bars at the top and sideshow the collective Phenograph clustering assignment of each profile. (l–p) Related to Fig. 4. Validation of clustering and imputation for naïve CD4+ T cell dataset. (l and m) Degree of overlap measured by adjusted Rand index between Phenograph clustering on the combined batch-corrected naïve T cell dataset with varying input number of PCs (l) and k (m). (n and o) Average Pearson correlation per gene of MAGIC imputed expression values with varying input ka (n) and t (o) parameters. (p) Average Pearson correlation distance per gene between successive applications of the MAGIC diffusion operator indicated by t.

References

    1. Andreatta, M., Tjitropranoto A., Sherman Z., Kelly M.C., Ciucci T., and Carmona S.J.. 2022. A CD4+ T cell reference map delineates subtype-specific adaptation during acute and chronic viral infections. Elife. 11:e76339. 10.7554/eLife.76339 - DOI - PMC - PubMed
    1. Azizi, E., Carr A.J., Plitas G., Cornish A.E., Konopacki C., Prabhakaran S., Nainys J., Wu K., Kiseliovas V., Setty M., et al. . 2018. Single-cell map of diverse immune phenotypes in the breast tumor microenvironment. Cell. 174:1293–1308.e36. 10.1016/j.cell.2018.05.060 - DOI - PMC - PubMed
    1. Azzam, H.S., Grinberg A., Lui K., Shen H., Shores E.W., and Love P.E.. 1998. CD5 expression is developmentally regulated by T cell receptor (TCR) signals and TCR avidity. J. Exp. Med. 188:2301–2311. 10.1084/jem.188.12.2301 - DOI - PMC - PubMed
    1. Baldridge, M.T., King K.Y., Boles N.C., Weksberg D.C., and Goodell M.A.. 2010. Quiescent haematopoietic stem cells are activated by IFN-gamma in response to chronic infection. Nature. 465:793–797. 10.1038/nature09135 - DOI - PMC - PubMed
    1. Ballesteros-Tato, A., León B., Graf B.A., Moquin A., Adams P.S., Lund F.E., and Randall T.D.. 2012. Interleukin-2 inhibits germinal center formation by limiting T follicular helper cell differentiation. Immunity. 36:847–856. 10.1016/j.immuni.2012.02.012 - DOI - PMC - PubMed

Substances