. 2024 Sep 25;16(766):eadn1285.
doi: 10.1126/scitranslmed.adn1285. Epub 2024 Sep 25.

Spermidine metabolism regulates leukemia stem and progenitor cell function through KAT7 expression in patient-derived mouse models

Affiliations

Spermidine metabolism regulates leukemia stem and progenitor cell function through KAT7 expression in patient-derived mouse models

Vincent Rondeau et al. Sci Transl Med. .

Abstract

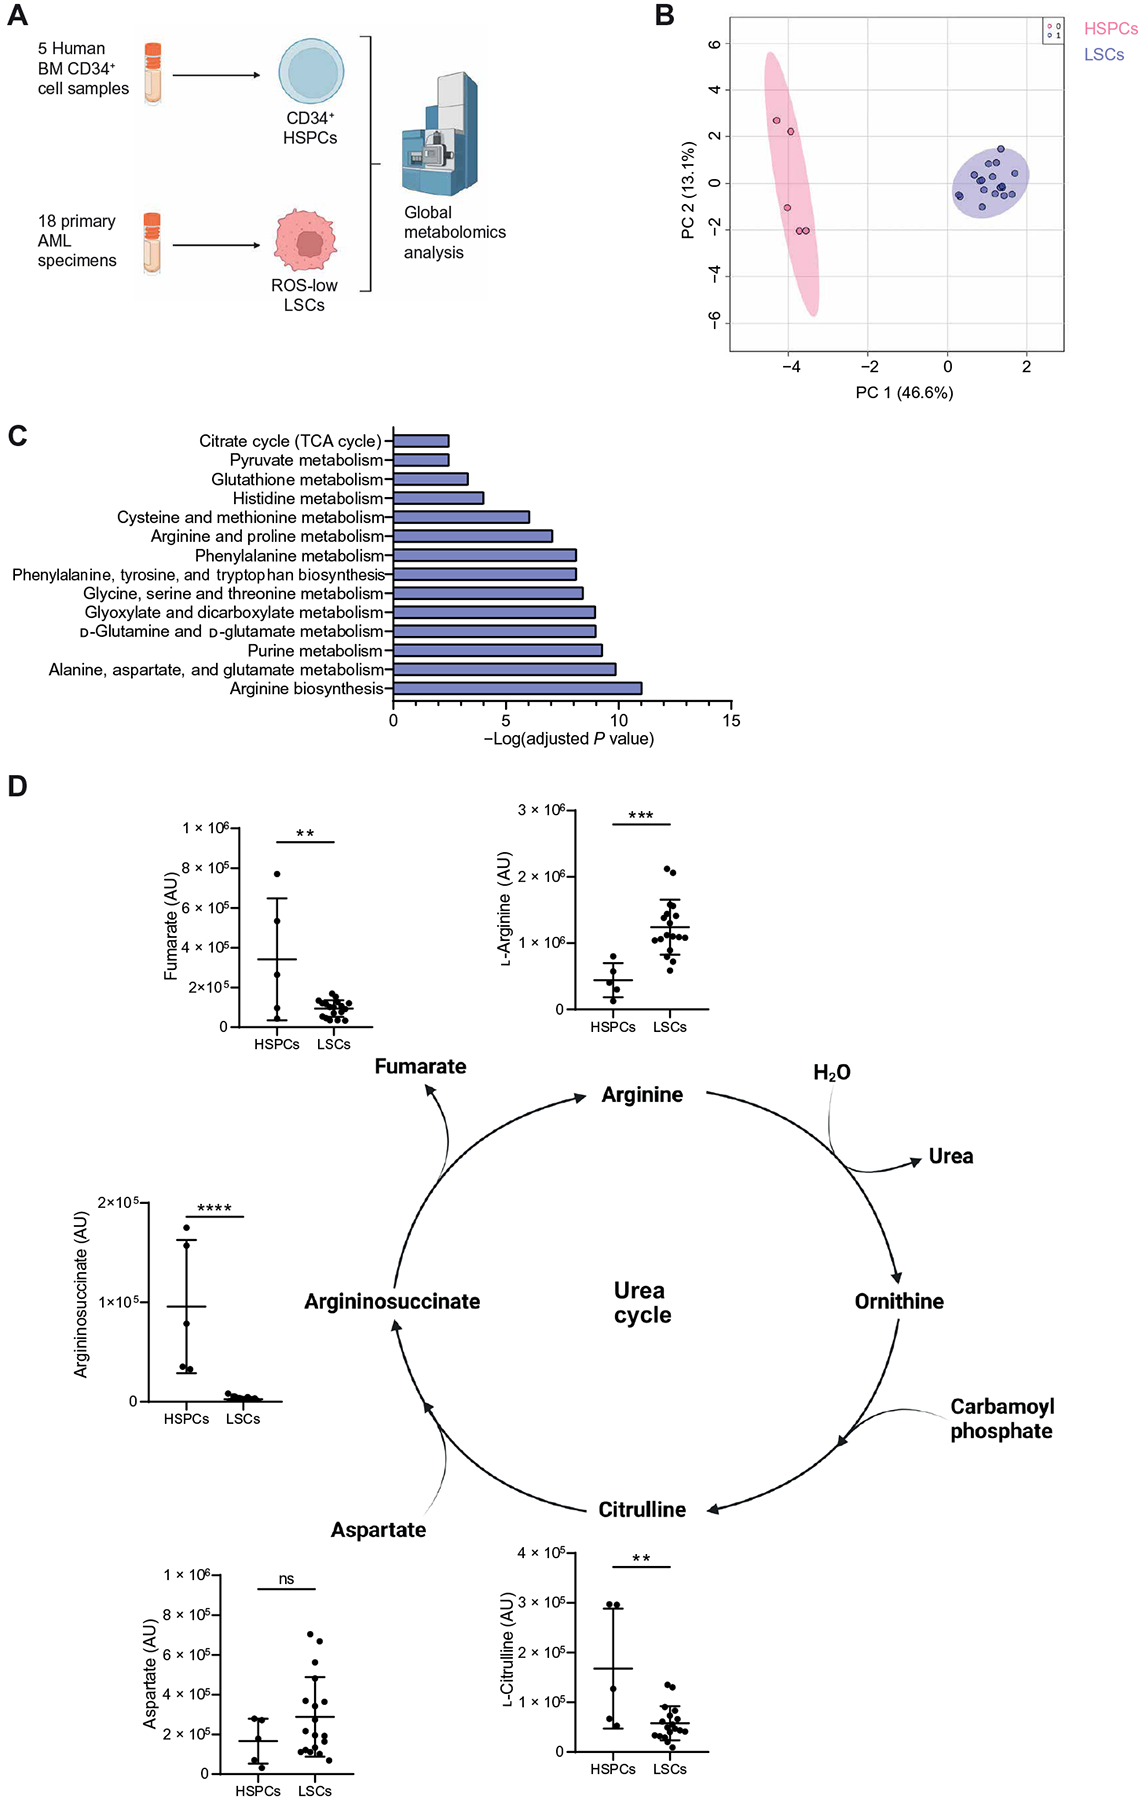
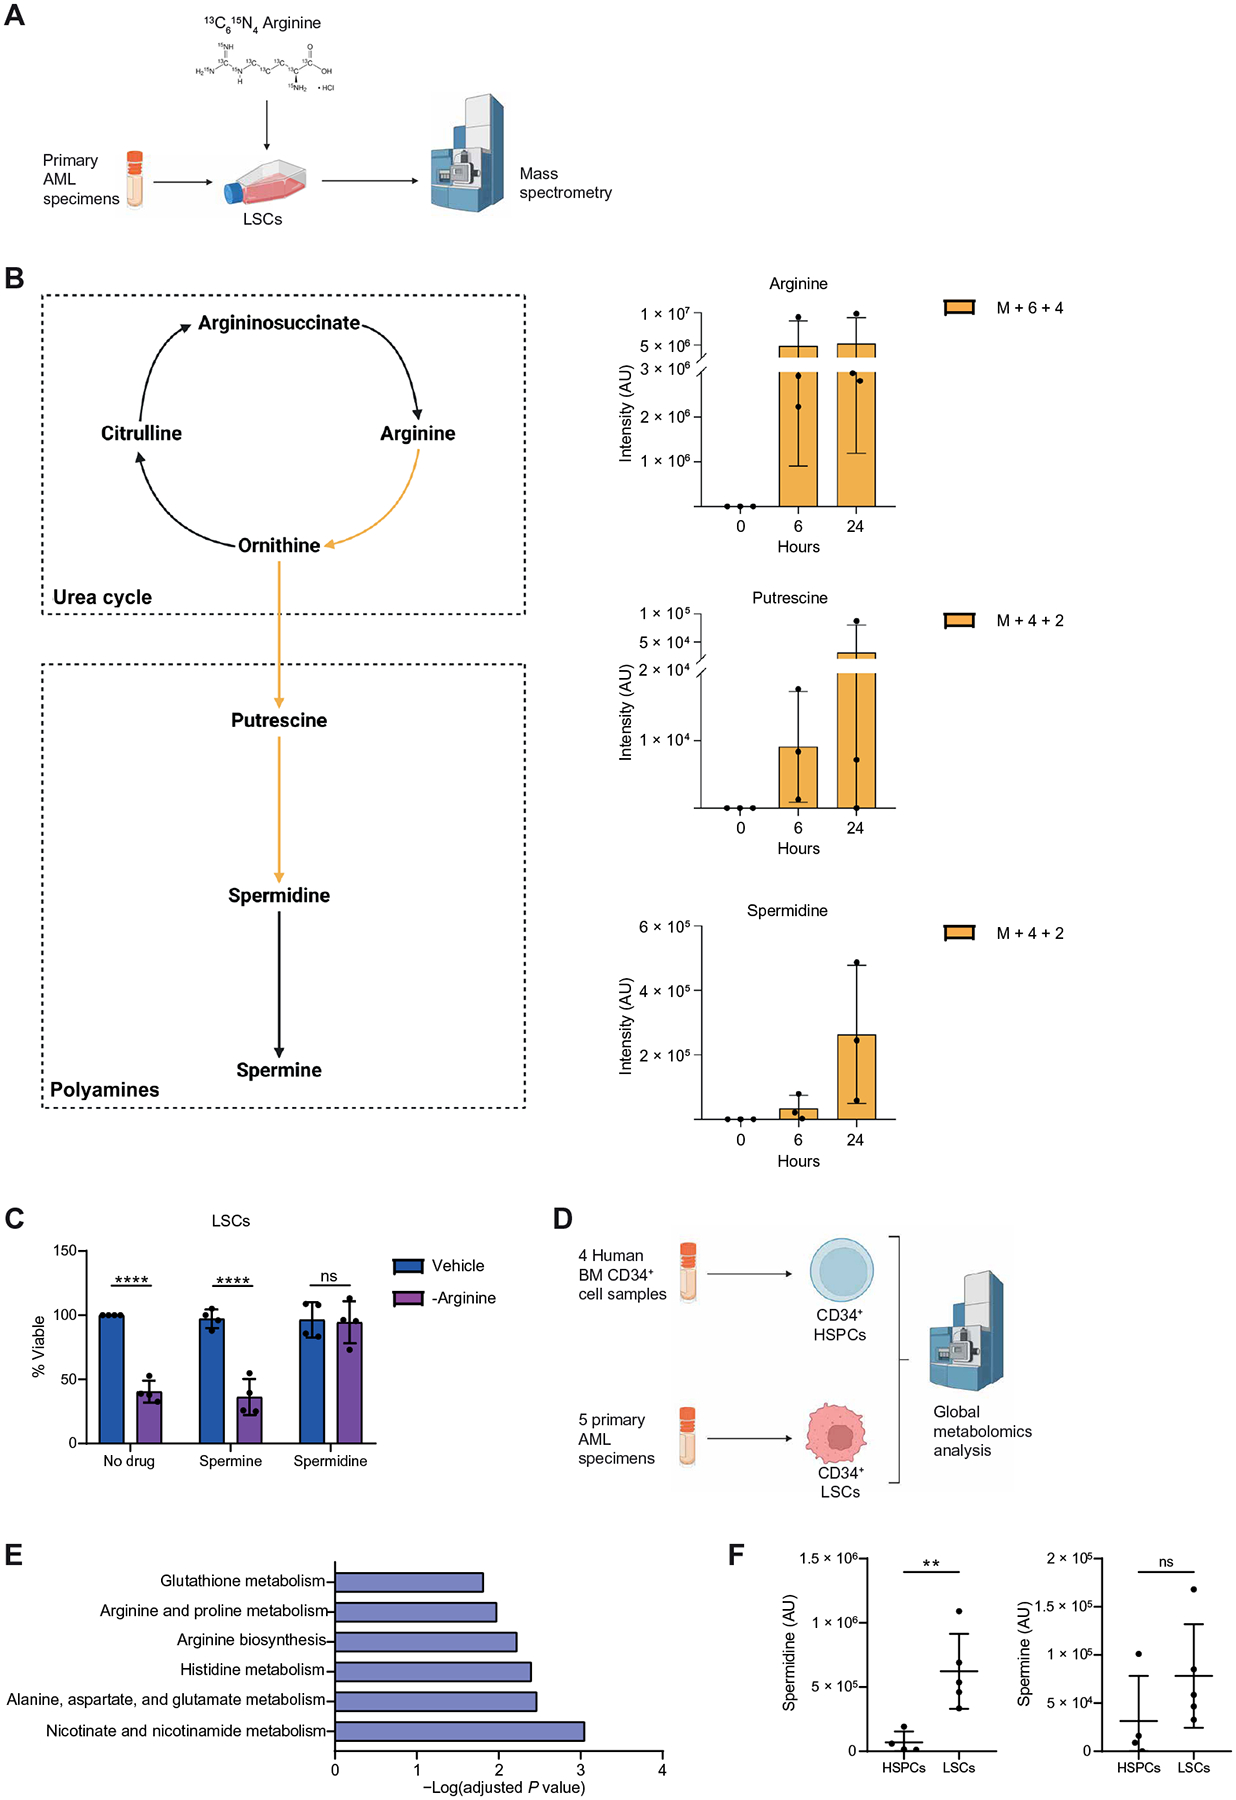
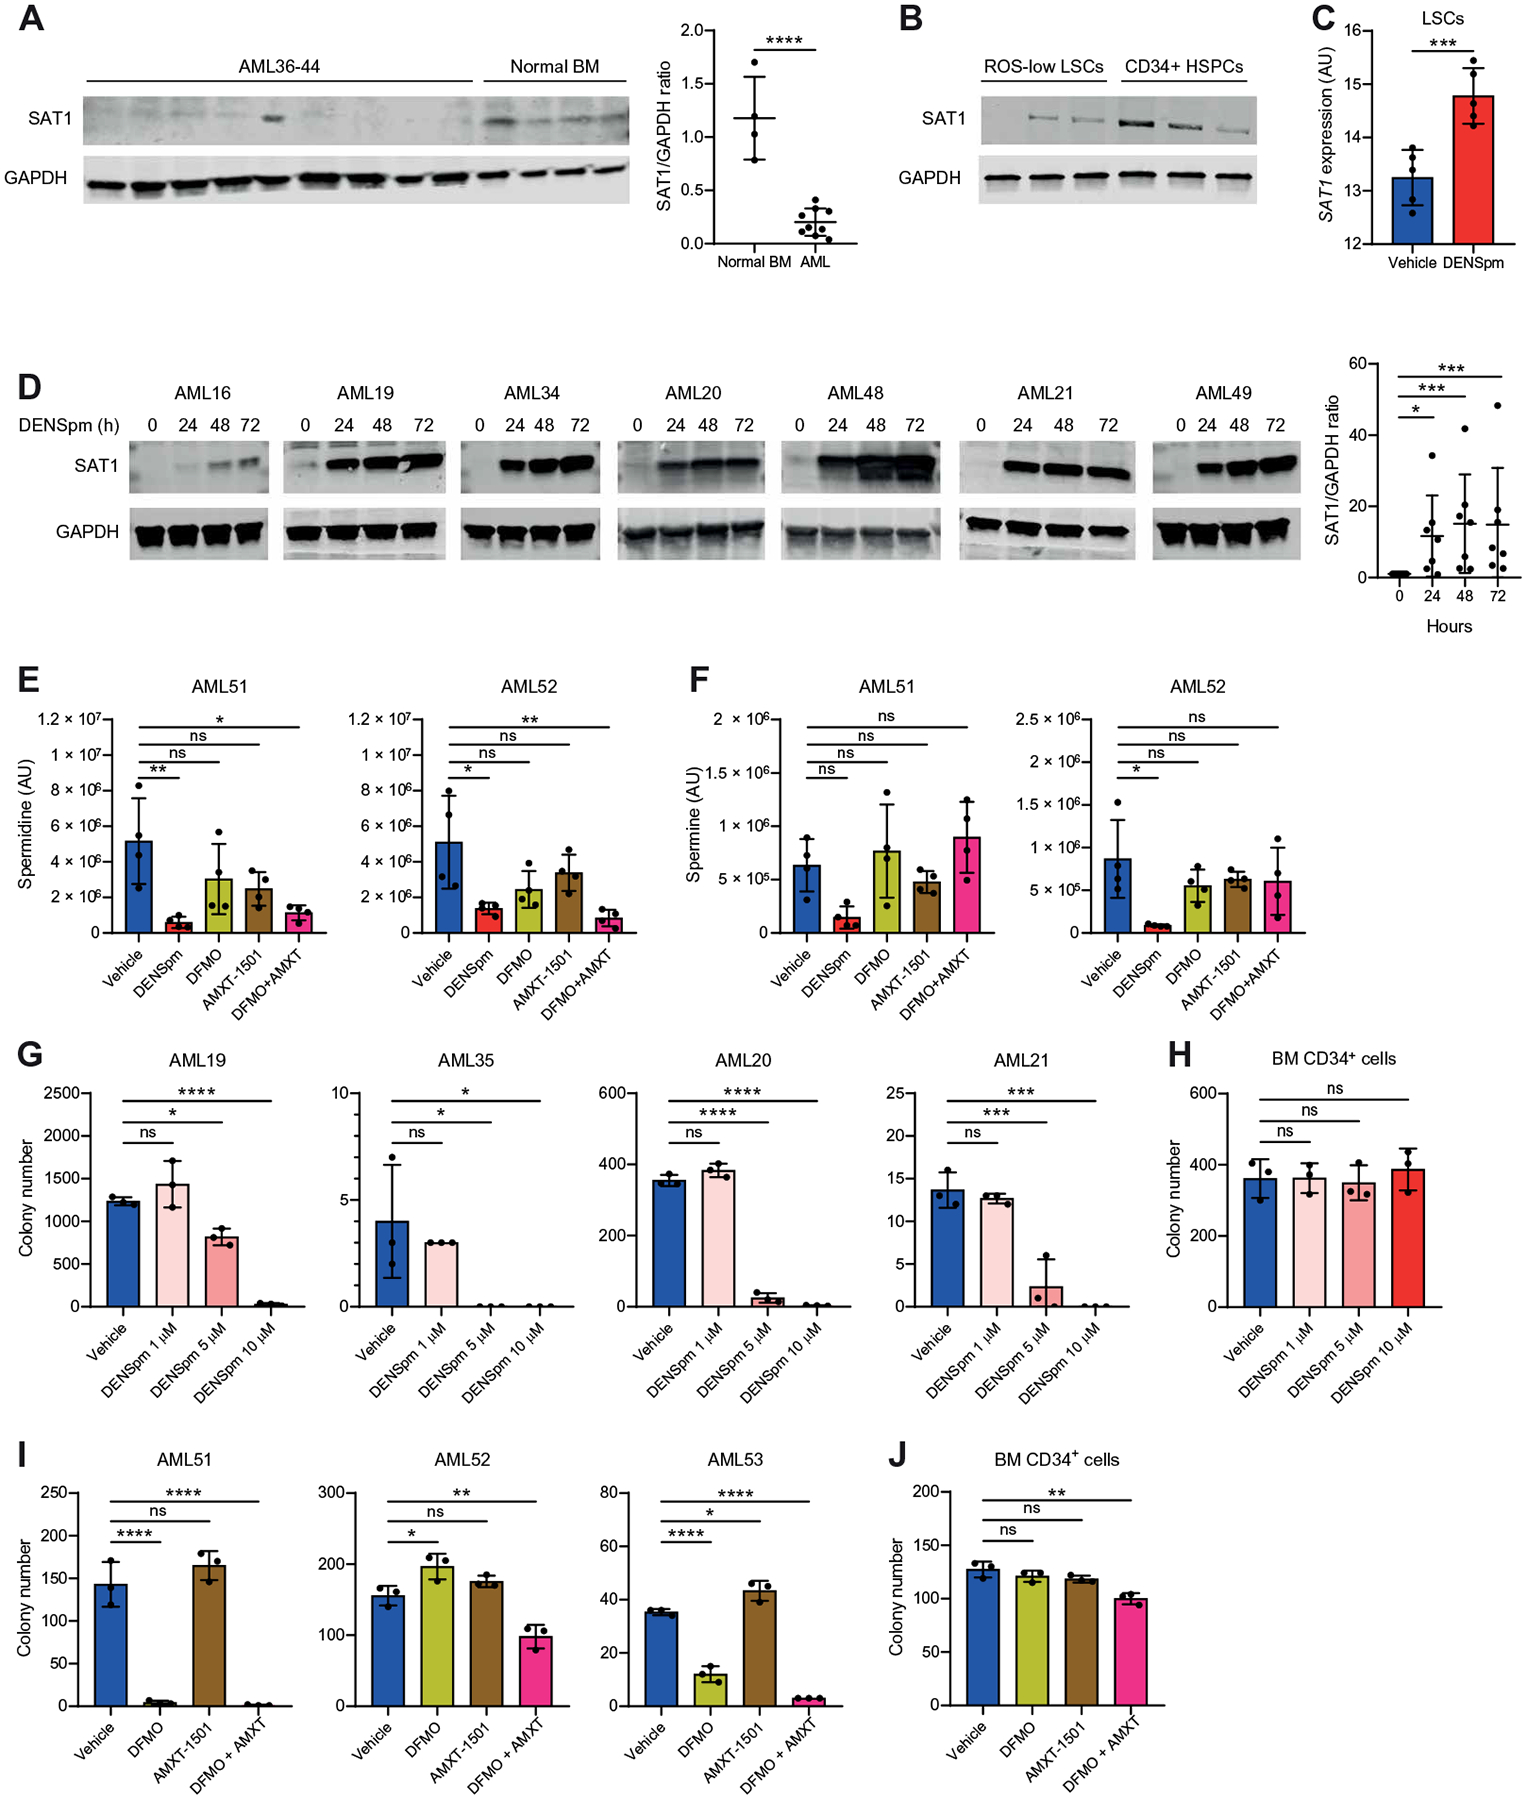
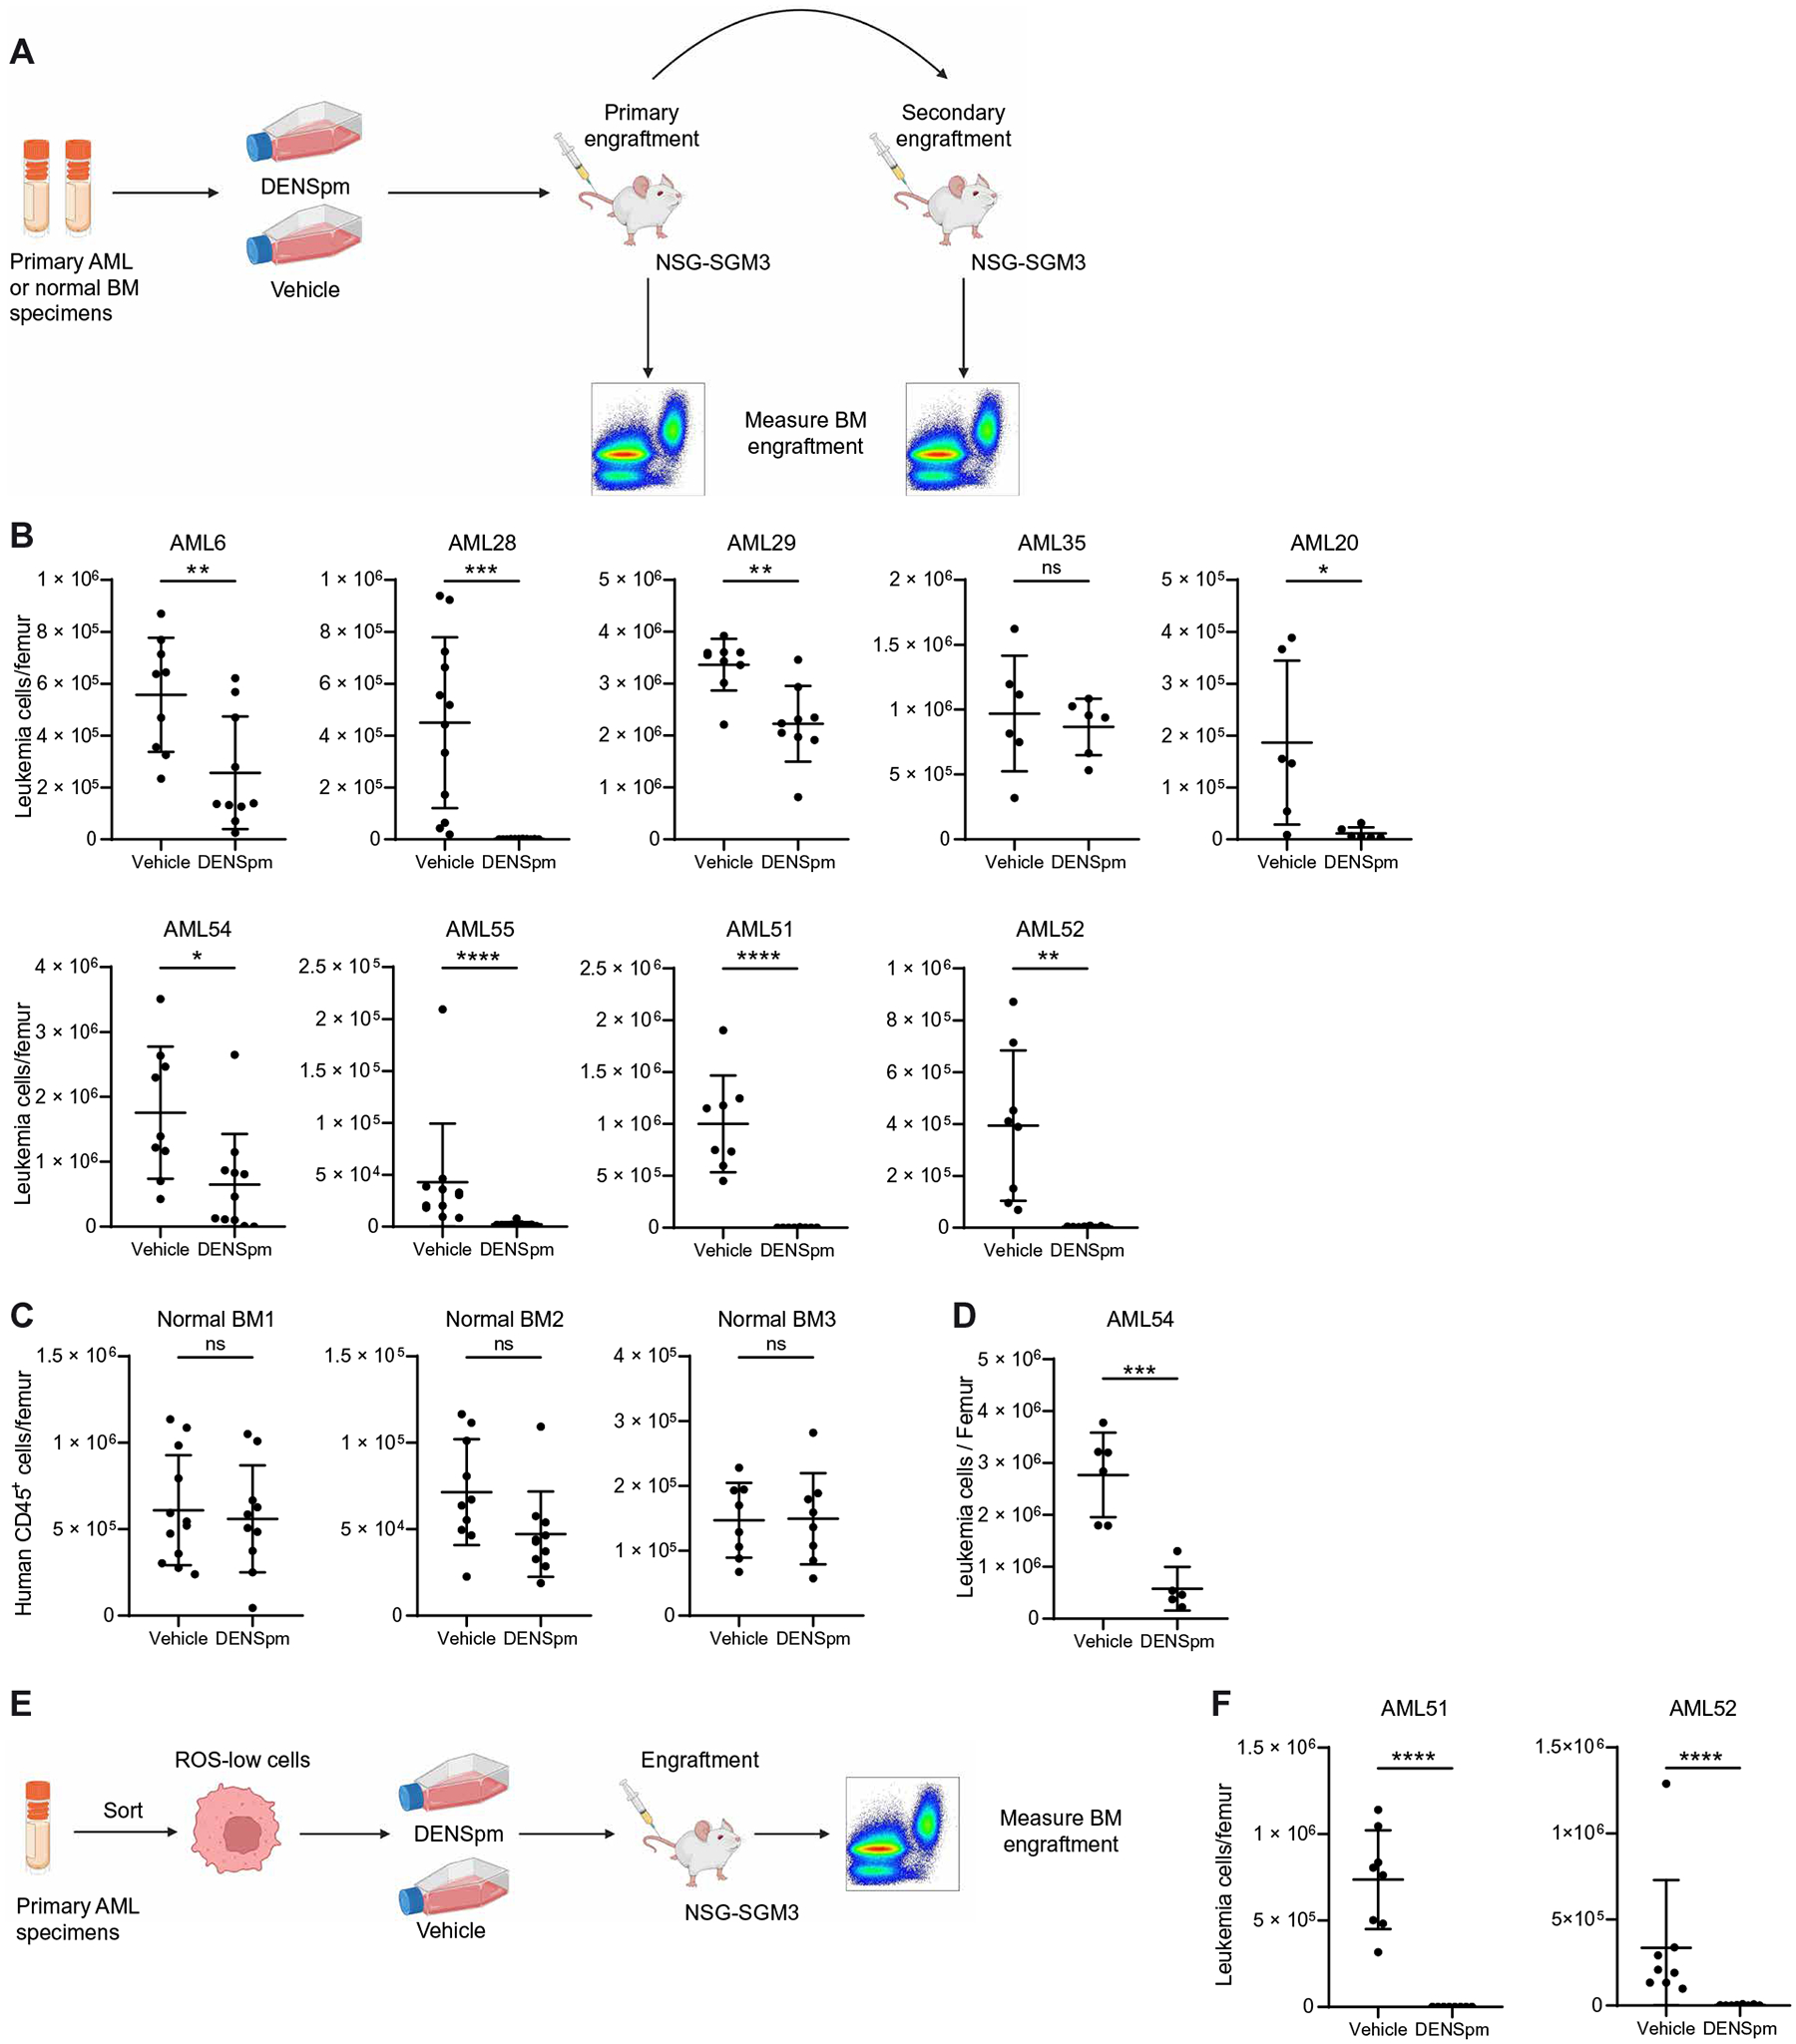
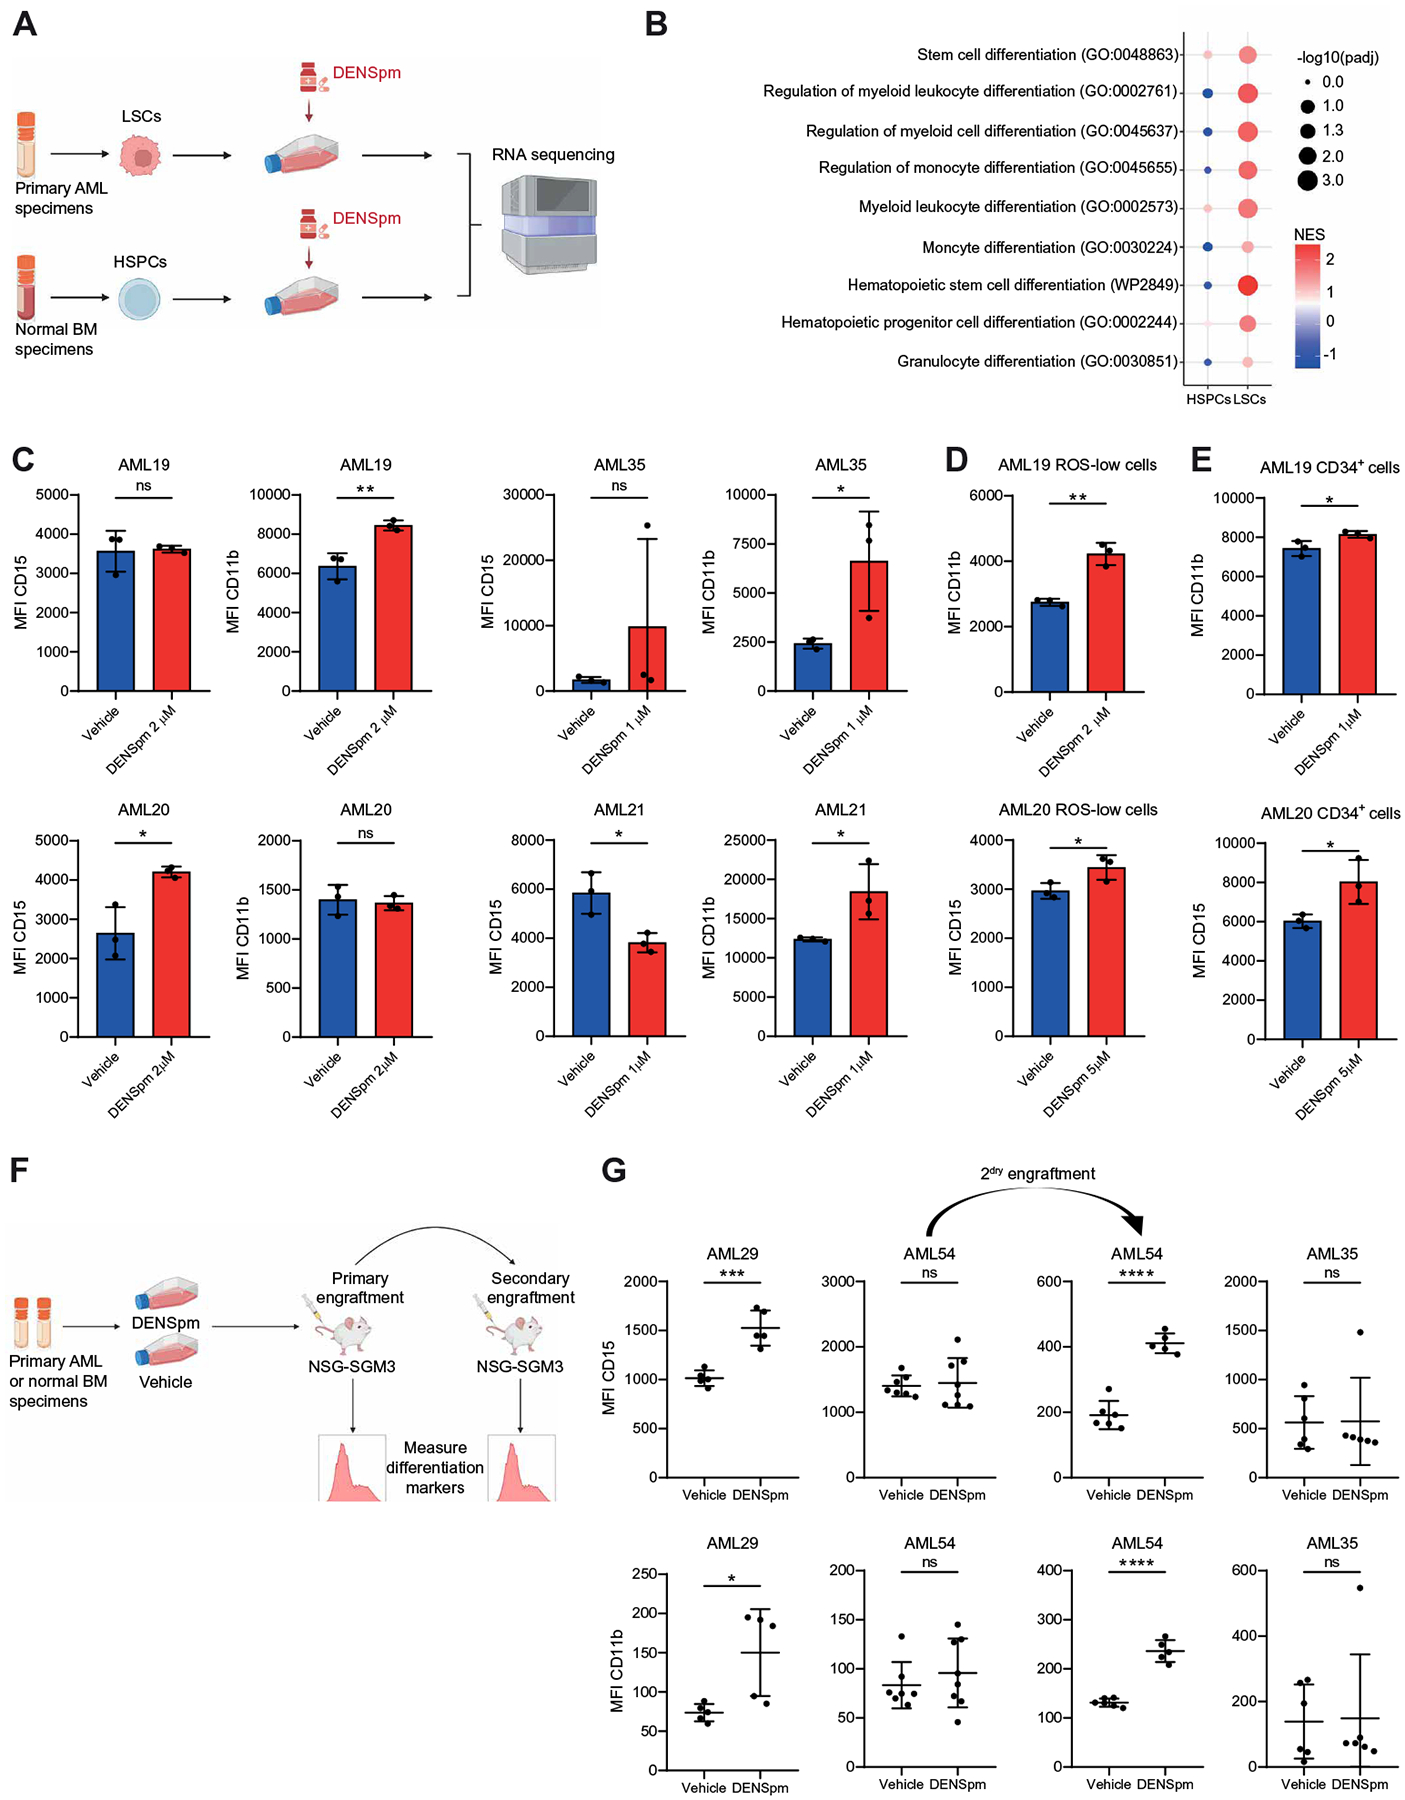
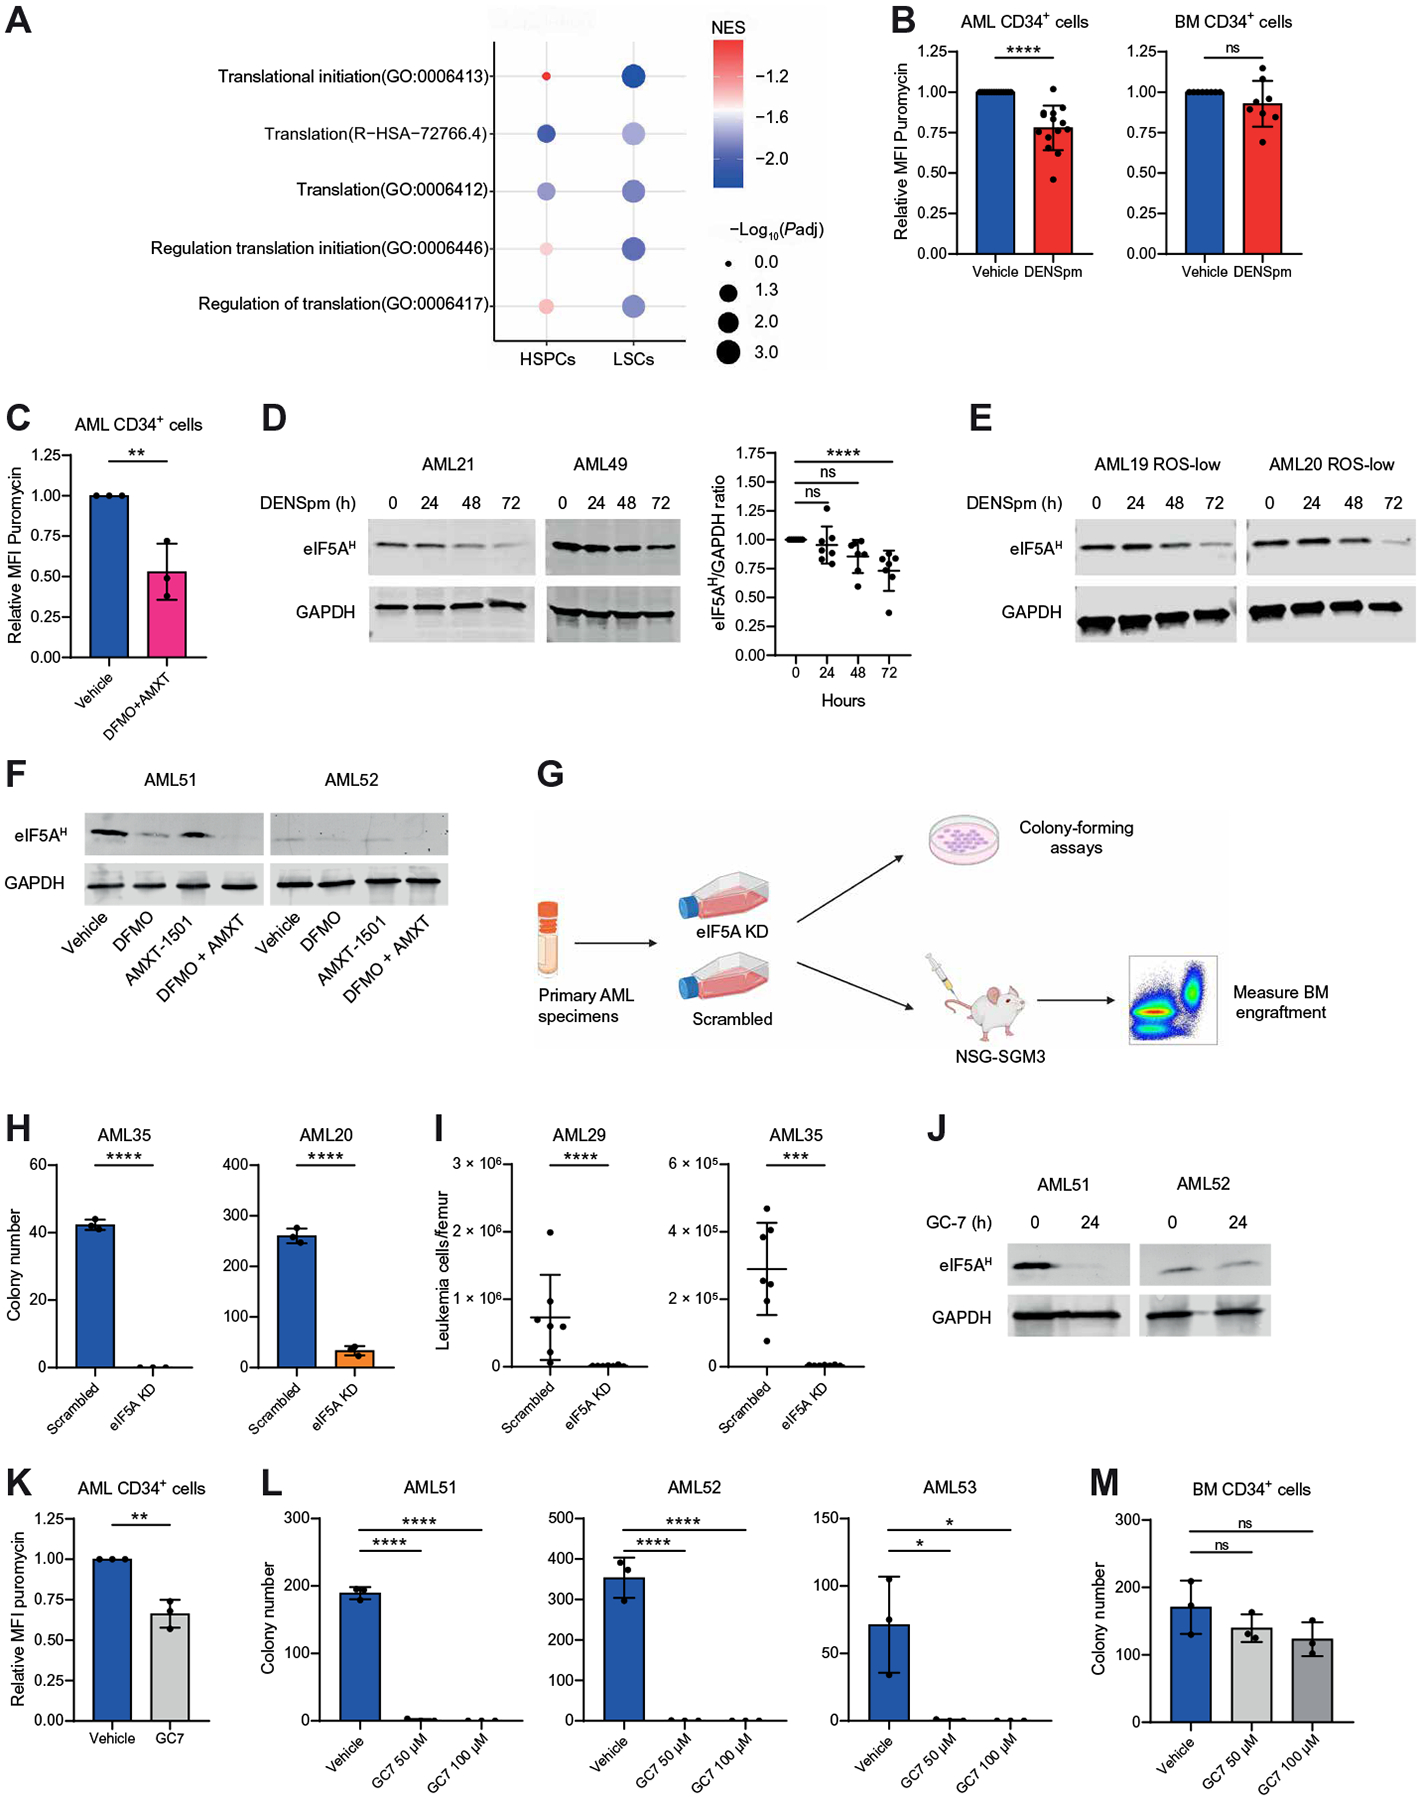
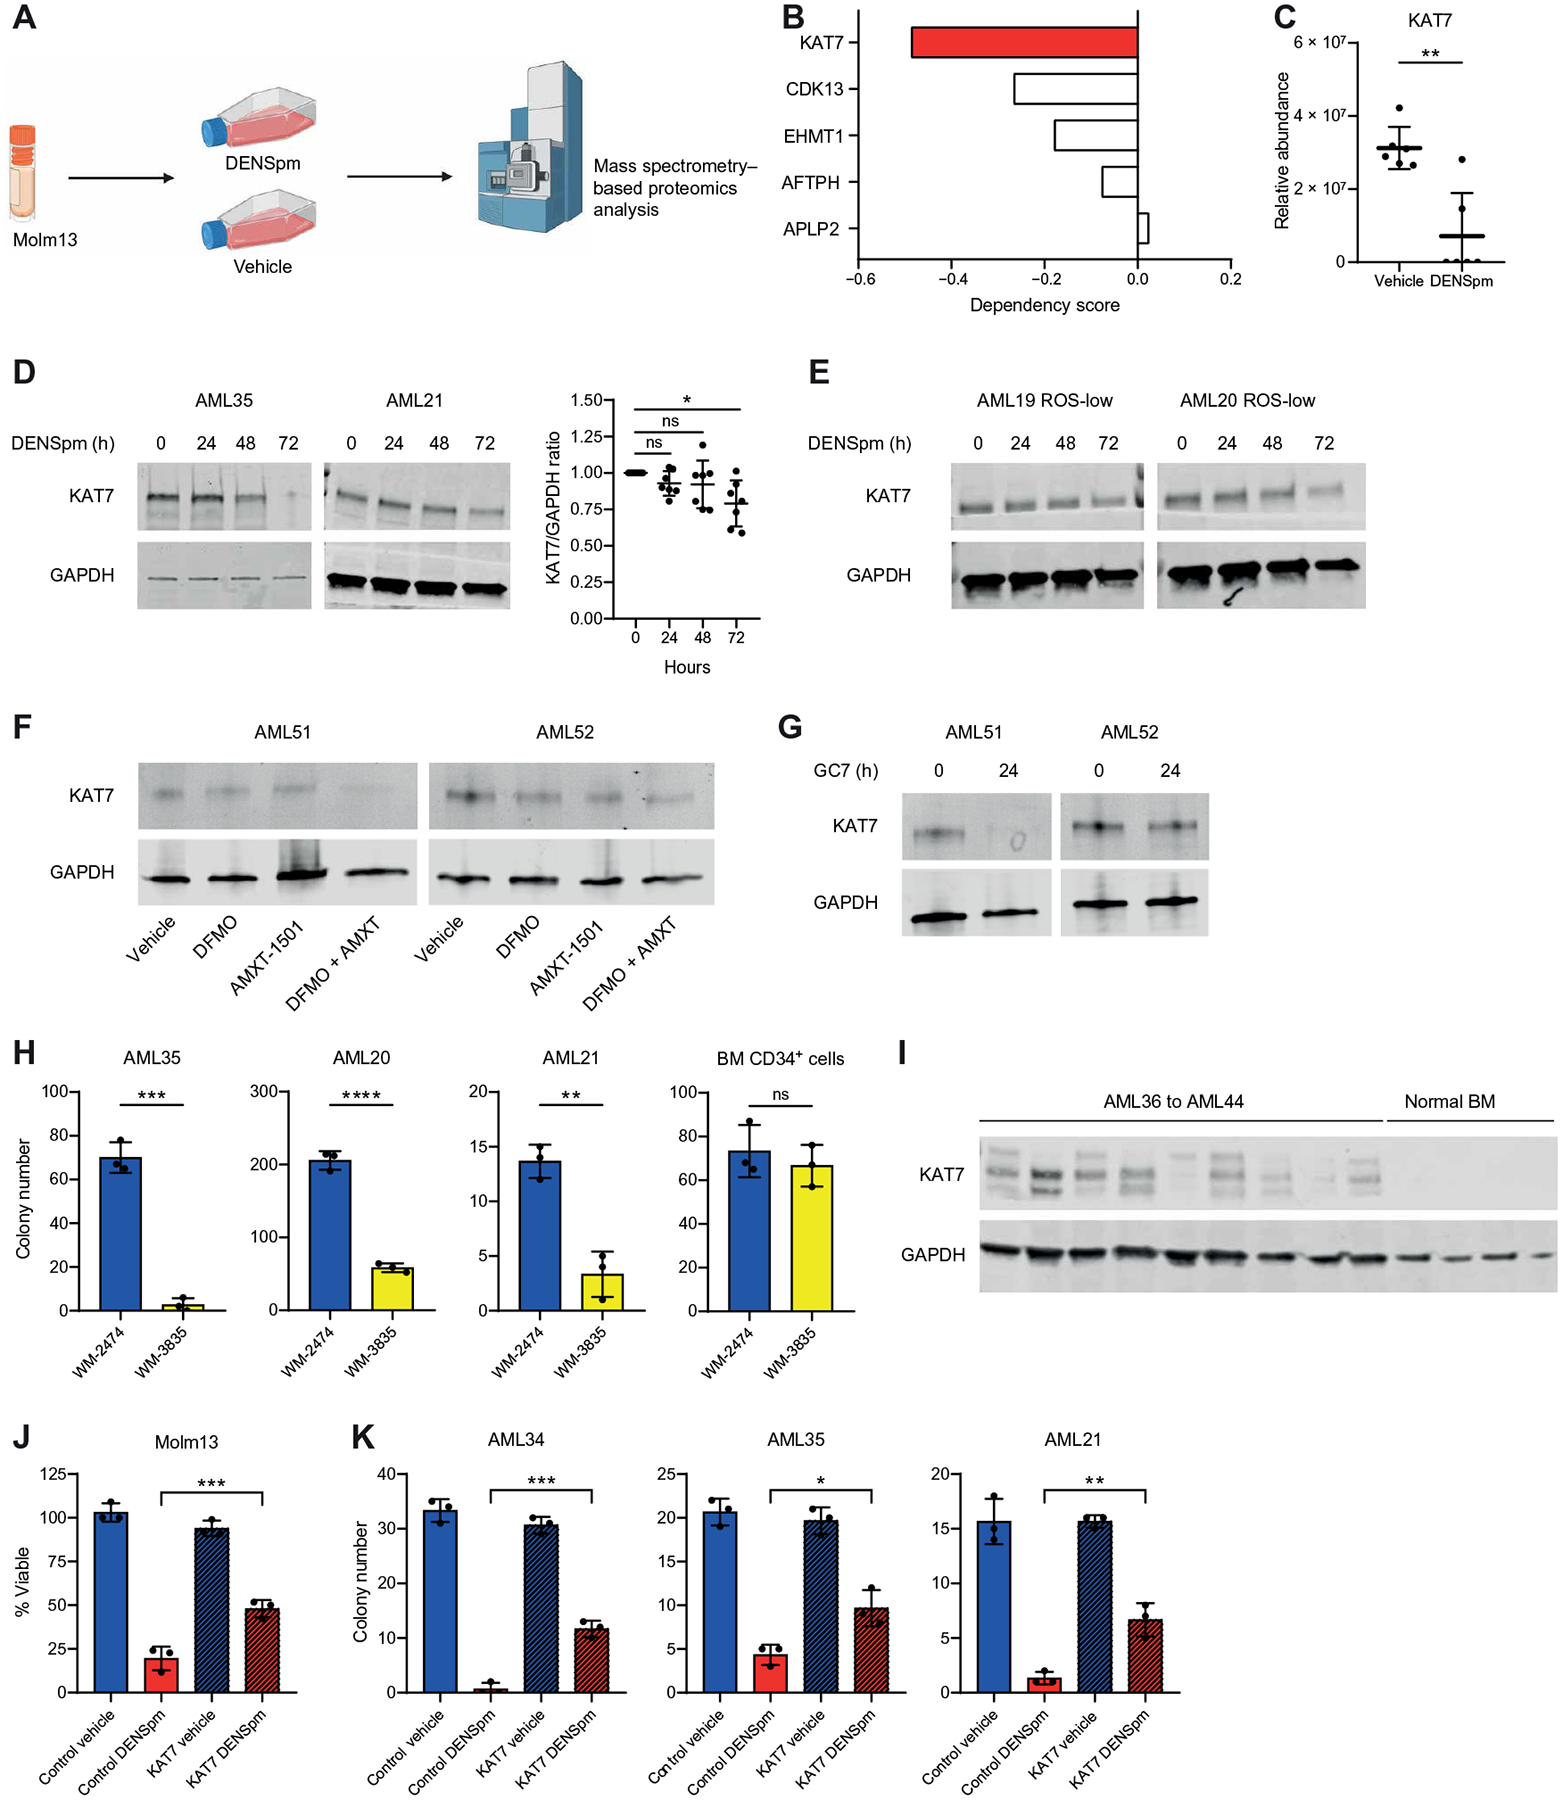
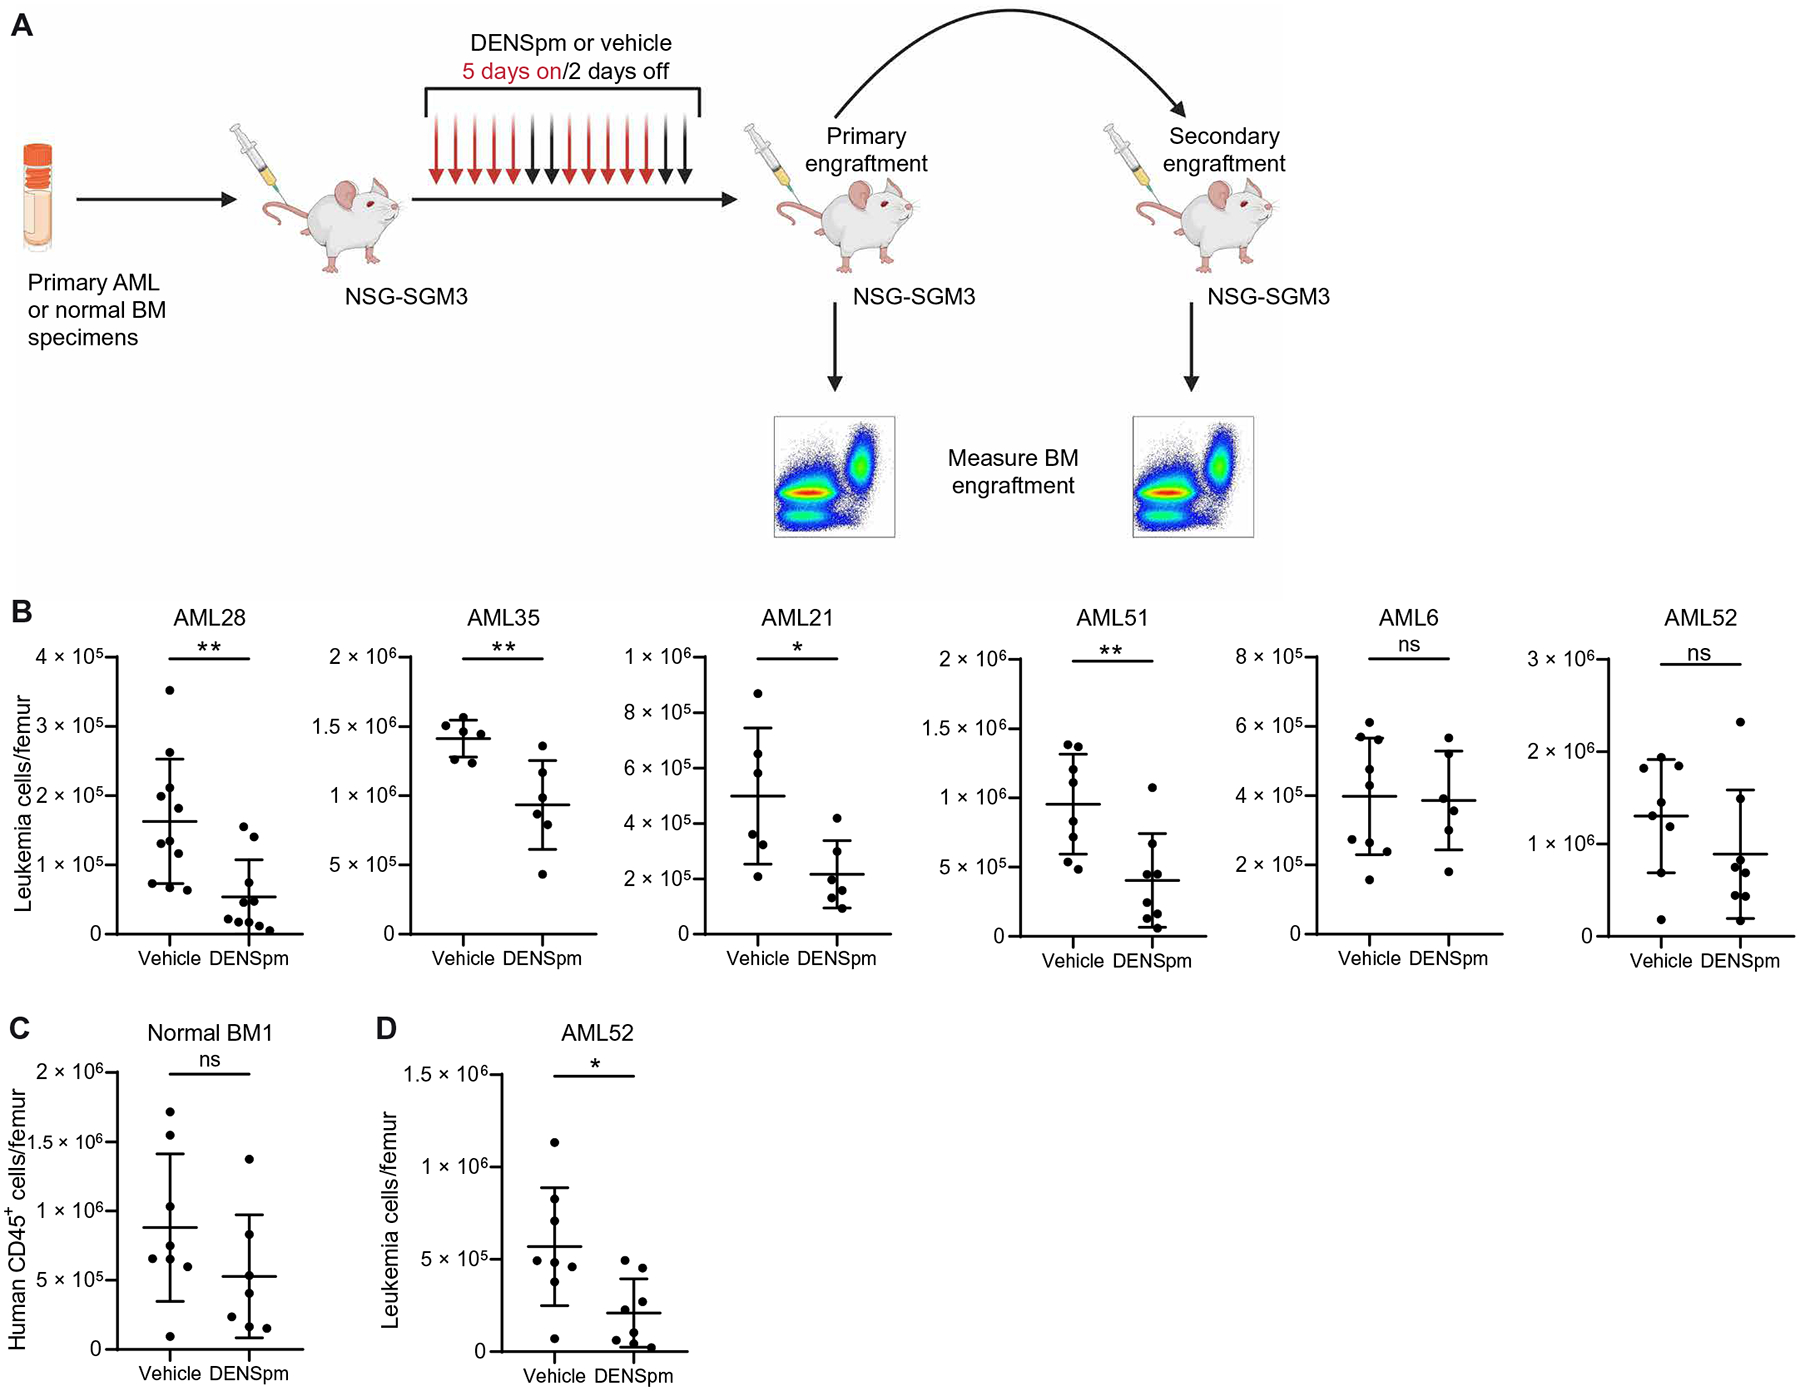
Acute myeloid leukemia (AML) is a devastating disease initiated and maintained by a rare subset of cells called leukemia stem cells (LSCs). LSCs are responsible for driving disease relapse, making the development of new therapeutic strategies to target LSCs urgently needed. The use of mass spectrometry-based metabolomics profiling has enabled the discovery of unique and targetable metabolic properties in LSCs. However, we do not have a comprehensive understanding of metabolite differences between LSCs and their normal counterparts, hematopoietic stem and progenitor cells (HSPCs). In this study, we used an unbiased mass spectrometry-based metabolomics analysis to define differences in metabolites between primary human LSCs and HSPCs, which revealed that LSCs have a distinct metabolome. Spermidine was the most enriched metabolite in LSCs compared with HSPCs. Pharmacological reduction of spermidine concentrations decreased LSC function but spared normal HSPCs. Polyamine depletion also decreased leukemic burden in patient-derived xenografts. Mechanistically, spermidine depletion induced LSC myeloid differentiation by decreasing eIF5A-dependent protein synthesis, resulting in reduced expression of a select subset of proteins. KAT7, a histone acetyltransferase, was one of the top candidates identified to be down-regulated by spermidine depletion. Overexpression of KAT7 partially rescued polyamine depletion-induced decreased colony-forming ability, demonstrating that loss of KAT7 is an essential part of the mechanism by which spermidine depletion targets AML clonogenic potential. Together, we identified and mechanistically dissected a metabolic vulnerability of LSCs that has the potential to be rapidly translated into clinical trials to improve outcomes for patients with AML.


Conflict of interest statement

Competing interests: The authors declare that they have no competing interests.

Figures

Fig. 1.
Fig. 1.. Arginine metabolism is enriched in LSCs compared with HSPCs.
(A) Experimental design of metabolomics analysis. LSCs were enriched from cryopreserved AML specimens isolated from 18 patients with AML (AML1 to AML18) using relative ROS abundance. HSPCs were enriched using five CD34-enriched NBM samples. Metabolite abundance was determined by mass spectrometry. Created with BioRender.com. (B) Principal components (PC) analysis of ROS-low LSCs and CD34+ HSPCs based on metabolomics data. (C) Pathway analysis of metabolites enriched in ROS-low LSCs compared with CD34+ HSPCs determined using Metaboanalyst 4.0. (D) Metabolite abundance detected by steady-state metabolomics analysis in ROS-low LSCs and CD34+ HSPCs. Significance was determined using a paired t test. AU, arbitrary unit. All error bars represent SD. **P < 0.01, ***P < 0.005, and ****P < 0.001; ns, not significant. TCA, tricarboxylic acid.
Fig. 2.
Fig. 2.. Arginine metabolism supports spermidine biosynthesis in LSCs.
(A) Experimental design of stable isotope tracing experiments. [13C615N4] Arginine was pulsed into ROS-low LSCs enriched from three primary samples (AML27 to AML29) for 6 or 24 hours. Enrichment of 13C and 15N was determined by mass spectrometry. Created with BioRender.com. (B) Graphs show enrichment of heavy atoms (13C and 15N) from the stable isotope from arginine into putrescine and spermidine in ROS-low LSCs. M + 6 + 4 indicates metabolites with six 13C and four 15N atoms. M + 4 + 2 indicates metabolites with four 13C and two 15N atoms. Schematic created with BioRender.com. (C) Viability of LSCs enriched from four primary samples (AML27 and AML30 to AML32) cultured in arginine-depleted medium ±10 μM spermidine, 10 μM spermine, or their combination for 24 hours. Statistical significance was determined using two-way ANOVA. (D) Experimental design of metabolomics analysis. Created with BioRender.com. LSCs were enriched from five primary AMLs (AML6, AML19, and AML33 to AML35) on the basis of CD34+ expression. HSPCs were enriched using four CD34-enriched NBM samples. Metabolite abundance was determined by mass spectrometry. (E) Pathway analysis of metabolites enriched in CD34+ LSCs compared with CD34+ HSPCs determined using Metaboanalyst 4.0. (F) Spermidine and spermine abundance in CD34+ LSCs and CD34+ HSPCs. Significance was determined using a paired t test. All error bars represent SD. **P < 0.01 and ****P < 0.001; ns, not significant.
Fig. 3.
Fig. 3.. Spermidine metabolism is essential for LSC survival.
(A) Expression of SAT1 determined by Western blot in nine primary AML specimens (AML36 to AML44) and four NBM specimens. Significance was determined using an unpaired t test. (B) Expression of SAT1 protein was compared by Western blot in ROS-low LSCs from AML19, AML20, and AML35 relative to CD34+-enriched HSPCs. (C) RNA expression from CD34+ HSPCs enriched using four NBM samples and in ROS-low LSCs enriched from five primary AML specimens (AML28, AML29, and AML45 to AML47). HSPCs and LSCs were incubated for 24 hours with 10 μM DENSpm or vehicle. Significance was determined using an unpaired t test. (D) Expression of SAT1 determined by Western blot in seven primary AML specimens (AML16, AML19 to AML21, AML34, AML48, and AML49) incubated for 0, 24, 48, or 72 hours with 10 μM DENSpm. Significance was determined using an unpaired Mann-Whitney test. Glyceraldehyde-3-phosphate dehydrogenase (GAPDH) control for AML21 was also used in Fig. 7D, and GAPDH controls for AML16, AML19, AML34, and AML49 were also used in fig. S8B. (E) Spermidine abundance was determined by mass spectrometry in primary AML specimens (AML51 and AML52) incubated for 24 hours with 10 μM DENSpm, 2.5 mM DFMO, 400 nM AMXT-1501, the combination of DFMO + AMXT 1501, or vehicle. Significance was determined using two-way ANOVA. (F) Spermine abundance determined by mass spectrometry in primary AML specimens (AML51 and AML52) incubated for 24 hours with 10 μM DENSpm, 2.5 mM DFMO, 400 nM AMXT-1501, the combination of DFMO + AMXT 1501, or vehicle. Significance was determined using two-way ANOVA. (G) Colony-forming ability of four bulk primary AML specimens (AML19 to AML21 and AML35) after 24-hour incubation with the indicated doses of DENSpm or vehicle. Colony numbers were determined after 1 to 3 weeks. Statistical significance was determined using two-way ANOVA. (H) Colony-forming ability of one CD34-enriched BM sample after 24-hour incubation with the indicated doses of DENSpm or vehicle. Colony numbers were determined after 2 weeks. Statistical significance was determined using two-way ANOVA. (I) Colony-forming ability of three bulk primary AML specimens (AML51 to AML53) after 24-hour incubation with 2.5 mM DFMO, 400 nM AMXT 1501, the combination, or vehicle. Colony numbers were determined after 1 to 3 weeks. Statistical significance was determined using two-way ANOVA. (J) Colony-forming ability of one CD34-enriched BM sample after 24-hour incubation with 2.5 mM DFMO, 400 nM AMXT 1501, the combination, or vehicle. Colony numbers were determined after 2 weeks. Statistical significance was determined using two-way ANOVA. All error bars represent SD. *P < 0.05, **P < 0.01, ***P < 0.005, and ****P < 0.001.
Fig. 4.
Fig. 4.. Polyamine depletion targets functional LSCs.
(A) Experimental design of engraftment assays. Nine primary AML specimens (AML6, AML20, AML28, AML29, AML35, AML51, AML52, AML54, and AML55) and three NBM specimens were incubated for 72 hours with 10 μM DENSpm or vehicle before injection into NSG-SGM3 mice. Created with BioRender.com. (B) Engraftment of nine primary AML specimens in NSG-SGM3 mice after ex vivo treatment with DENSpm or vehicle. Each point represents a single mouse. Statistical significance was determined using an unpaired t test (AML28, AML35, and AML52) or using an unpaired Mann-Whitney test (AML6, AML29, AML20, AML54, AML55, and AML51). Vehicle condition for AML20 is also used in fig. S5A. (C) Engraftment of three NBM specimens in NSG-SGM3 mice after ex vivo treatment with DENSpm or vehicle. Each point represents a single mouse. Statistical significance was determined using an unpaired t test. (D) Engraftment of one primary AML specimen (AML54) into secondary NSG-SGM3 recipient mice after ex vivo treatment with DENSpm or vehicle. Each point represents a single mouse. Statistical significance was determined using an unpaired t test. Schematic created with BioRender.com. (E) Experimental design of engraftment assays on ROS-low–enriched LSCs. (F) Engraftment of ROS-low LSCs enriched from two primary AML specimens (AML51 to AML52) in NSG-SGM3 mice after ex vivo treatment with DENSpm or vehicle. Each point represents a single mouse. Statistical significance was determined using an unpaired t test (AML51) or an unpaired Mann-Whitney test (AML52). All error bars represent SD. *P < 0.05, **P < 0.01, ***P < 0.005, and ****P < 0.001.
Fig. 5.
Fig. 5.. Polyamine depletion induces myeloid differentiation in LSCs.
(A) Experimental design of transcriptomic analyses by RNA-seq. LSCs were enriched from five primary AMLs (AML28, AML29, and AML45 to AML47) on the basis of relative ROS abundance. HSPCs were enriched using three CD34-enriched NBM samples. ROS-low LSCs and CD34+ HSPCs were treated with vehicle or 10 μM DENSpm for 24 hours before RNA extraction and RNA-seq. Schematic created with BioRender.com. (B) Dotplot visualization of top gene ontology (GO) related to hematopoietic differentiation determined by GSEA in ROS-low LSCs and CD34+ HSPCs. NES, normalized enrichment score; Padj, adjusted P value. (C) Four primary AML specimens (AML19 to AML21 and AML35) were incubated for 24 hours with DENSpm or vehicle before colony-forming assays. After 14 days, the mean fluorescence intensities (MFI) for CD15 and CD11b in colonies were determined by flow cytometry. Statistical significance was determined using an unpaired t test. (D) LSCs were enriched using ROS-low sorting from two primary AML specimens (AML19 and AML20) and were incubated for 24 hours with DENSpm or vehicle before colony-forming assays. After 14 days, MFI for CD15 and CD11b in colonies were determined by flow cytometry. Statistical significance was determined using an unpaired t test. (E) LSCs were enriched by sorting for CD34+ cells from two primary AML specimens (AML19 and AML20) were incubated for 24 hours with DENSpm or vehicle before colony-forming assays. After 14 days, MFI for CD15 and CD11b in colonies was determined by flow cytometry. Statistical significance was determined using an unpaired t test. (F) Experimental design of engraftment assays. Schematic created with BioRender.com. Three primary AML specimens (AML29, AML35, and AML54) and three NBM specimens were incubated for 72 hours with 10 μM DENSpm or vehicle before injection into NSG-SGM3 mice. For AML54, equal numbers of human leukemic cells from vehicle- and DENSpm-treated mice were injected into secondary recipient mice. (G) MFI for CD15 and CD11b on CD45+ human cells in NSG-SGM3 recipient mice after ex vivo treatment with DENSpm or vehicle for three primary AML specimens. For AML54, MFI for CD15 and CD11b in secondary recipients is shown. Each point represents a single mouse. Statistical significance was determined using an unpaired t test. All error bars represent SD. *P < 0.05, **P < 0.01, ***P < 0.005, and ****P < 0.001.
Fig. 6.
Fig. 6.. Polyamine depletion reduces protein synthesis and eIF5A hypusination in LSCs.
(A) Dotplot visualization of top GO related to mRNA translation determined by GSEA in ROS-low LSCs and CD34+ HSPCs. (B) MFI for puromycin determined by flow cytometry on CD34+ LSCs enriched from 14 primary AML specimens (AML6, AML20, AML21, AML34, AML35, AML45, AML47, AML49, AML51 to AML53, AML55, AML56, and AML58) and CD34+ HSPCs enriched from eight NBM specimens. Cells were incubated for 24 hours with 10 μM DENSpm or vehicle. Statistical significance was determined using an unpaired t test. (C) MFI for puromycin determined by flow cytometry on CD34+ LSCs enriched from three AML specimens (AML51 to AML53) after incubation for 24 hours with 2.5 mM DFMO and 400 nM AMXT 1501 or vehicle. Statistical significance was determined using an unpaired t test. (D) Expression of eIF5AH determined by Western blot in bulk primary AML specimens (AML16, AML19 to AML21, AML34, AML48, and AML49; two are shown in the main figure, and others are in fig. S7F) incubated for 0, 24, 48, or 72 hours with 10 μM DENSpm. Statistical significance was determined using an unpaired Mann-Whitney test. (E) Expression of eIF5AH determined by Western blot in ROS-low–enriched LSCs (AML19 and AML20) incubated for 0, 24, 48, or 72 hours with 10 μM DENSpm. (F) Expression of eIF5AH determined by Western blot in primary AML specimens (AML51 and AML52) incubated for 24 hours with 2.5 mM DFMO, 400 nM AMXT 1501, or the combination. (G) Primary AML specimens were transfected with scrambled or eIF5A-targeting small interfering RNA (siRNA). Twenty-four hours after transfection, cells were seeded in methocult medium for colony-forming assays or injected into NSG-SGM3 mice for engraftment assays. Schematic created with BioRender.com. (H) Colony-forming potential of two primary AML specimens (AML20 and AML35) after scrambled or eIF5A-targeting siRNA transfection. Statistical significance was determined using an unpaired t test. (I) Engraftment of two primary AML specimens (AML29, 35) in NSG-SGM3 mice after scrambled or eIF5A-targeting siRNA transfection. Each point represents a single mouse. Statistical significance was determined using an unpaired t test (AML35) or an unpaired Mann-Whitney test (AML29). (J) Expression of eIF5AH determined by Western blot in primary AML specimens (AML51 and AML52) incubated for 24 hours with 50 μM GC7. (K) MFI for puromycin determined by flow cytometry on CD34+ LSCs enriched from three primary AML specimens (AML51 to AML53) after incubation for 24 hours with 50 μM GC7 or vehicle. Statistical significance was determined using an unpaired t test. (L) Colony-forming ability of three bulk primary AML specimens (AML51 to AML53) after 24-hour incubation with GC7 or vehicle. Colony numbers were determined after 1 to 3 weeks. Statistical significance was determined using one-way ANOVA. (M) Colony-forming ability of one CD34-enriched BM sample after 24-hour incubation with GC7 or vehicle. Colony numbers were determined after 2 weeks. Statistical significance was determined using one-way ANOVA. All error bars represent SD. *P < 0.05, **P < 0.01, ***P < 0.005, and ****P < 0.001.
Fig. 7.
Fig. 7.. Polyamine depletion targets LSCs through reduced expression of KAT7.
(A) Experimental design of proteomics analysis. Protein abundance in Molm13 cells was determined by mass spectrometry 24 hours after treatment with 10 μM DENSpm. Schematic created with BioRender.com. (B) Dependency scores for KAT7, CDK13, EHMT1, AFTPH, and APLP2 were determined using DepMap. (C) KAT7 abundance detected by mass spectrometry proteomics in Molm13 cells. Significance was determined using an unpaired Mann-Whitney test. (D) Expression of KAT7 determined by Western blot in eight bulk primary AML specimens (AML16, AML19 to AML21, AML34, AML35, AML48, and AML49 shown in the main figure and others shown in fig. S8B) incubated for 0, 24, 48, or 72 hours with 10 μM DENSpm. Statistical significance was determined using an unpaired t test. (E) Expression of KAT7 determined by Western blot in ROS-low–enriched LSCs (AML19 and AML20) incubated for 0, 24, 48, or 72 hours with 10 μM DENSpm. (F) Expression of KAT7 determined by Western blot in two bulk primary AML specimens (AML51 and AML52) incubated for 24 hours with 2.5 mM DFMO and 400 nM AMXT1501 or the combination. (G) Expression of KAT7 determined by Western blot in two bulk primary AML specimens (AML51 and 52) incubated for 24 hours with 50 μM GC7. (H) Colony-forming potential of three bulk AML samples (AML20, AML21, and AML35) and one CD34-enriched bone marrow sample treated with 1 μM KAT7 inhibitor WM-3835 or inactive analog WM-2474. Colony numbers were determined after 1 to 3 weeks. Statistical significance was determined using an unpaired t test. (I) Expression of KAT7 determined by Western blot in nine primary AML specimens (AML36 to AML44) and four NBM specimens. (J) Viability of Molm13 cells incubated for 48 hours with 10 μM DENSpm or vehicle and transfected or not with KAT7 recombinant. Statistical significance was determined using two-way ANOVA. (K) Colony-forming ability of three primary AML specimens (AML21, AML34, and AML35) incubated for 24 hours with 10 μM DENSpm or vehicle and transfected or not with KAT7 recombinant. Colony numbers were determined after 1 to 3 weeks. Statistical significance was determined using two-way ANOVA. All error bars represent SD. *P < 0.05, **P < 0.01, ***P < 0.005, and ****P < 0.001.
Fig. 8.
Fig. 8.. Polyamine depletion targets primary AML in vivo.
(A) Experimental design of in vivo treatment with DENSpm. Six primary AML specimens (AML6, AML21, AML28, AML35, AML51, and AML52) and one NBM specimen were injected into NSG-SGM3 mice. Once leukemia burden reached 10% in the bone marrow, mice were injected with DENSpm (60 mg/kg) or vehicle 5 days/week for 2 weeks before BM engraftment was measured. For one specimen, an equal number of cells from the primary recipient was transplanted into secondary recipient mice to measure in vivo LSC targeting. Schematic created with BioRender.com. (B) Leukemic burden in six primary AML specimens in NSG-SGM3 mice after in vivo treatment with DENSpm or vehicle. Each point represents a single mouse. Statistical significance was determined using an unpaired t test. Vehicle conditions for AML21 and AML35 are also used in fig. S9A. (C) Engraftment of one NBM specimen in NSG-SGM3 mice after in vivo treatment with DENSpm or vehicle. Each point represents a single mouse. Statistical significance was determined using an unpaired t test. (D) Engraftment of AML52 in NSG-SGM3 mice after secondary transplantation and in vivo treatment with DENSpm or vehicle. Each point represents a single mouse. Statistical significance was determined using an unpaired t test. All error bars represent SD. *P < 0.05 and **P < 0.01.

References

    1. DiNardo CD, Erba HP, Freeman SD, Wei AH, Acute myeloid leukaemia. Lancet 401, 2073–2086 (2023). - PubMed
    1. Shlush LI, Mitchell A, Heisler L, Abelson S, Ng SWK, Trotman-Grant A, Medeiros JJF, Rao-Bhatia A, Jaciw-Zurakowsky I, Marke R, McLeod JL, Doedens M, Bader G, Voisin V, Xu C, McPherson JD, Hudson TJ, Wang JCY, Minden MD, Dick JE, Tracing the origins of relapse in acute myeloid leukaemia to stem cells. Nature 547, 104–108 (2017). - PubMed
    1. Jones CL, Inguva A, Jordan CT, Targeting energy metabolism in cancer stem cells: Progress and challenges in leukemia and solid tumors. Cell Stem Cell 28, 378–393 (2021). - PMC - PubMed
    1. Hanahan D, Hallmarks of cancer: New dimensions. Cancer Discov. 12, 31–46 (2022). - PubMed
    1. DeVilbiss AW, Zhao Z, Martin-Sandoval MS, Ubellacker JM, Tasdogan A, Agathocleous M, Mathews TP, Morrison SJ, Metabolomic profiling of rare cell populations isolated by flow cytometry from tissues. eLife 10, e61980 (2021). - PMC - PubMed

Publication types