. 2024 Sep 25;16(766):eadk8446.
doi: 10.1126/scitranslmed.adk8446. Epub 2024 Sep 25.

Inhibition of heme-thiolate monooxygenase CYP1B1 prevents hepatic stellate cell activation and liver fibrosis by accumulating trehalose

Affiliations

Inhibition of heme-thiolate monooxygenase CYP1B1 prevents hepatic stellate cell activation and liver fibrosis by accumulating trehalose

Hung-Chun Tung et al. Sci Transl Med. .

Abstract

Activation of extracellular matrix-producing hepatic stellate cells (HSCs) is a key event in liver fibrogenesis. We showed that the expression of the heme-thiolate monooxygenase cytochrome P450 1B1 (CYP1B1) was elevated in human and mouse fibrotic livers and activated HSCs. Systemic or HSC-specific ablation and pharmacological inhibition of CYP1B1 attenuated HSC activation and protected male but not female mice from thioacetamide (TAA)-, carbon tetrachloride (CCl4)-, or bile duct ligation (BDL)-induced liver fibrosis. Metabolomic analysis revealed an increase in the disaccharide trehalose in CYP1B1-deficient HSCs resulting from intestinal suppression of the trehalose-metabolizing enzyme trehalase, whose gene we found to be a target of RARα. Trehalose or its hydrolysis-resistant derivative lactotrehalose exhibited potent antifibrotic activity in vitro and in vivo by functioning as an HSC-specific autophagy inhibitor, which may account for the antifibrotic effect of CYP1B1 inhibition. Our study thus reveals an endobiotic function of CYP1B1 in liver fibrosis in males, mediated by liver-intestine cross-talk and trehalose. At the translational level, pharmacological inhibition of CYP1B1 or the use of trehalose/lactotrehalose may represent therapeutic strategies for liver fibrosis.


Conflict of interest statement

Competing interests: N.I. reports consultancy agreements with Boehringer Ingelheim and Merck. Other authors declare that they have no competing interests.

Figures

Fig. 1.
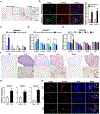
Fig. 1.. CYP1B1 expression is elevated in fibrotic human and mouse livers.
(A) Representative images of CYP1B1 immunostaining in human liver with mild steatosis or fibrosis. Arrows indicate positive CYP1B1 staining. Scale bar, 50 μM. (B) Representative immunofluorescence images of α-SMA and CYP1B1 in human liver with mild steatosis (n=6) or fibrosis (n=6, scale bar, 100 μM) with quantifications. (C to E) Three Gene Expression Omnibus datasets, GSE28619 from patients with alcoholic hepatitis (C), GSE89377 from patients with chronic hepatitis and cirrhosis (D), and GSE84044 from patients with HBV-associated liver fibrosis (stages S0-S4 based on Scheuer scoring) (E) were analyzed for hepatic CYP1B1, CYP1A1, CYP1A2, and AHR expression. (F) Representative images of CYP1B1 immunostaining in TAA-, CCl4-, and BDL-induced fibrotic mouse livers. Scale bars are 500 μM and 100 μM for upper and lower panels, respectively. (G) Mouse hepatic Cyp1b1 mRNA expression in TAA- (n=6), CCl4- (n=4), and BDL- (n=6) induced fibrotic mouse livers. (H) Representative immunofluorescence images of α-SMA and Cyp1b1 in TAA-, CCl4-, and BDL-induced fibrotic mouse livers. Arrows indicate α-SMA+ and Cyp1b1+ colocalization areas. Scale bar, 50 μM. All data are mean ± SEM; *P < 0.05, **P < 0.01, ***P < 0.001.
Fig. 2.
Fig. 2.. CYP1B1 is highly expressed in HSCs, and its expression increases with the onset of HSC activation independent of AhR.
(A and B) Primary HEPs (n=6) and HSCs (n=4) were isolated from the same liver. The mRNA expression of human CYP1B1 (A) or mouse Cyp1b1 (B). (C and D) Primary human HSCs (C) or mouse HSCs (D) were culture-activated for the indicated duration. The mRNA expression of CYP1B1, AHR, CYP1A1, and fibrogenic genes (n=4). (E) Primary mouse HSCs isolated from WT or Ahr−/− mice were culture-activated, and Cyp1b1 mRNA expression determined (n=4). (F) Primary HSCs, HEPs, and LSECs were isolated from WT mice treated with 3 doses of vehicle (PBS, n=3) or TAA (100 mg/kg body weight, n=3) every 3 days. Cyp1b1 mRNA was measured. (G) Primary HSCs were isolated from WT mice treated with 4 doses of vehicle (corn oil, n=3) or CCl4 (0.5 μL/g body weight, n=3) every 3 days and assayed for gene expression. (H) GSE34640 was analyzed for Cyp1b1 and Acta2 expression in quiescent HSCs, culture-activated HSCs (culture), and HSCs in vivo activated by CCl4, or BDL. All data are mean ± SEM; *P < 0.05, **P < 0.01, ***P < 0.001.
Fig. 3.
Fig. 3.. Systemic or HSC-specific ablation of CYP1B1 in male mice ameliorates liver fibrosis.
(A to D) WT (n=5) and Cyp1b1 KO (KO, n=5) male mice were treated with TAA (100 mg/kg body weight) 3 times a week for 8 weeks. Shown are representative images of H&E, Sirius Red, and α-SMA immunostaining (A, scale bar, 200 μM) with quantification; hepatic mRNA expression of fibrogenic (B) and pro-inflammatory genes (C); and serum ALT and AST concentrations (D). (E to H) WT (n=4) and KO (n=4) male mice were subjected to BDL for 2 weeks. Shown are H&E, Sirius Red, and α-SMA immunostaining (E, scale bar, 200 μM) with quantification; hepatic mRNA expression of fibrogenic (F) and pro-inflammatory genes (G); and serum ALT and AST concentrations (H). (I to L) Cyp1b1fl/fl (n=6) and Cyp1b1ΔHSC (n=6) male mice were treated with TAA (100 mg/kg body weight) 3 times a week for 8 weeks. Shown are representative images of H&E, Sirius Red, and α-SMA immunostaining (I, scale bar, 200 μM) with quantification; hepatic mRNA expression of fibrogenic (J) and pro-inflammatory genes (K); and serum = ALT and AST concentrations (L). All data are mean ± SEM; *P < 0.05, **P < 0.01, ***P < 0.001.
Fig. 4.
Fig. 4.. Ablation of Cyp1b1 inhibits HSC activation.
(A to D) Primary HSCs were isolated from WT and Cyp1b1 knockout (KO) mice treated with 3 doses of vehicle (PBS) or TAA (100 mg/kg body weight), every 3 days. (A) HSCs were FACS-purified and subjected to RNA-seq analysis. Differentially expressed genes are shown by a volcano plot with several fibrogenic marker genes annotated. (B) Gene set enrichment analysis. (C) mRNA fibrogenic gene expression (n=4). (D) Representative images of α-SMA immunofluorescence staining. (E) Primary HSCs isolated from WT and KO mice were culture-activated for 4 days before gene expression measurement. (F to H) Primary HSCs isolated from Cyp1b1fl/fl and Cyp1b1ΔHSC mice were culture-activated for 4 days. Shown are the mRNA expression of fibrogenic genes (F), protein expression of Cyp1b1, α-SMA, Timp1, and beta-actin (G), and representative images of α-SMA and Ki67 immunofluorescence (H). (I and J) Primary HSCs isolated from WT mice were infected with adenovirus expressing shCtrl or shCyp1b1, and then culture-activated for 4 days. (I) Representative images of α-SMA and Ki67 immunofluorescence staining. Scale bar, 200 μM. (J) mRNA expression of Cyp1b1 and fibrogenic genes. (K) Primary HSCs isolated from WT mice were infected with Ad-shCtrl or Ad-shCyp1b1 and treated with TGFβ1 (2 ng/mL) for 24 h. mRNA expression of fibrogenic genes is shown. All data are mean ± SEM; *P < 0.05, **P < 0.01, ***P < 0.001.
Fig. 5.
Fig. 5.. Pharmacological inhibition of CYP1B1 attenuates liver fibrosis and HSC activation.
(A to C) WT male mice subjected to the TAA model were simultaneously given TMS or vehicle (DMSO) by i.p. injection. (A) Outline of drug treatment. Mice were co-treated with TAA (100 mg/kg body weight) and TMS (300 μg/kg body weight, n=4), or TAA and vehicle (n=4) 3 times a week for 8 weeks. (B) Representative images of H&E, Sirius Red, and α-SMA immunostaining (scale bar, 200 μM) with quantification. (C) Hepatic mRNA expression of fibrogenic genes. (D and E) Primary mouse HSCs were treated with TMS (20 μM) or vehicle for 4 days. Shown are representative images of α-SMA and Ki67 immunofluorescence staining (D, scale bar, 100 μM), and mRNA expression of fibrogenic genes (E). NS: not significant. (F and G) Experiments were the same as in (D and E) except that primary human HSCs were used. Shown are α-SMA and Ki67 immunofluorescence staining (F, scale bar, 100 μM), and mRNA expression of fibrogenic genes (G) All data are presented as mean ± SEM; *P < 0.05, **P < 0.01, ***P < 0.001.
Fig. 6.
Fig. 6.. Ablation of Cyp1b1 accumulates trehalose, a disaccharide that inhibits liver fibrosis and HSC activation.
(A and B) HSCs isolated from TAA-treated WT and Cyp1b1 KO male mice were collected and analyzed by UHPLC-MSn. (A) Separation of HSCs from WT-TAA and KO-TAA groups shown in OPLS-DA score plot. Each point represents a mouse sample. (B) Loading S-plot generated by OPLS-DA analysis. The x axis is a measure of the relative abundance of ions, and the y axis is a measure of the correlation of each ion to the model. (C and D) WT and Treh-null (Treh KO) male mice subjected to the TAA model of liver fibrosis simultaneously received trehalose (3% in drinking water, n=7) or vehicle (n=5) for 8 weeks. Shown are representative images of H&E, Sirius Red, and α-SMA immunostaining (C, scale bar, 200 μM) with quantification, as well as hepatic mRNA expression of fibrogenic genes (D). (E and F) Primary mouse HSCs were treated with trehalose (100 mM) or vehicle for 4 days. Shown are α-SMA and Ki67 immunofluorescence staining (E, scale bar, 100 μM), and mRNA expression of fibrogenic genes (F). (G and H) Experiments were the same as in (E and F) except that primary human HSCs were used. Shown are α-SMA and Ki67 immunofluorescence staining (G), and mRNA expression of fibrogenic genes (H). All data are mean ± SEM; *P < 0.05, **P < 0.01, ***P < 0.001.
Fig. 7.
Fig. 7.. Cyp1b1 ablation suppresses intestinal trehalase (Treh) by downregulation of RARα.
(A) Small intestines harvested from WT and Cyp1b1 KO mice treated with 3 doses of vehicle (PBS) or TAA (100 mg/kg body weight) every 3 days (n=3/group) were analyzed for TREH protein expression (top). mRNA expression of Treh and RARα target genes Isx and Dhrs3 also shown. (B) Small intestines from WT male mice treated with TMS (300 μg/kg body weight) or vehicle 3 times a week for 4 weeks (n=3/group) were analyzed for TREH protein expression (top) with the quantification of the bands shown bottom left. Treh, Isx, and Dhrs3 mRNA expression is shown bottom right. (C) Small intestines from Cyp1b1fl/fl and Cyp1b1ΔHSC mice treated with TAA (100 mg/kg body weight) every 3 days (n=3/group) for 8 weeks were analyzed for TREH protein expression (top) with the quantifications of the bands shown bottom left. Treh, Isx, and Dhrs3 mRNA expression is shown bottom right. (D) LC-MS quantification of 13C12-labeled trehalose in the small intestine, total blood serum, and portal vein blood serum of WT (n=4) and Cyp1b1 KO (n=4) mice. (E) Relative quantification of trehalose in TAA-treated WT and Cyp1b1 KO male mouse livers. (F and G) Relative quantification of serum trehalose in male healthy (n=7) and MASH (n=6) subjects (F), or female healthy (n=5) and MASH (n=6) subjects (G). (H to J) WT male mice subjected to the TAA model simultaneously received trehalose (1% in drinking water, n=6), lactotrehalose (1% in drinking water, n=6), or vehicle (n=6) for 8 weeks. Shown are representative images of H&E, Sirius Red, and α-SMA immunostaining (H, scale bar, 200 μM) with quantification, hepatic mRNA expression of fibrogenic genes (I), and serum ALT and AST concentrations (J). All data are mean ± SEM; *P < 0.05, **P < 0.01, ***P < 0.001.
Fig. 8.
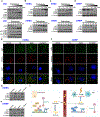
Fig. 8.. Trehalose functions as an HSC-specific autophagy blocker.
(A) Protein expression of fibrogenic and autophagy markers in LX2 cells with increasing concentrations of trehalose for 48 h (top), or 100 mM trehalose for increasing amount of time (bottom). SE: short exposure. LE: long exposure. (B and C) Protein expression of autophagy markers in primary mouse (B) or human HSCs (C) with increasing concentration of trehalose for 48 h (top), or 100 mM trehalose for increasing amount of time (bottom). (D) Experiments were the same as in (C) except that primary mouse HEPs were used. (E) Primary mouse HSCs transfected with mCherry-eGFP-LC3b plasmid for 48 h, followed by treatment with vehicle, trehalose (Tre, 100 mM), bafilomycin A1 (BafA1, 10 nM), or Tre plus BafA1 for 48 h. Shown are representative fluorescence images (top) and autophagy marker protein expression (bottom). 60X magnification. (F) Experiments were the same as in (E) except that primary mouse HEPs were used. (G) Treatments were the same as (E) except autophagy markers protein expression was evaluated. (H) Treatments were the same as (F) except autophagy marker protein expression was evaluated.

References

    1. Wang S, Friedman SL, Found in translation—Fibrosis in metabolic dysfunction–associated steatohepatitis (MASH). Science translational medicine 15, eadi0759 (2023). - PMC - PubMed
    1. Tsochatzis EA, Bosch J, Burroughs AK, Liver cirrhosis. The Lancet 383, 1749–1761 (2014). - PubMed
    1. Bataller R, Brenner DA, Liver fibrosis. The Journal of clinical investigation 115, 209–218 (2005). - PMC - PubMed
    1. Senoo H, Yoshikawa K, Morii M, Miura M, Imai K, Mezaki Y, Hepatic stellate cell (vitamin A-storing cell) and its relative–past, present and future. Cell biology international 34, 1247–1272 (2010). - PubMed
    1. Tsuchida T, Friedman SL, Mechanisms of hepatic stellate cell activation. Nature reviews Gastroenterology & hepatology 14, 397 (2017). - PubMed

Publication types