. 2024 Sep 27;10(39):eadp6038.
doi: 10.1126/sciadv.adp6038. Epub 2024 Sep 25.

Kappa opioids inhibit spinal output neurons to suppress itch

Affiliations

Kappa opioids inhibit spinal output neurons to suppress itch

Tayler D Sheahan et al. Sci Adv. .

Abstract

Itch is a protective sensation that drives scratching. Although specific cell types have been proposed to underlie itch, the neural basis for itch remains unclear. Here, we used two-photon Ca2+ imaging of the dorsal horn to visualize neuronal populations that are activated by itch-inducing agents. We identify a convergent population of spinal interneurons recruited by diverse itch-causing stimuli that represents a subset of neurons that express the gastrin-releasing peptide receptor (GRPR). Moreover, we find that itch is conveyed to the brain via GRPR-expressing spinal output neurons that target the lateral parabrachial nuclei. We then show that the kappa opioid receptor agonist nalfurafine relieves itch by selectively inhibiting GRPR spinoparabrachial neurons. These experiments provide a population-level view of the spinal neurons that respond to pruritic stimuli, pinpoint the output neurons that convey itch to the brain, and identify the cellular target of kappa opioid receptor agonists for the inhibition of itch.


Figures
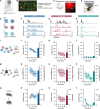
Fig. 1.
Fig. 1.. Neuropeptides evoke prolonged activity in spinal neurons that parallels itch behavior.
(A) Strategy to visualize the activity of excitatory spinal cord dorsal horn neurons with GCaMP6s. (B) Labeled excitatory interneurons (INs) and DiI-backlabeled SPBNs (arrowhead). Scale bar, 25 μm. (C) Targeting of the lPBN with DiI. Scale bar, 50 μm. (D) Neurons throughout lamina I and II were imaged across five separate optical planes. (E) Direct and downstream populations activated in response to application of itch-inducing peptides. (F to H) Ca2+ traces from interneurons and SPBNs showing network level responses to (F) GRP, (G) octreotide, or (H) SP. (I) Ca2+ activity of excitatory INs was analyzed in (J) to (L). (J to L) Percentage of excitatory INs active over time (left y axis) and total percentage of INs activated (right y axis) in response to (J) GRP (n = 213 to 596 neurons per mouse, N = 3 mice), (K) octreotide (n = 213 to 596 neurons per mouse, N = 3 mice), or (L) SP (n = 186 to 450 neurons per mouse, N = 5 mice). (M) Ca2+ activity of SPBNs was analyzed in (N) to (P). (N to P) Percentage of SPBNs active over time (left y axis) and total percentage of SPBNs activated (right y axis) in response to (N) GRP (n = 6 to 14 SPBNs per mouse, N = 3 mice), (O) octreotide (n = 5 to 14 SPBNs per mouse, N = 3 mice), or (P) SP (n = 1 to 14 SPBNs per mouse, N = 3 mice). (Q) GRP, octreotide, or SP was administered intrathecally, and spontaneous scratching was quantified in 5-min bins (created with BioRender.com). (R to T) Time course of scratching (left y axis) and total scratch bouts (right y axis) elicited by (R) GRP (N = 15 mice), (S) octreotide (N = 8 mice), or (T) SP (N = 10 mice). [(J) to (L)], [(N) to (P)], and [(R) to (T)]: Data are shown as means ± SEM; error bars are not visible in (L) given the y axis range.
Fig. 2.
Fig. 2.. Diverse itch-causing peptides engage a convergent spinal neuron population.
(A) Models for how diverse itch-causing peptides culminate in scratching behavior. Different peptides may engage independent populations (left) or a convergent population of neurons (right). (B) Cell types visualized upon application of octreotide in the absence of TTX (SSTR-ds) and SP or GRP in the presence of TTX (NK1R direct, GRPR direct). (C) Ca2+ imaging traces and cell counts of neurons that responded to one or more itch peptides. (D) Extent of population overlap predicted if peptides acted on independent populations of neurons (left) versus the observed overlap of neurons activated by each peptide (right). (E) The percentage of overlap between GRPR, NK1R, and SSTR-ds neurons if they were independent populations (“theoretical”) compared to the observed overlap between populations. (F) GRPR, NK1R, and SSTR-ds populations overlap at frequencies much higher than expected by the prevalence of each cell type (n = 3367 total neurons, n = 236 to 599 neurons per mouse, N = 8 mice). Odds ratio (OR) analyses, Bonferroni correction. OR values for each cell type in gray. Data are shown as odds ratio estimate ± upper and lower 95% confidence interval (CI). *P < 0.05, ^^^P < 10−8, ^^^^P < 10−10. (G) The convergent itch population of spinal neurons is composed of GRPR neurons that respond to at least one other itch peptide, herein called GRPR itch peptide–responsive neurons. GRPR itch peptide–responsive neurons represent 26% of all GRPR neurons (n = 109 of 419 GRPR neurons pooled from N = 8 mice).
Fig. 3.
Fig. 3.. GRPR spinal neurons encode responses to cutaneous pruritogens.
(A and B) Strategy for visualizing excitatory superficial dorsal horn neuron activity evoked by intradermal injection of compound 48/80 (c48/80) using an ex vivo somatosensory preparation. (C) Experimental timeline. (D) Ca2+ activity of both INs and SPBNs was analyzed in (E) and (F). (E) Ca2+ traces from individual c48/80-responsive neurons. (F) Percentage of neurons activated over time (left y axis) and total percentage of neurons activated in response to c48/80 (right y axis) (n = 354 to 610 neurons per mouse, N = 3 mice). (G) c48/80 was administered intradermally, and scratching was quantified (created with BioRender.com). (H) Time course of scratching (left y axis) and total scratch bouts (right y axis) following c48/80 injection (N = 11 mice). (I) Ligands used to pharmacologically profile neurons and their cognate Gq-coupled receptors. (J) Ca2+ responses of c48/80-activated neurons activated by at least one GPCR ligand (n = 44 neurons, N = 1 mouse). Data are shown as means ± SD. (K) Percentage of c48/80-responsive neurons activated by GPCR ligands (n = 87 to 349 c48/80-responsive neurons per mouse, N = 3 mice). (L) GRPR is the only receptor associated with c48/80 responsiveness (n = 87 to 349 c48/80-responsive neurons per mouse, N = 3 mice). (M) Overlap between GRPR neurons and c48/80-responsive neurons (N = 3 mice). (N) GRPR itch–peptide responsive neurons are more likely to respond to c48/80 than other GRPR neurons. (O) Breakdown of c48/80-responsive neurons (n = 563 c48/80-responsive neurons pooled from N = 3 mice). (F), (H), and (K): Data are shown as means ± SEM. (L) and (N): Odds ratio analyses, Bonferroni correction where appropriate (L); data are shown as odds ratio estimate ± upper and lower 95% CI. ***P < 0.001.
Fig. 4.
Fig. 4.. GRPR SPBNs convey itch to the brain.
(A) Ca2+ activity of SPBNs was analyzed in (B) and (C). (B) Ca2+ traces from individual SPBNs that responded to intradermal injection of c48/80. (C) Percentage of SPBNs activated over time (left y axis), and total percentage of SPBNs activated in response to c48/80 (right y axis) (n = 5 to 14 SPBNs per mouse, N = 3 mice). (D) Percentage of c48/80-responsive SPBNs activated by ligands used for pharmacological profiling (n = 1 to 10 c48/80-responsive SPBNs per mouse, N = 3 mice). (E) Percentage of c48/80-responsive and c48/80 nonresponsive SPBNs that express GRPR (n = 29 SPBNs pooled from N = 3 mice). (F) Overlap between GRPR SPBNs and c48/80-responsive SPBNs (SPBNs pooled from N = 3 mice). (G) Most GRPR SPBNs that respond to c48/80 also respond to additional itch peptides (n = 11 GRPR+ c48/80-responsive SPBNs pooled from N = 3 mice). (H) Retrograde labeling of SPBNs for FISH. (I) SPBNs (Cre, white arrowheads) express Grpr, Tacr1, or both transcripts (red arrows). Scale bar, 50 μm. (J) Percentage of SPBNs that express Tacr1 versus Grpr mRNA. (n = 23 to 50 SPBNs per mouse, N = 3 mice). (K) Anterograde labeling of GRPR spinal projection neurons to visualize their central projections using Grpr-Cre mice (created with BioRender.com). (L and M) Grpr-Cre cell bodies at the site of viral injection in the lumbar spinal cord and ascending axons in the cervical spinal cord. Scale bars, 100 and 500 μm, respectively. (N to P) Grpr-Cre spinal projection neuron processes target the contralateral lPBN, ipsilateral lPBN, and RVM. Scale bars, 100 μm. (C), (D), and (J): Data are shown as means ± SEM.
Fig. 5.
Fig. 5.. Kappa opioids suppress itch behavior through inhibition of GRPR SPBNs.
(A) Experimental overview (created with BioRender.com). (B) Nalfurafine decreased scratching in response to c48/80 and chloroquine (CQ) (n = 9 to 11 mice per group). Student’s t test. (C) Experimental overview (created with BioRender.com). (D) Nalfurafine reduced scratching evoked by GRPR, SSTR, and NK1R agonists (n = 8 to 11 mice/group). Student’s t test. (E to H) Representative images and quantification of excitatory dorsal horn neurons (Vglut2) that express Oprk1 and either (E) Tacr1, (F) Grpr, (G) Tac1, or (H) Grp. Scale bar, 10 μm. Arrowhead, excitatory Oprk1 neuron; arrow: Tacr1, Grpr, Tac1, or Grp neuron; *triple-labeled neuron. (I) Percentage of Tacr1, Tac1, Grpr, and Grp neurons that coexpress Oprk1. N = 4 mice; neurons per mouse: Tacr1: n = 14 to 20, Tac1: n = 13 to 36, Grpr: n = 32 to 57, Grp: n = 18 to 36. (J) Approach for examining the effect of nalfurafine on excitatory spinal neuron activity. (K) Two potential sites of action for KOR inhibition of itch. (L) Ca2+ responses of GRPR SPBNs and GRPR itch peptide–responsive INs to c48/80 in the presence of aCSF versus nalfurafine (left) and number of neurons for each subtype/condition (right) (neurons pooled from N = 3 to 4 mice per condition). Blue bars, Ca2+ transients evoked by intradermal saline. Data shown as means and 10th through 90th percentile. (M) Nalfurafine inhibits Ca2+ responses of GRPR SPBNs but not GRPR itch peptide–responsive INs to c48/80 (GRPR+ SPBNs: aCSF, n = 12 neurons from N = 3 mice; nalfurafine, n = 14 neurons from N = 3 mice. GRPR itch peptide–responsive INs: aCSF, n = 172 neurons from N = 4 mice; nalfurafine, n = 126 neurons from N = 4 mice). Linear mixed-effect model, Bonferroni correction. Data shown as median and quartiles. (B) and (D): Data are shown as means ± SEM. *P < 0.05, **P < 0.01, ***P < 0.001.
Fig. 6.
Fig. 6.. Oprk1 and Grpr are coexpressed in SPBNs.
(A) Retrograde labeling of SPBNs for FISH. (B) SPBNs (Cre, white arrowheads) express Oprk1, Grpr, or both transcripts (red arrows). Scale bar, 25 μm. (C) Percentage of SPBNs in the superficial dorsal horn that express Oprk1 or Grpr. Shaded circles, experiment probed for Oprk1 only; white circles, experiment probed for both Oprk1 and Grpr (n = 19 to 51 SPBNs per mouse, N = 3 mice). Data are shown as means ± SEM. (D) Most Grpr SPBNs coexpress Oprk1 (n = 100 SPBNs pooled from N = 3 mice). (E) Anterograde labeling of KOR spinal projection neurons to visualize their central projections using Oprk1-Cre mice (created with BioRender.com). (F) Labeling of Oprk1-Cre cell bodies at the site of viral injection in the lumbar spinal cord. Scale bar, 50 μm. (G to K) Oprk1-Cre spinal projection neuron processes target the contralateral and ipsilateral lPBN, as well as the contralateral cVPL, PAG, and ION. Scale bars, 100 μm.
Fig. 7.
Fig. 7.. GRPR neurons can display persistent, cell-intrinsic Ca2+ oscillations.
(A) Application of GRP in the absence of TTX produces network-level activity in excitatory spinal neurons that express GRPR and those downstream of GRPR neuron activity. (B) Ca2+ traces showing GRP-induced Ca2+ repeated transients that persist after GRP is washed out. (C) Histogram of the duration of GRP-evoked network activity (n = 111 to 447 neurons per mouse, N = 3 mice). (D) Models for how oscillations could occur in response to GRP. Oscillations may be an intrinsic feature of GRPR neurons (left) or a consequence of ongoing circuit activity (right). (E) Application of GRP in the presence of TTX produces activity exclusively in neurons that express GRPR. (F) Ca2+ traces showing that GRP evokes prolonged oscillations in the presence of TTX. (G) Histogram of the duration of GRP-evoked activity in the presence of TTX (n = 65 to 87 neurons per mouse, N = 3 mice). (H) Criteria for defining Ca2+ oscillations. (I) Percentage of neurons that displayed Ca2+ transients versus Ca2+ oscillations in response to GPCR ligands applied in the presence of TTX (n = 275 to 694 neurons per mouse, N = 6 mice). (J) GRP, taltirelin, and SP induce Ca2+ oscillations in excitatory spinal neurons (n = 101 to 370 ligand-responsive neurons per mouse, N = 6 mice). (K and L) GRPR expression is the defining feature of cell types that show cell-intrinsic Ca2+ oscillations (n = 26 to 66 oscillating neurons per mouse, N = 6 mice). (M) Most neurons that display cell-intrinsic Ca2+ oscillations express GRPR (n = 249 oscillating neurons pooled from N = 6 mice). (C), (G), and (I): Data are shown as means ± SEM. (J) to (L): Odd ratio analyses were performed, with Bonferroni correction where appropriate (J); data are shown as odds ratio estimate ± upper and lower 95% CI. **P < 0.01, ***P < 0.001, ****P < 0.0001, ^^^^P < 10−10.

References

    1. Sun Y. G., Chen Z.-F., A gastrin-releasing peptide receptor mediates the itch sensation in the spinal cord. Nature 448, 700–703 (2007). - PubMed
    1. Kardon A. P., Polgár E., Hachisuka J., Snyder L. M., Cameron D., Savage S., Cai X., Karnup S., Fan C. R., Hemenway G. M., Bernard C. S., Schwartz E. S., Nagase H., Schwarzer C., Watanabe M., Furuta T., Kaneko T., Koerber H. R., Todd A. J., Ross S. E., Dynorphin acts as a neuromodulator to inhibit itch in the dorsal horn of the spinal cord. Neuron 82, 573–586 (2014). - PMC - PubMed
    1. Sukhtankar D. D., Ko M.-C., Physiological function of gastrin-releasing peptide and neuromedin b receptors in regulating itch scratching behavior in the spinal cord of mice. PLOS ONE 8, e67422 (2013). - PMC - PubMed
    1. Sheahan T. D., Warwick C. A., Fanien L. G., Ross S. E., The neurokinin-1 receptor is expressed with gastrin-releasing peptide receptor in spinal interneurons and modulates itch. J. Neurosci. 40, 8816–8830 (2020). - PMC - PubMed
    1. Huang J., Polgár E., Solinski H. J., Mishra S. K., P.-Y. Tseng, Iwagaki N., Boyle K. A., Dickie A. C., Kriegbaum M. C., Wildner H., Zeilhofer H. U., Watanabe M., Riddell J. S., Todd A. J., Hoon M. A., Circuit dissection of the role of somatostatin in itch and pain. Nat. Neurosci. 21, 707–716 (2018). - PMC - PubMed