. 2024 Sep 27;10(39):eadm9582.
doi: 10.1126/sciadv.adm9582. Epub 2024 Sep 25.

Skewed epithelial cell differentiation and premature aging of the thymus in the absence of vitamin D signaling

Affiliations

Skewed epithelial cell differentiation and premature aging of the thymus in the absence of vitamin D signaling

Patricio Artusa et al. Sci Adv. .

Abstract

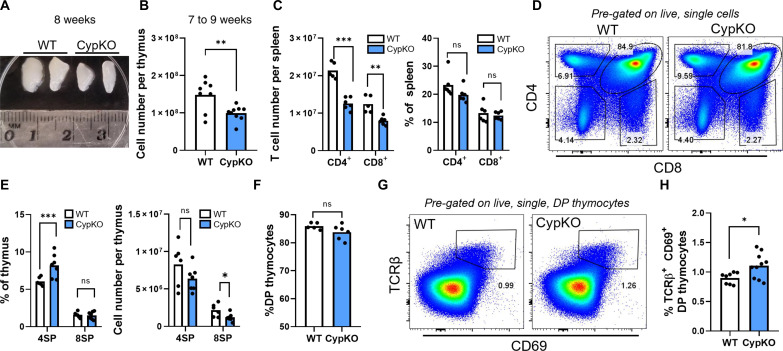
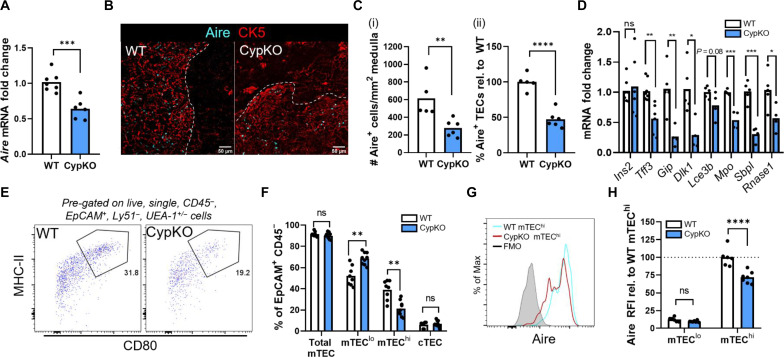
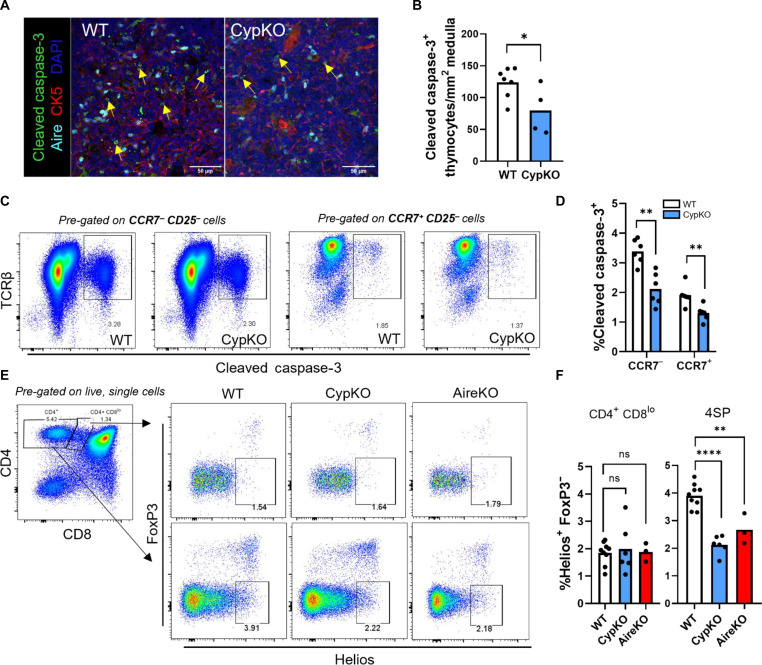
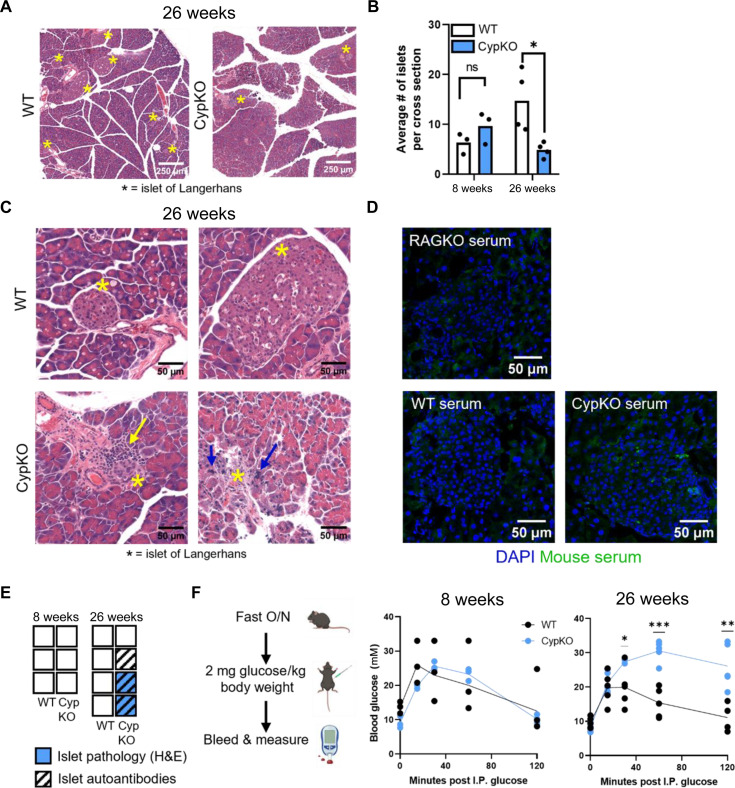
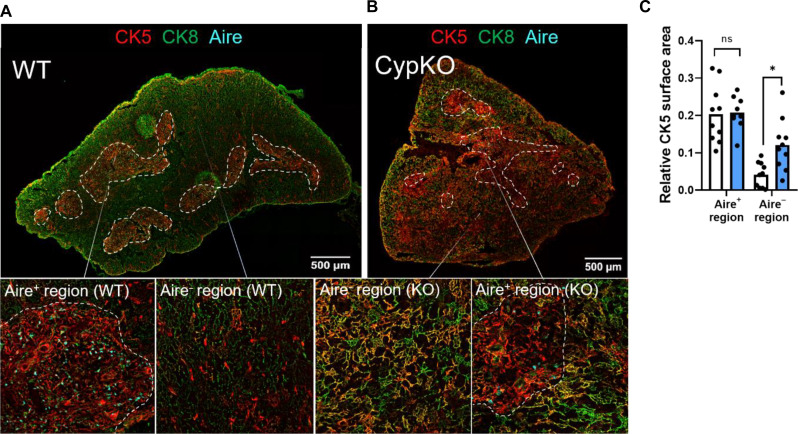
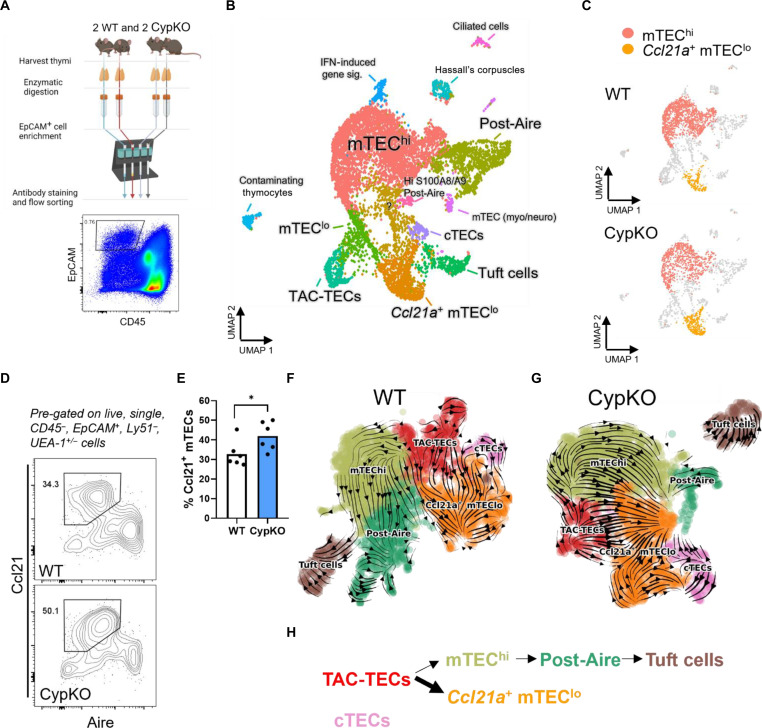
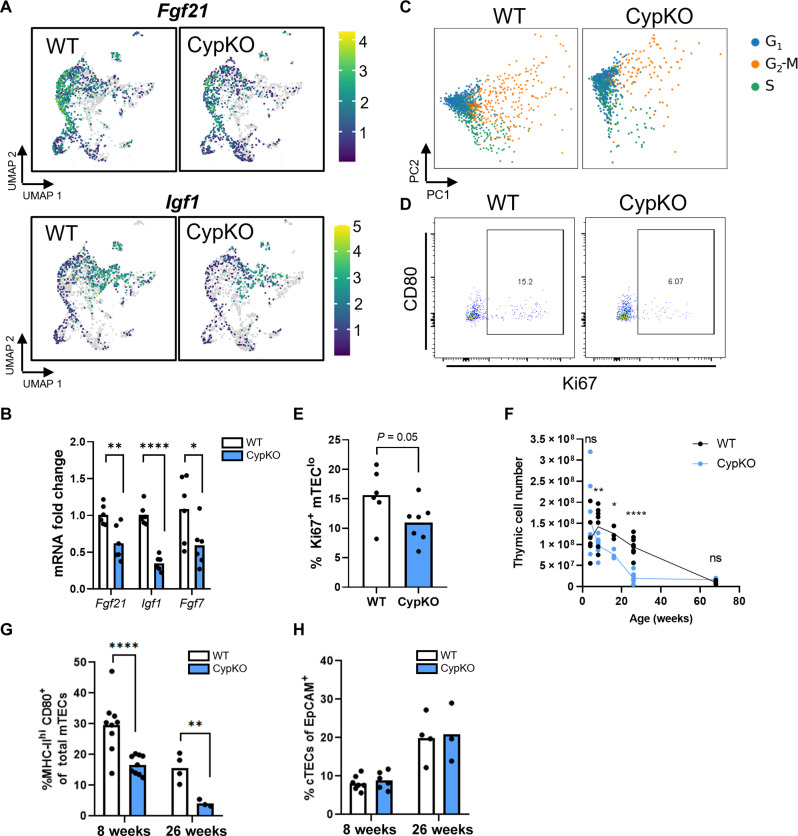
Central tolerance of thymocytes to self-antigen depends on the medullary thymic epithelial cell (mTEC) transcription factor autoimmune regulator (Aire), which drives tissue-restricted antigen (TRA) gene expression. Vitamin D signaling regulates Aire and TRA expression in mTECs, providing a basis for links between vitamin D deficiency and autoimmunity. We find that mice lacking Cyp27b1, which cannot produce hormonally active vitamin D, display profoundly reduced thymic cellularity, with a reduced proportion of Aire+ mTECs, attenuated TRA expression, and poorly defined cortical-medullary boundaries. Markers of T cell negative selection are diminished, and organ-specific autoantibodies are present in knockout (KO) mice. Single-cell RNA sequencing revealed that loss of Cyp27b1 skews mTEC differentiation toward Ccl21+ intertypical TECs and generates a gene expression profile consistent with premature aging. KO thymi display accelerated involution and reduced expression of thymic longevity factors. Thus, loss of thymic vitamin D signaling disrupts normal mTEC differentiation and function and accelerates thymic aging.


Figures

Fig. 1.
Fig. 1.. Reduced thymic cellularity and altered T cell development in CypKO mice.
(A) Representative picture of individual thymic lobes from two WT and CypKO 8-week-old female mice. (B) Total thymic cell number in 7- to 9-week-old mice. (C) Numbers of total CD4+ and CD8+ splenic T cells (left) and frequencies (right). (D to F) Representative flow cytometry plots of thymocyte development (D), quantification of single-positive (SP) thymocyte frequencies [(E), left] and numbers [(E), right)], and DP thymocyte frequencies (F). (G and H) Representative flow cytometry plots of post-selection DP thymocyte frequencies (G) and summary data (H). All experiments were performed with age-matched (male and female) 7- to 9-week-old mice. Each dot represents an individual mouse. ns, not significant. Statistics: Unpaired parametric t tests. *P < 0.05; **P < 0.01; ***P < 0.001.
Fig. 2.
Fig. 2.. Impaired mTEC differentiation and Aire expression in CypKO mice.
(A) qPCR detection of Aire mRNA expression in WT versus CypKO mice. (B and C) Zoomed-in IF microscopy images showing Aire + cells in WT versus CypKO thymi (B) and quantification from the entire thymic cross sections (C) (white dashed line denotes the cortico-medullary boundary). (D) qPCR detection of Aire-dependent TRA gene expression in WT versus CypKO thymi. (E) Representative flow cytometry plots of mTEChi cells (MHC-IIhi CD80+) in WT versus CypKO thymi. (F) Quantification of cTEC and mTEC frequencies in WT versus CypKO samples by flow cytometry. (G) Representative flow cytometry plot of Aire expression in WT versus CypKO mTEChi cells. (H) Quantification of Aire expression in mTEClo and mTEChi cells, relative to the average MFI of Aire in WT mTEChi cells. All experiments were performed with age-matched (male and female) 8- to 12-week-old mice. Each dot represents an individual mouse. Statistics: Unpaired parametric t tests. *P < 0.05; **P < 0.01; ***P < 0.001; ****P < 0.0001.
Fig. 3.
Fig. 3.. Decreased thymocyte apoptosis in CypKO mice.
(A and B) IF microscopy images of cleaved caspase-3 staining in the thymic medulla in small CK5 cells (A) and quantification of positive cell density (B) in WT versus CypKO from the entire thymic cross sections. (C and D) Representative flow cytometry plots of cleaved caspase-3+ cells in WT versus CypKO CCR7 CD25 (left) or CCR7+ CD25 thymocytes (right) (C) and quantification of cleaved caspase-3+ thymocytes (D). (E and F) Representative flow cytometry plots of Helios+ FoxP3 CD4+ CD8lo (top) or 4SP (bottom) thymocytes in WT versus CypKO or Aire KO thymi (E) and summary data (F). All experiments were performed with age-matched (male and female) 8- to 12-week-old mice. Each dot represents an individual mouse. Statistics: Unpaired parametric t tests. *P < 0.05; **P < 0.01; ****P < 0.0001.
Fig. 4.
Fig. 4.. Evidence of disrupted pancreatic function and islet pathology in aged CypKO mice.
(A) Representative H&E images of pancreases from 26-week-old WT and CypKO mice. Islets are marked with an asterisk. (B) Quantification of the average number of islets from duplicate whole-tissue cross section scans from 8- and 26-week-old WT and CypKO mice. (C) High-magnification images of WT or CypKO islets from duplicate mice. Immune cell infiltration is indicated with a yellow arrow, and pycnotic nuclei are indicated with blue arrows. (D) Representative images of autoantibody staining of islets with 26-week-old CypKO, WT, or Rag1KO serum samples. (E) Summary of indicated phenotypes in each mouse. Empty boxes indicate that no pathology or autoantibody staining was observed. (F) Experimental design for the glucose tolerance test (left) and blood glucose levels in 8- or 26-week-old WT versus CypKO mice after intraperitoneal (I.P.) glucose administration. All experiments were performed with age-matched (male or female) 8- or 26-week-old mice, except for histology for aged animals, which was performed on male mice exclusively. O/N, overnight. Statistics: Each dot represents an individual mouse. Unpaired parametric t tests. *P < 0.05; **P < 0.01; ***P < 0.001.
Fig. 5.
Fig. 5.. Disorganized thymic architecture in CypKO mice.
(A) Representative images of a WT thymic cross section with Aire staining restricted to areas of concentrated CK5 staining (medulla). (B) Representative images of a CypKO thymic cross section showing disseminated CK5 staining in Aire regions. (C) Quantification of CK5 staining in the medulla (defined as Aire+ regions) and cortex (defined as Aire regions). All experiments were performed with age-matched (male and female) 8- to 12-week-old mice. Each dot represents an individual mouse. Statistics: Unpaired parametric t tests. *P < 0.05.
Fig. 6.
Fig. 6.. Divergent mTEC differentiation in CypKO mice.
(A) Schematic of single-cell RNA-seq sample preparation from duplicate littermate mice. (B) Cluster annotation of integrated Seurat object containing all four samples, based on differential gene expression. IFN, interferon. (C) Comparison of WT and CypKO clusters densities; mTEChi and Ccl21a+ mTEClo are highlighted. (D and E) Validation of increased Ccl21+ mTECs in CypKO thymi by flow cytometry (D) and summary data (E). Each dot represents an individual mouse (age-matched, male and female). (F and G) RNA velocity plots of WT (F) and CypKO (G) samples; arrows point toward the direction of predicted differentiation based on RNA splicing dynamics. (H) Schematic of altered mTEC differentiation in CypKO mice. Statistics: Unpaired parametric t tests. *P < 0.05.
Fig. 7.
Fig. 7.. Accelerated thymic involution in CypKO mice.
(A) UMAPs indicating decreased expression of pro-longevity factors Fgf21, Fgf7, and Igf1 in CypKO TECs. (B) Validation of thymic involution related gene expression. (C) Cell cycle phase scoring for representative WT and CypKO TECs. (D and E) Flow cytometry analysis of Ki67+ in mTEClo cells. (F) Total thymic cell counts from young to old mice showing accelerated involution in CypKO samples. (G) Frequency of mTEChi cells of total mTECs. (H) Frequency of cTECs of total TECs. All experiments were repeated at least twice with age-matched (male and female) mice. Each dot represents an individual mouse. Statistics: Unpaired parametric t tests. *P < 0.05; **P < 0.01; ****P < 0.0001.

References

    1. Klein L., Kyewski B., Allen P. M., Hogquist K. A., Positive and negative selection of the T cell repertoire: What thymocytes see (and don’t see). Nat. Rev. Immunol. 14, 377–391 (2014). - PMC - PubMed
    1. Kadouri N., Nevo S., Goldfarb Y., Abramson J., Thymic epithelial cell heterogeneity: TEC by TEC. Nat. Rev. Immunol. 20, 239–253 (2020). - PubMed
    1. Liang Z., Dong X., Zhang Z., Zhang Q., Zhao Y., Age-related thymic involution: Mechanisms and functional impact. Aging Cell 21, e13671 (2022). - PMC - PubMed
    1. Wu H., Qin X., Dai H., Zhang Y., Time-course transcriptome analysis of medullary thymic epithelial cells in the early phase of thymic involution. Mol. Immunol. 99, 87–94 (2018). - PubMed
    1. Bornstein C., Nevo S., Giladi A., Kadouri N., Pouzolles M., Gerbe F., David E., Machado A., Chuprin A., Toth B., Goldberg O., Itzkovitz S., Taylor N., Jay P., Zimmermann V. S., Abramson J., Amit I., Single-cell mapping of the thymic stroma identifies IL-25-producing tuft epithelial cells. Nature 559, 622–626 (2018). - PubMed

Publication types