

Crowd-sourced machine learning prediction of long COVID using data from the National COVID Cohort Collaborative
- PMID: 39321500
- PMCID: PMC11462169
- DOI: 10.1016/j.ebiom.2024.105333
Crowd-sourced machine learning prediction of long COVID using data from the National COVID Cohort Collaborative
Abstract
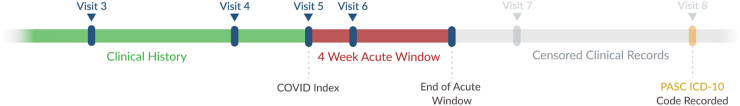
Background: While many patients seem to recover from SARS-CoV-2 infections, many patients report experiencing SARS-CoV-2 symptoms for weeks or months after their acute COVID-19 ends, even developing new symptoms weeks after infection. These long-term effects are called post-acute sequelae of SARS-CoV-2 (PASC) or, more commonly, Long COVID. The overall prevalence of Long COVID is currently unknown, and tools are needed to help identify patients at risk for developing long COVID.
Methods: A working group of the Rapid Acceleration of Diagnostics-radical (RADx-rad) program, comprised of individuals from various NIH institutes and centers, in collaboration with REsearching COVID to Enhance Recovery (RECOVER) developed and organized the Long COVID Computational Challenge (L3C), a community challenge aimed at incentivizing the broader scientific community to develop interpretable and accurate methods for identifying patients at risk of developing Long COVID. From August 2022 to December 2022, participants developed Long COVID risk prediction algorithms using the National COVID Cohort Collaborative (N3C) data enclave, a harmonized data repository from over 75 healthcare institutions from across the United States (U.S.).
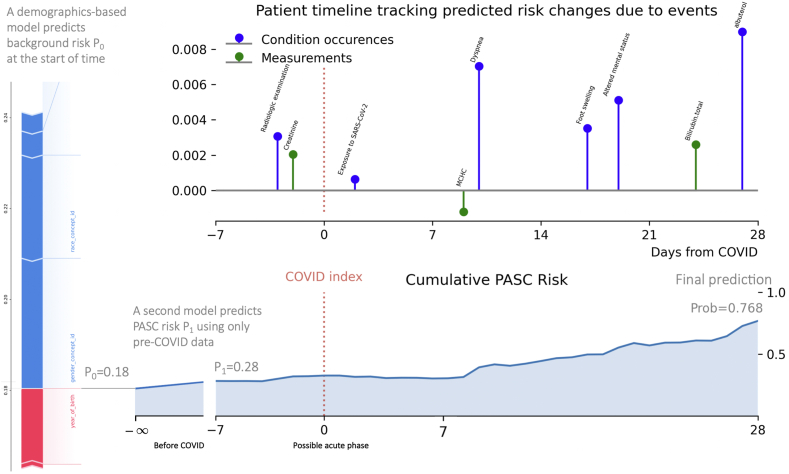
Findings: Over the course of the challenge, 74 teams designed and built 35 Long COVID prediction models using the N3C data enclave. The top 10 teams all scored above a 0.80 Area Under the Receiver Operator Curve (AUROC) with the highest scoring model achieving a mean AUROC of 0.895. Included in the top submission was a visualization dashboard that built timelines for each patient, updating the risk of a patient developing Long COVID in response to clinical events.
Interpretation: As a result of L3C, federal reviewers identified multiple machine learning models that can be used to identify patients at risk for developing Long COVID. Many of the teams used approaches in their submissions which can be applied to future clinical prediction questions.
Funding: Research reported in this RADx® Rad publication was supported by the National Institutes of Health. Timothy Bergquist, Johanna Loomba, and Emily Pfaff were supported by Axle Subcontract: NCATS-STSS-P00438.
Keywords: COVID-19; Community challenge; Evaluation; Long COVID; Machine learning; PASC.
Copyright © 2024 The Authors. Published by Elsevier B.V. All rights reserved.
Conflict of interest statement
Declaration of interests Danielle Mowery serves as an unpaid member of the Epic Cosmos Governing Council. Romain Pirracchio received funding from the FDA CERSI grant U01FD005978 and the PCORI grant P0562155 and received a consulting honorarium from Phillips. Martin van der Laan received funding from the NIAID grant 5R01AI074345. Johanna Loomba received contract funding from the NIH RECOVER program. Emily Pfaff received funding from the NIH and PCORI. The views expressed in this manuscript are solely those of the authors and do not necessarily represent those of the National Institutes of Health, the U.S. Department of Health and Human Services or the U.S. government. Qi Long was supported by grants from the NIH.
Figures

References
-
- National Center for Health Statistics . Long COVID; 2023. U.S. Census Bureau, household pulse survey, 2022–2023.https://www.cdc.gov/nchs/covid19/pulse/long-covid.htm
-
- CDC . Centers for Disease Control and Prevention; 2023. Long COVID or post-COVID conditions.https://www.cdc.gov/coronavirus/2019-ncov/long-term-effects/index.html
MeSH terms
LinkOut - more resources
Full Text Sources
Medical
Research Materials
Miscellaneous
