. 2024 Oct 31;187(22):6327-6345.e20.
doi: 10.1016/j.cell.2024.08.038. Epub 2024 Sep 24.

Microbial transformation of dietary xenobiotics shapes gut microbiome composition

Affiliations

Microbial transformation of dietary xenobiotics shapes gut microbiome composition

Elizabeth J Culp et al. Cell. .

Abstract

Diet is a major determinant of gut microbiome composition, and variation in diet-microbiome interactions may contribute to variation in their health consequences. To mechanistically understand these relationships, here we map interactions between ∼150 small-molecule dietary xenobiotics and the gut microbiome, including the impacts of these compounds on community composition, the metabolic activities of human gut microbes on dietary xenobiotics, and interindividual variation in these traits. Microbial metabolism can toxify and detoxify these compounds, producing emergent interactions that explain community-specific remodeling by dietary xenobiotics. We identify the gene and enzyme responsible for detoxification of one such dietary xenobiotic, resveratrol, and demonstrate that this enzyme contributes to interindividual variation in community remodeling by resveratrol. Together, these results systematically map interactions between dietary xenobiotics and the gut microbiome and connect toxification and detoxification to interpersonal differences in microbiome response to diet.

Keywords: community composition; dietary xenobiotics; emergent interactions; gnotobiotics; microbial metabolism; microbiome.


Conflict of interest statement

Declaration of interests A.L.G. serves on the scientific advisory boards of Seres Therapeutics, Taconic Biosciences, and Piton Therapeutics.

Figures

Figure 1.
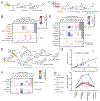
Figure 1.. See also Figure S1, Table S1, Table S2. Dietary xenobiotics are variably metabolized by gut microbiome communities and can inhibit growth of gut commensals.
(A) Ex vivo incubation of 29 human fecal samples (MV collection), plus a pH 5 control, with 22 dietary xenobiotics and their metabolites illustrates interindividual variability in compound metabolism. Levels of each compound after incubation with each community at 10-20 μM were determined by LC-MS and normalized to ion abundance in sterile media controls (‘-’). Compounds related through microbial transformation are indicated by arrows. Mean of triplicate incubations is shown. A pH 5 control is also indicated. (B) Compound classes represented in a library of 161 dietary xenobiotics. (C) Growth of 26 gut commensal species in the presence of each dietary xenobiotic in the library (200 μM). Growth is normalized to the interquartile mean across all compounds for that species. Mean of two technical replicates is shown. (D) Histogram of the number of species inhibited by each dietary xenobiotic. Compounds that inhibit two or more species are highlighted in orange and summarized in the pie chart.
Figure 2.
Figure 2.. See also Figure S2, Table S3. Mapping remodelling of human gut microbial communities by dietary xenobiotics.
(A) Experimental setup for surveying the effects of 140 dietary xenobiotics on the composition of four gut microbiome communities. (B) Schematic of β-diversityreplicates and β-diversityvsDMSO calculations. Each circle represents a single replicate. (C) β-diversityreplicates across 140 dietary xenobiotics in each community. A line is drawn at the mean, and error bars represent standard deviation. Outlier replicates with high β-diversityreplicates were removed from further analysis. (D) Index plots show the β-diversityvsDMSO of each community treated with each of the 140 dietary xenobiotics. Dashed lines represent cut-offs based on mean and standard deviation of β-diversityreplicates in B. See methods for details. (E) Violin plot of ten dietary xenobiotics that remodel all four communities (β-diversityvsDMSO > 0.41). Inter-community β-diversity is also shown for each pair of DMSO-treated communities. Toxicity is represented as a heatmap representing average normalized growth of 26 species in the presence of each compound (Figure 1C). (F) Correlation between β-diversityvsDMSO and weighted toxicity. Each point represents a given community treated with a given compound. r2 value represents two-sided Pearson correlation. Weighted toxicity is a measure that captures growth inhibition of individual species in monoculture by a compound (as in Figure 1C), weighted according to the relative abundance of related taxa in each community (Figure S2F). In D and F, comparisons to communities from unrelated human donors are indicated by stars. In D, E and F, mean of β-diversityvsDMSO is plotted (5 DMSO replicates x 3 dietary xenobiotic replicates = 15).
Figure 3.
Figure 3.. See also Table S4, Table S5. Predicted and emergent interactions between dietary xenobiotics and community composition.
(A to B) For each dietary xenobiotic, the fold change in relative abundance of bacterial classes within each community is compared to the average toxicity of the compound towards representative species in this class. (A) For ten compounds that remodel all four tested communities, the taxa that change in relative abundance is predicted by the spectrum of toxicity of the compound towards each bacterial class. (B) Examples of emergent interactions in which toxic effects of a compound on individual species in monoculture do not predict community remodeling. (C) Response of 26 species in a 38-member defined community and in monoculture to the presence of each of 140 dietary xenobiotics. Each point represents the normalized growth of a species treated with the given compound in monoculture (from Figure 1C) versus its fold change relative abundance (versus DMSO) in the 38-member community. Histograms along the x- and y-axes demonstrate gaussian distributions that define cut-offs for predicted or emergent interactions, as indicated. Dietary xenobiotics falling into each category are listed in (D). Metabolism of the dietary xenobiotic by the defined community, normalized to a sterile media control, is represented by color shading in C and D. For all panels, mean of triplicate incubations is shown.
Figure 4.
Figure 4.. See also Figure S3. Toxification and detoxification of dietary xenobiotics by the gut microbiome.
(A) Model for microbiome-mediated toxification and detoxification of dietary xenobiotics. (B) Experimental workflow for generation and characterization of extracts from microbial communities incubated with dietary xenobiotics. (C to D) Normalized growth of indicator species (versus DMSO) with extracts prepared from communities labelled along the top and dietary xenobiotics labelled along the left. (C) For 11 of 94 dietary xenobiotics tested, extracts prepared from incubation of the compound with at least one community inhibited the growth of at least one indicator species (<40% growth). Extracts of compounds alone (columns labeled with ‘-’) and communities alone (DMSO row) did not inhibit growth of these indicator species, apart from examples of inhibition of B. thetaiotaomicron and E. limosum. (D) Toxification of the eleven compounds in (C) by 29 human fecal microbial communities. Bar graphs along the right indicate the IC50 of these dietary xenobiotics and their metabolites, colored according to the scheme in C. (E) Relationship between normalized growth of an indicator species and the detection of toxic aglycones. Each point represents an individual extract prepared from a different MV community. The mean growth of technical duplicates is plotted on the y-axis. (F) Examples of compounds where incubation with 29 human communities never results in toxification, since toxic aglycone forms are invariably detoxified through microbial metabolism, as shown in Figure S3B. For normalized growth in C, D and F, mean of two independent extract preparations followed by two independent growth measurements (total of n = 4) is shown; ‘D’ indicates defined community and ‘-’ indicates sterile media.
Figure 5.
Figure 5.. See also Figure S4, Figure S5. Microbial metabolism links community remodelling with dietary xenobiotic toxicity.
(A-B) Polydatin, (C-D) hesperidin, and (E-F) stevioside remodel 8-10 membered defined communities in vitro. (A, C, E) Metabolic pathways and metabolizing species. (B, D, F) Fold change relative abundance versus DMSO of each species (columns) after introduction of these xenobiotics or their metabolites (rows). Full species names are provided in Table S2. Mean of four replicate incubations is shown, and statistically significant differences compared to the DMSO control are indicated (*p<0.05, **p<0.01, ***p<0.001, ****p<0.0001; two-way ANOVA with Tukey’s post-hoc analysis). (G) Correlation between β-diversityvsDMSO and resveratrol exposure over 48 hr for 25 complex human fecal communities incubated in vitro with 200 μM resveratrol. r2 value indicates Pearson correlation. (H) Addition of E. lenta modulates community remodeling in response to polydatin or resveratrol. (G) Mean and standard deviation of three replicate incubations was measured for ion abundance (resveratrol exposure). (G and H) Mean and standard deviation of β-diversity between two compounds with three replicates each (DMSO vs DMSO: n = 3; Polydatin/Resveratrol vs DMSO or Polydatin vs Resveratrol: n = 3 x 3 = 9) is shown.
Figure 6.
Figure 6.. See also Figure S6, Table S6. Identification of a resveratrol reductase in Coriobacteriia.
(A) Cell-free lysates generated from E. lenta grown in the presence or absence of 100 μM resveratrol were tested for their ability to reduce resveratrol to dihydroresveratrol. Incubations of cell-free lysates in aerobic or anaerobic conditions is indicated. Mean and standard deviation of duplicates is shown. (B) A volcano plot shows differential transcript abundance, determined by RNAseq, for E. lenta grown in the presence of 100 μM resveratrol or vehicle (DMF – dimethylformamide). (C) The ability of various species or strains to metabolize resveratrol to dihydroresveratrol was measured by in vitro incubation and LCMS. Ion intensity is normalized to the sterile medium control. G. urolithinfaciens includes an empty vector control (pXD68) or a vector carrying Elen_288-289 (pXD68-288-289); Elen_289 is a putative transcriptional regulator that activates the expression of Elen_288 in response to resveratrol. (D) Phylogenetic tree of 96 Coriobacteriial strains with the presence of Elen_288 homologs indicated by black dots. (E) Correlation between the abundance of Elen_288 and the abundance of E. lenta in 29 MV communities grown in vitro, as determined by qPCR using gene and species specific primers. (F) Correlation between the abundance of resveratrol reductase homologs associated with different genera (Eggerthella, Adlercreutzia, Raoultibacter) and the rate of resveratrol metabolism (as in Figure 5G) by 29 MV communities incubated in vitro. For E and F, Pearson correlation is shown. For C, E, and F, mean and standard deviation of three replicate incubations is shown.
Figure 7.
Figure 7.. See also Figure S7, Table S7. Metabolism of resveratrol by gut microbes dictates community remodelling by polydatin in vivo.
(A-C) A defined community is remodelled by polydatin in gnotobiotic mice. (A) Experimental design using defined communities as in Figure 5B. (B) The concentration of resveratrol and dihydroresveratrol in feces collected at 0 hr, 6 hr, or 9 hr time points daily during polydatin treatment. Points represent 5 days of treatment with 5 mice (Base community: n = 25) or 3 mice (Base community + E. lenta: n = 15). (C) Relative abundance of E. coli in feces during PBS or polydatin treatment. Significance is tested compared to Day 1 at 0 hr for the base community (n = 5 mice) or base community + E. lenta (n = 3 mice). (D) Relationship between Adlercreutzia resveratrol reductase gene abundance and resveratrol metabolism in ex-germfree mice colonized with fecal microbial communities from 7 human donors. Each point represents an individual mouse with gene abundance measured across 4 days. Pearson correlation is shown. (E-G) Impact of polydatin on the microbiomes of ex-germfree mice colonized with either MV18 or MV20. (E-F) β-diversityvs0hr is calculated between the 0 hr and 6 hr time points, or 0 hr and 9 hr time points on the same day. In (E), significant differences between MV18 β-diversityvs0hr and MV20 β-diversityvs0hr at each time point is indicated (n = 5 mice/group). In (F), significant differences between PBS and polydatin treatment periods is indicated. Points represent 5 mice across 2 days of PBS treatment (n = 10; green) or 5 mice across 3 days of polydatin treatment (n = 15; pink). (G) Change in relative abundance of B. uniformis or A. insulae during PBS or polydatin treatment. Significant changes in relative abundance were determined by comparison to Day 1 at 0hr (n = 5 mice/group). For all panels, mean and standard deviation is shown. Significance is tested using one-way (B, C) or two-way ANOVA (E, F, G) with Tukey’s (B), Bonferroni’s (E, F) or Dunnett’s (C, G) post-hoc analysis. *p<0.05, **p<0.01, ***p<0.002, ****p<0.0001.

References

    1. Qin J, Li R, Raes J, Arumugam M, Burgdorf KS, Manichanh C, Nielsen T, Pons N, Levenez F, Yamada T, et al. (2010). A human gut microbial gene catalogue established by metagenomic sequencing. Nature 464, 59–65. 10.1038/nature08821. - DOI - PMC - PubMed
    1. Wang Z, Klipfell E, Bennett BJ, Koeth R, Levison BS, DuGar B, Feldstein AE, Britt EB, Fu X, Chung Y-M, et al. (2011). Gut flora metabolism of phosphatidylcholine promotes cardiovascular disease. Nature 472, 57–63. 10.1038/nature09922. - DOI - PMC - PubMed
    1. Karlsson FH, Fåk F, Nookaew I, Tremaroli V, Fagerberg B, Petranovic D, Bäckhed F, and Nielsen J (2012). Symptomatic atherosclerosis is associated with an altered gut metagenome. Nat. Commun 3, 1245. 10.1038/ncomms2266. - DOI - PMC - PubMed
    1. Franzosa EA, Sirota-Madi A, Avila-Pacheco J, Fornelos N, Haiser HJ, Reinker S, Vatanen T, Hall AB, Mallick H, McIver LJ, et al. (2018). Gut microbiome structure and metabolic activity in inflammatory bowel disease. Nat. Microbiol 4, 293–305. 10.1038/s41564-018-0306-4. - DOI - PMC - PubMed
    1. Qin J, Li Y, Cai Z, Li S, Zhu J, Zhang F, Liang S, Zhang W, Guan Y, Shen D, et al. (2012). A metagenome-wide association study of gut microbiota in type 2 diabetes. Nature 490, 55–60. 10.1038/nature11450. - DOI - PubMed

LinkOut - more resources