. 2024 Oct 29;34(10):1540-1552.
doi: 10.1101/gr.279415.124.

Mutational scanning of CRX classifies clinical variants and reveals biochemical properties of the transcriptional effector domain

Affiliations

Mutational scanning of CRX classifies clinical variants and reveals biochemical properties of the transcriptional effector domain

James L Shepherdson et al. Genome Res. .

Abstract

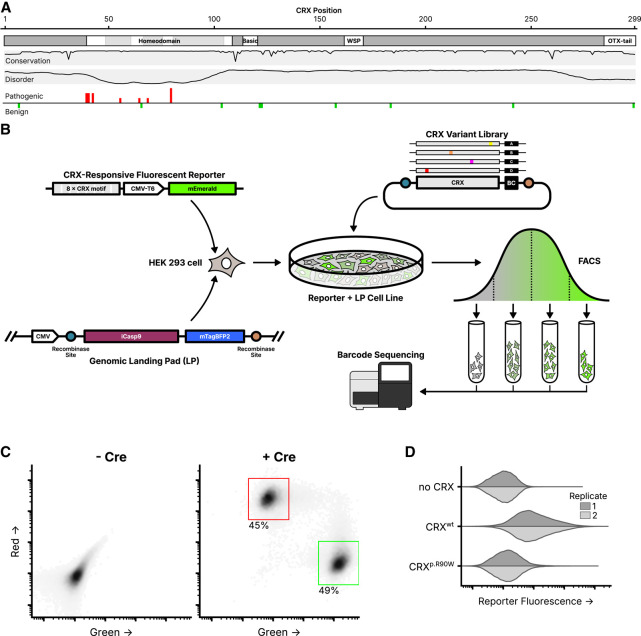
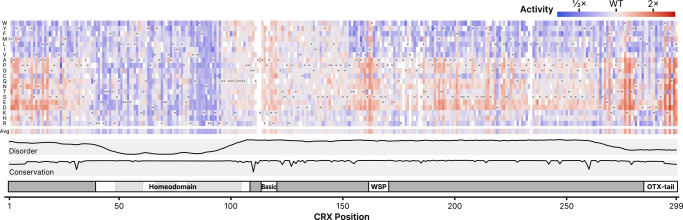
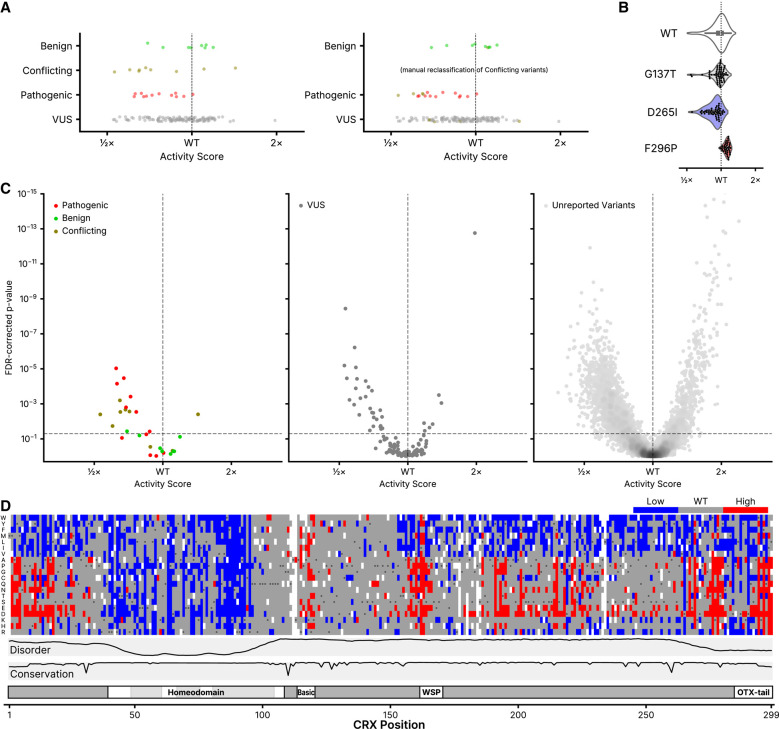
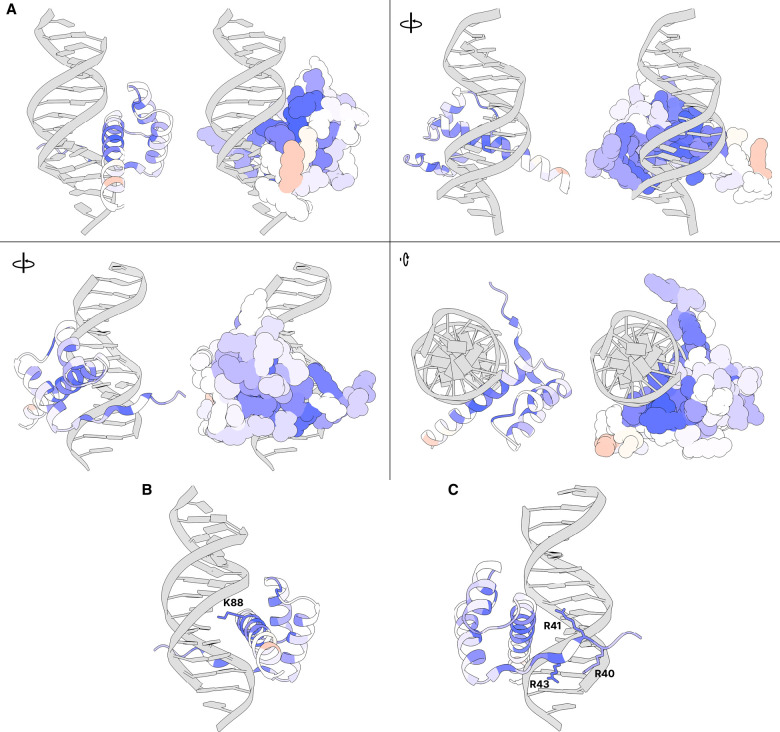
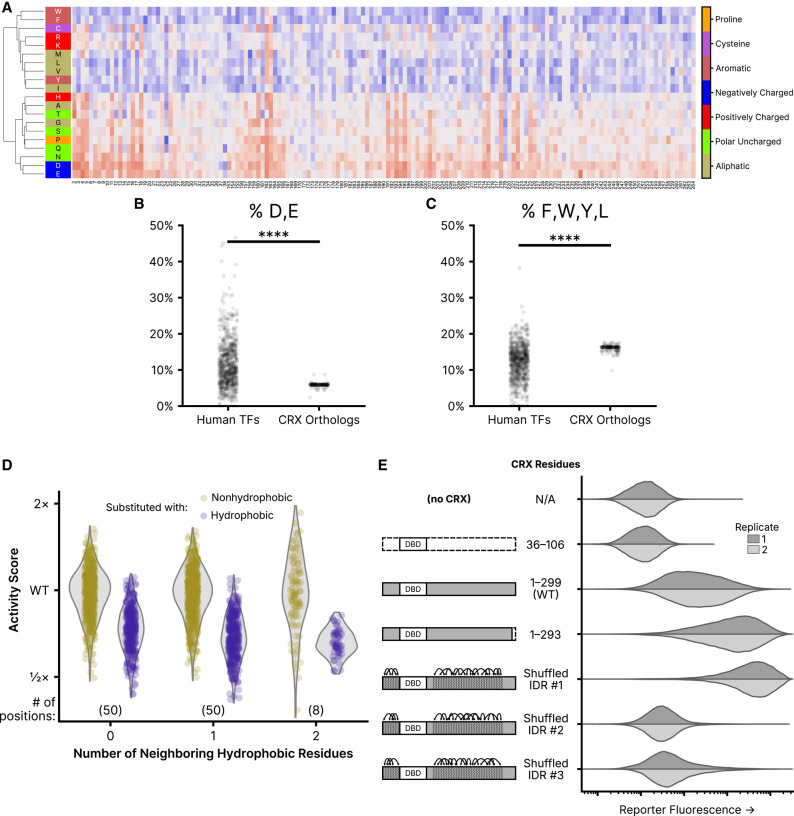
The transcription factor (TF) cone-rod homeobox (CRX) is essential for the differentiation and maintenance of photoreceptor cell identity. Several human CRX variants cause degenerative retinopathies, but most are variants of uncertain significance. We performed a deep mutational scan (DMS) of nearly all possible single amino acid substitutions in CRX using a cell-based transcriptional reporter assay, curating a high-confidence list of nearly 2000 variants with altered transcriptional activity. In the structured homeodomain, activity scores closely aligned to a predicted structure and demonstrated position-specific constraints on amino acid substitution. In contrast, the intrinsically disordered transcriptional effector domain displayed a qualitatively different pattern of substitution effects, following compositional constraints without specific residue position requirements in the peptide chain. These compositional constraints were consistent with the acidic exposure model of transcriptional activation. We evaluated the performance of the DMS assay as a clinical variant classification tool using gold-standard classified human variants from ClinVar, identifying pathogenic variants with high specificity and moderate sensitivity. That this performance could be achieved using a synthetic reporter assay in a foreign cell type, even for a highly cell type-specific TF like CRX, suggests that this approach shows promise for DMS of other TFs that function in cell types that are not easily accessible. Together, the results of the CRX DMS identify molecular features of the CRX effector domain and demonstrate utility for integration into the clinical variant classification pipeline.


Figures

Figure 1.
Figure 1.
Experimental overview of the CRX deep mutational scan. (A) Known CRX domains, sequence conservation, predicted disorder, and reported ClinVar missense variants. Per-residue conservation was computed using sequences from the UniProt UniRef50 cluster derived from human CRX. Disorder predicted with Metapredict (Emenecker et al. 2021). Missense pathogenic variants (“Pathogenic” and/or “Likely pathogenic”) and benign variants (“Benign” and/or “Likely Benign”) from ClinVar (accessed June 2024); height of bar proportional to number of variants at each position (max = 3). (B) Schematic of the CRX deep mutational scan. A clonal cell line carrying a CRX-responsive fluorescent reporter and genomic landing pad (LP) was generated, and a library of CRX variants was integrated into the LP so that each cell expresses a single variant. Following fluorescence-activated cell sorting (FACS), sequencing was used to determine relative variant barcode abundances in each fluorescence bin, allowing for the calculation of a reporter activity score. (C) LP cells integrated with a 1:1 ratio of plasmids carrying mEmerald (green; arbitrary units) or mCherry2 (red; arbitrary units), with or without a plasmid expressing Cre recombinase (60,000 cells plotted per condition, points shaded by density, percent of cells falling within the indicated gates shown). (D) Reporter activation (green fluorescence; arbitrary units) was measured in Reporter + LP cells with the indicated CRX variants integrated. Two independent biological replicate experiments per sample (distributions plotted from 40,000 cells).
Figure 2.
Figure 2.
DMS activity scores for all measured single amino acid CRX substitutions. Activity scores were normalized to wild-type CRX; the wild-type amino acid at each position is indicated by the gray circle in each column. The average row shows the mean activity score for all substitutions at each position. Disorder, domains, and conservation are shown as in Figure 1. Empty boxes indicate variants not measured in the DMS assay, due to drop-out during the library cloning or variant measurement steps. An interactive version of this figure is available in Supplemental Interactive S1.
Figure 3.
Figure 3.
Classification of CRX variants. (A) DMS activity scores for variants reported to ClinVar in each of the indicated classes (Pathogenic includes “Pathogenic” and/or “Likely pathogenic”; Benign includes “Benign” and/or “Likely Benign”). On the right, “Conflicting” variants are shown reclassified based on the modal reported ClinVar classification. (B) Barcode-level activity measurements for wild-type CRX and the indicated representative wild-type-like (p.G137T), low-activity (p.D265I), and high-activity (p.F296P) variants. Each black dot represents a unique barcoded construct; not shown for wild-type CRX due to it being barcoded thousands of times. (C) Volcano plots showing classifications for the indicated ClinVar variants (left and middle panels) or all other variants not yet reported in ClinVar (right panel). FDR-corrected P-values were computed from a two-sample K–S test comparing each variant's barcode-level measurements to those of wild-type CRX, as visualized in (B). The horizontal line corresponds to an FDR-corrected P-value of 0.05; the vertical line corresponds to a normalized activity score of 1 (wild-type). For visualization purposes, the y-axis is clipped to 10−15; 13 variants are hidden with activity scores greater than wild-type and P-values up to 10−26. (D) Quantized DMS activity scores for each variant, coloring low- and high-activity variants using the significance cutoffs shown as dotted lines in (C). Disorder, domains, and conservation are shown as in Figure 1.
Figure 4.
Figure 4.
Average DMS activity scores superimposed on a predicted structure of the CRX homeodomain in complex with DNA. (A) Various views of residues 38–104 of an AlphaFold predicted structure of CRX aligned to a crystal structure of Drosophila paired in complex with DNA (PDB 1FJL) (Wilson et al. 1995). For each view, a cartoon ribbon model is shown on the left and a space-filling atomic model is on the right. Supplemental Movie S1 animates a 360° rotation of this structure. (B) Close-up of residues in the major groove with K88 highlighted (side chain shown). (C) Close-up of minor groove-contacting residues with arginine residues highlighted (side chains shown). In all panels, residues are colored by the average DMS activity score, as shown in the “Average” track in Figure 2.
Figure 5.
Figure 5.
Residue class preferences in the CRX transcriptional effector domain. (A) Unsupervised hierarchical clustering (UPGMA method) of per-position activity scores for residues in the disordered region of the transcriptional effector domain (residues 2–38 and 153–264). Residues colored by class. Substitution activity scores are colored as in Figure 2. (B) Abundance of aspartic acid (D) and glutamic acid (E) residues in disordered regions of all human TFs and CRX orthologs. (C) The abundance of phenylalanine (F), tryptophan (W), tyrosine (Y), and leucine (L) residues in disordered regions of all human TFs and CRX orthologs. For (B) and (C), significance was tested by a two-sided Mann–Whitney U test; P < 1 × 10−39. (D) Comparison of the effects of substituting nonhydrophobic positions in wild-type CRX with hydrophobic (F, W, Y, M, I, L, or V) or nonhydrophobic amino acids, separated by the number of neighboring hydrophobic residues. The analysis is limited to positions in the disordered transcriptional effector domain; the number of positions in each neighbor group is shown in parentheses. (E) Reporter activation (green fluorescence; arbitrary units) was measured in Reporter + LP cells with the indicated CRX variants integrated. Two independent biological replicate experiments per sample (distributions plotted from 50,000 cells).

Update of

References

    1. Adzhubei IA, Schmidt S, Peshkin L, Ramensky VE, Gerasimova A, Bork P, Kondrashov AS, Sunyaev SR. 2010. A method and server for predicting damaging missense mutations. Nat Methods 7: 248–249. 10.1038/nmeth0410-248 - DOI - PMC - PubMed
    1. Brandes N, Goldman G, Wang CH, Ye CJ, Ntranos V. 2023. Genome-wide prediction of disease variant effects with a deep protein language model. Nat Genet 55: 1512–1522. 10.1038/s41588-023-01465-0 - DOI - PMC - PubMed
    1. Brnich SE, Abou Tayoun AN, Couch FJ, Cutting GR, Greenblatt MS, Heinen CD, Kanavy DM, Luo X, McNulty SM, Starita LM, et al. 2020. Recommendations for application of the functional evidence PS3/BS3 criterion using the ACMG/AMP sequence variant interpretation framework. Genome Med 12: 3. 10.1186/s13073-019-0690-2 - DOI - PMC - PubMed
    1. Chen S, Wang Q-L, Xu S, Liu I, Li LY, Wang Y, Zack DJ. 2002. Functional analysis of cone–rod homeobox (CRX) mutations associated with retinal dystrophy. Hum Mol Genet 11: 873–884. 10.1093/hmg/11.8.873 - DOI - PubMed
    1. Chen S, Zhou Y, Chen Y, Gu J. 2018. fastp: an ultra-fast all-in-one FASTQ preprocessor. Bioinformatics 34: i884–i890. 10.1093/bioinformatics/bty560 - DOI - PMC - PubMed