. 2024 Sep 25;9(1):42.
doi: 10.1038/s41525-024-00430-y.

CDK4 is co-amplified with either TP53 promoter gene fusions or MDM2 through distinct mechanisms in osteosarcoma

Affiliations

CDK4 is co-amplified with either TP53 promoter gene fusions or MDM2 through distinct mechanisms in osteosarcoma

Karim H Saba et al. NPJ Genom Med. .

Abstract

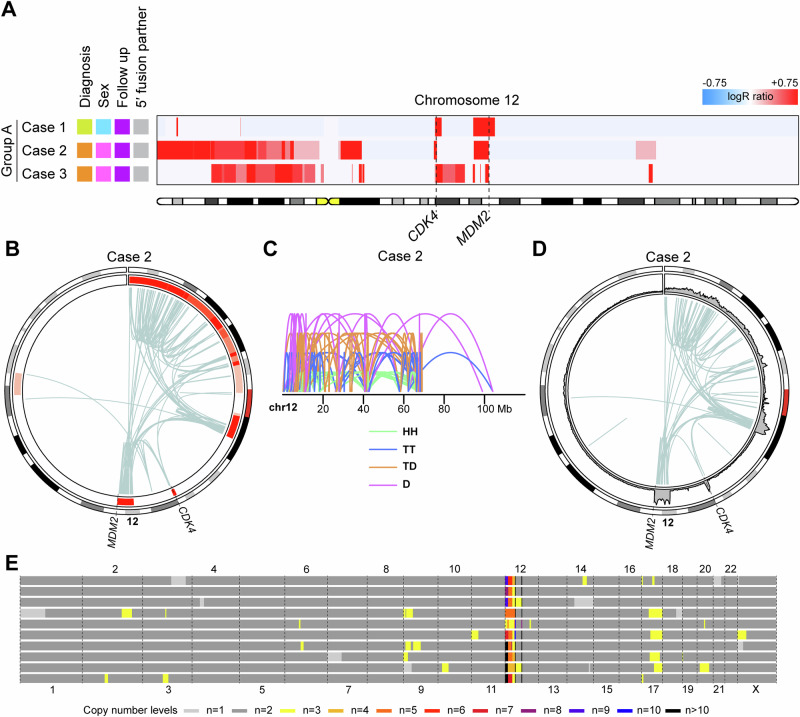
Amplification of the MDM2 and CDK4 genes on chromosome 12 is commonly associated with low-grade osteosarcomas. In this study, we conducted high-resolution genomic and transcriptomic analyses on 33 samples from 25 osteosarcomas, encompassing both high- and low-grade cases with MDM2 and/or CDK4 amplification. We discerned four major subgroups, ranging from nearly intact genomes to heavily rearranged ones, each harbouring CDK4 and MDM2 amplification or CDK4 amplification with TP53 structural alterations. While amplicons involving MDM2 exhibited signs of an initial chromothripsis event, no evidence of chromothripsis was found in TP53-rearranged cases. Instead, the initial disruption of the TP53 locus led to co-amplification of the CDK4 locus. Additionally, we observed recurring promoter swapping events involving the regulatory regions of the FRS2, PLEKHA5, and TP53 genes. These events resulted in ectopic expression of partner genes, with the ELF1 gene being upregulated by the FRS2 and TP53 promoter regions in two distinct cases.


Conflict of interest statement

The authors declare no competing interest.

Figures

Fig. 1
Fig. 1. Whole-genome copy number heatmap of 25 osteosarcomas with amplification of 12q sequences.
Genome-wide copy number gains (depicted in red) and losses (depicted in blue) were identified by copy number array analysis. The cases are categorised into four groups based on their genome-wide copy number alterations and MDM2 status. Group A comprises three low-grade osteosarcomas (low-grade central n = 1, parosteal n = 2) with amplification of CDK4 and MDM2 along with other regions of chromosome 12 and no copy number alterations outside of chromosome 12. Group B comprises ten osteosarcomas (including low-grade central n = 2, parosteal n = 3, dedifferentiated parosteal n = 3 and conventional n = 2), with amplification of CDK4 and MDM2 along with other regions of chromosome 12 and some copy number alterations outside of chromosome 12. Group C comprises seven conventional osteosarcomas with amplification of CDK4 and MDM2 and genome-wide copy number alterations. Group D comprises five conventional osteosarcomas with amplification of CDK4—but not MDM2—and genome-wide copy number alterations.
Fig. 2
Fig. 2. Chromosome 12 copy number heatmap of cases in Group A and combined copy number and structural variant data from a representative case.
A Copy number gains (depicted in red) affecting chromosome 12 were identified by copy number array analysis in three low-grade osteosarcomas. The loci of the CDK4 and MDM2 genes are indicated by dashed lines. The colour coding of the sample annotations can be found in Fig. 1. B Circos plot of chromosome 12 based on combined copy number and structural variant data. In the circular track under the ideogram, red regions indicate copy number gains and amplifications. Intrachromosomal rearrangements are depicted in light blue. C Intrachromosomal structural variants on chromosome 12 are depicted by mapping orientation of the read-pairs. Abbreviations: HH head-to-head inversion, TT tail-to-tail inversion, TD duplication type and D deletion type. Mb mega-base-pair. D Circos plot of chromosome 12 based on longread sequencing data. In the circular track under the ideogram, coverage levels have been plotted as a proxy for copy number levels. Intrachromosomal rearrangements are depicted in light blue. E Genome-wide copy numbers of sequenced aberrant cells. Each row represents a single cell.
Fig. 3
Fig. 3. Chromosome 12 copy number heatmap of cases in Group B and combined copy number, structural variant and transcriptomic data from representative cases.
A Copy number gains (depicted in red) and losses (depicted in blue) affecting chromosome 12 were identified by copy number array analysis in ten low- and high-grade osteosarcomas. The loci of the CDK4 and MDM2 genes are indicated by dashed lines. The colour coding of the sample annotations can be found in Fig. 1. B Circos plot of chromosome 12 based on combined copy number and structural variant data. In the circular track under the ideogram, red regions indicate copy number gains and amplifications. Intrachromosomal rearrangements are depicted in light blue. A selected variant is depicted in brown. C Intrachromosomal structural variants on chromosome 12 are depicted by mapping orientation of the read-pairs. Abbreviations: HH head-to-head inversion, TT tail-to-tail inversion, TD duplication type and D deletion type. Mb mega-base-pair. D Circos plot of chromosome 12 based on longread sequencing data. In the circular track under the ideogram, coverage levels have been plotted as a proxy for copy number levels. Intrachromosomal rearrangements are depicted in light blue. A selected variant is depicted in brown. E Genome-wide copy numbers of sequenced aberrant cells. Each row represents a single cell. F In Case 7, the complete coding sequence of the ELF1 gene is positioned under the control of the FRS2 promoter. FRS2 exon 1 displays a higher expression compared to the exons excluded from the fusion. ELF1 is upregulated in Case 7 (indicated by an arrow) compared to other osteosarcomas and osteoblastomas. G Complex rearrangements in Case 9 lead to the formation of a three-way ALDH2::PLEKHA5::ATF7 promoter swapping event. The ALDH2 and PLEKHA5 exons included in the fusion display a higher expression than the excluded exons. The ATF7 gene in the multi-sampled Case 9 (indicated by two arrows) is upregulated compared to other osteosarcomas and osteoblastomas. The RNA breakpoints are represented by dashed lines. Abbreviations: OB osteoblastoma, OS_Conv conventional osteosarcoma, OS_LGC low-grade central osteosarcoma and OS_Par parosteal or dedifferentiated parosteal osteosarcoma.
Fig. 4
Fig. 4. Chromosome 12 copy number heatmap of cases in Group C and combined copy number and structural variant data from a representative case.
A Copy number gains (depicted in red) and losses (depicted in blue) affecting chromosome 12 were identified by copy number array analysis in seven conventional osteosarcomas. The loci of the CDK4 and MDM2 genes are indicated by dashed lines. The colour coding of the sample annotations can be found in Fig. 1. B Circos plot of chromosome 12 and selected chromosomes based on combined copy number and structural variant data. In the circular track under the ideograms, red regions indicate copy number gains and amplifications, while blue regions indicate copy number losses. Intrachromosomal and interchromosomal rearrangements are depicted in light blue and grey, respectively. A selected variant is depicted in brown. C Intrachromosomal structural variants on chromosome 12 are depicted by mapping orientation of the read-pairs. Abbreviations: HH head-to-head inversion, TT tail-to-tail inversion, TD duplication type and D deletion type. Mb mega-base-pair. D Circos plot of chromosome 12 and selected chromosomes based on longread sequencing data. In the circular track under the ideograms, coverage levels have been plotted as a proxy for copy number levels. Intrachromosomal and interchromosomal rearrangements are depicted in light blue and grey, respectively. A selected variant is depicted in brown. E Genome-wide copy numbers of sequenced aberrant cells. Each row represents a single cell.
Fig. 5
Fig. 5. Chromosome 12 copy number heatmap of cases in Group D and combined copy number, structural variant, and transcriptomic data from a representative case.
A Copy number gains (depicted in red) and losses (depicted in blue) affecting chromosome 12 were identified by copy number array analysis in five conventional osteosarcomas. The loci of the CDK4 and MDM2 genes are indicated by dashed lines. The colour coding of the sample annotations can be found in Fig. 1. B Circos plot of chromosomes 12, 17 and selected chromosomes based on combined copy number and structural variant data. In the circular track under the ideograms, red regions indicate copy number gains and amplifications, while blue regions indicate copy number losses. Intrachromosomal and interchromosomal rearrangements are depicted in light blue and grey, respectively. A selected variant is depicted in dark blue. C Intrachromosomal structural variants on chromosome 12 are depicted by mapping orientation of the read-pairs. Abbreviations: HH head-to-head inversion, TT tail-to-tail inversion, TD duplication type and D deletion type. Mb mega-base-pair. D In OS222, the complete coding sequence of the ELF1 gene is placed under the control of the TP53 promoter. TP53 exon 1 displays a higher expression than the exons excluded from the fusion. The ELF1 gene in OS222 (indicated by an arrow) is highly expressed compared to other osteosarcomas and osteoblastomas, but lower than in Case 7. The RNA breakpoints are represented by dashed lines. Abbreviations: OB osteoblastoma, OS_Conv conventional osteosarcoma, OS_LGC low-grade central osteosarcoma and OS_Par parosteal or dedifferentiated parosteal osteosarcoma.
Fig. 6
Fig. 6. CDK4-amplified osteosarcomas show distinct gene expression profiles and diverse genomic complexity levels.
A Unsupervised principal component analysis based on global gene expression levels in osteosarcomas with amplification of MDM2 and/or CDK4 reveal distinct profiles. Cases from Groups B and D are separated in two distinct clusters. However, cases from Group C cluster with both Group B and D. A notable difference in global gene expression is instead determined by the status of the TP53 gene, where mutated cases cluster distinctly from wildtype cases, assuming all cases have amplification of the MDM2 and/or CDK4 genes. The first three principal components representing 17%, 10% and 8% of the variation are displayed. Each sample is connected with its nearest neighbour. Samples to the left of the dashed line are TP53-wildtype, while those to the right are TP53-mutated. B t-distributed stochastic neighbour embedding analysis based on global gene expression levels in all RNA-sequenced osteosarcomas revealed that cases generally separated based on TP53 mutational status with some exceptions. Osteoblastomas were used as an out-group control. Arrows point to TP53-mutated cases with MDM2 and/or CDK4 amplification. An unsupervised principal component analysis with the same cases can be seen in Supplementary Movie 1. C The genomic complexity score of each case plotted against the number of chromosomes affected by copy number alterations. Cases 7 and 8 from Group B (enclosed within a dashed ellipse), both with complete knock-out of CDKN2A, showed copy number alterations on more chromosomes than other cases in Group B. A chromosome was counted as being affected by a copy number alteration if there was a visible copy number shift in the segmentation analysis, or if the chromosome displayed a non-diploid copy number. The X and Y chromosomes were counted as one chromosome pair in males.

References

    1. Gianferante, D. M., Mirabello, L. & Savage, S. A. Germline and somatic genetics of osteosarcoma—connecting aetiology, biology and therapy. Nat. Rev. Endocrinol.13, 480–491 (2017). - PubMed
    1. Baumhoer, D. et al. Osteosarcoma. In: WHO Classification of Tumours Editorial Board. Soft Tissue and Bone Tumours. 5th ed. 403–409 (International Agency for Research on Cancer, 2020).
    1. Beird, H. C. et al. Osteosarcoma. Nat. Rev. Dis. Prim.8, 77 (2022). - PubMed
    1. Yoshida, A., Bredella, M. A., Gambarotti, M. & Sumathi, V. P. Low-grade central osteosarcoma. In: WHO Classification of Tumours Editorial Board. Soft Tissue and Bone Tumours. 5th ed. 400–402 (International Agency for Research on Cancer, 2020).
    1. Wang, J., Nord, K. H., O’Donnell, P. G. & Yoshida, A. Parosteal osteosarcoma. In: WHO Classification of Tumours Editorial Board. Soft Tissue and Bone Tumours. 5th ed. 410-413 (International Agency for Research on Cancer, 2020).

LinkOut - more resources