. 2024 Oct;634(8032):104-112.
doi: 10.1038/s41586-024-07946-4. Epub 2024 Sep 25.

Single-cell multi-omics map of human fetal blood in Down syndrome

Affiliations

Single-cell multi-omics map of human fetal blood in Down syndrome

Andrew R Marderstein et al. Nature. 2024 Oct.

Abstract

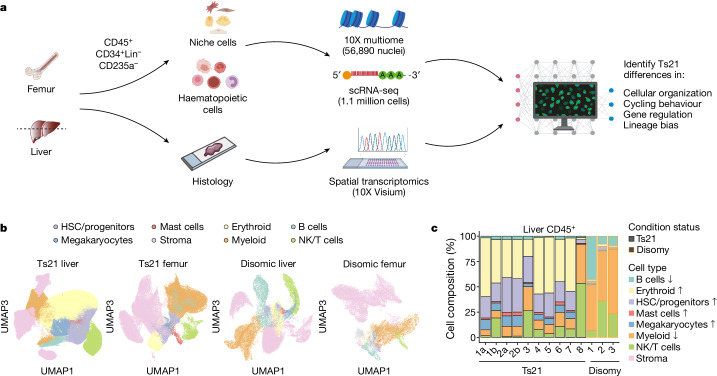
Down syndrome predisposes individuals to haematological abnormalities, such as increased number of erythrocytes and leukaemia in a process that is initiated before birth and is not entirely understood1-3. Here, to understand dysregulated haematopoiesis in Down syndrome, we integrated single-cell transcriptomics of over 1.1 million cells with chromatin accessibility and spatial transcriptomics datasets using human fetal liver and bone marrow samples from 3 fetuses with disomy and 15 fetuses with trisomy. We found that differences in gene expression in Down syndrome were dependent on both cell type and environment. Furthermore, we found multiple lines of evidence that haematopoietic stem cells (HSCs) in Down syndrome are 'primed' to differentiate. We subsequently established a Down syndrome-specific map linking non-coding elements to genes in disomic and trisomic HSCs using 10X multiome data. By integrating this map with genetic variants associated with blood cell counts, we discovered that trisomy restructured regulatory interactions to dysregulate enhancer activity and gene expression critical to erythroid lineage differentiation. Furthermore, as mutations in Down syndrome display a signature of oxidative stress4,5, we validated both increased mitochondrial mass and oxidative stress in Down syndrome, and observed that these mutations preferentially fell into regulatory regions of expressed genes in HSCs. Together, our single-cell, multi-omic resource provides a high-resolution molecular map of fetal haematopoiesis in Down syndrome and indicates significant regulatory restructuring giving rise to co-occurring haematological conditions.


Conflict of interest statement

A.R.M. consults for Third Rock Ventures, Inc. S.B.M. advises BioMarin, MyOme and Tenaya Therapeutics. All other authors declare no competing interests.

Figures

Fig. 1
Fig. 1. scRNA-seq analysis of the fetal liver and bone marrow in Down syndrome.
a, Experimental workflow. Cells (CD45+, CD34+Lin and CD235a) from fetuses with disomy and Ts21 were isolated from the bone marrow (femur) and the liver and processed for scRNA-seq. CD45+ cells from the fetal liver (number of fetus (k) = 3) were processed for multiome, and tissue sections from fetuses with disomy (k = 5) and Ts21 (k = 11) were used for spatial transcriptomics. Illustrations adapted from ref. , Springer Nature Limited. b, 3D uniform manifold approximation and projection (UMAP) visualization of cells from Ts21 liver (number of cells (n) = 780,299, k = 15), Ts21 femur (n = 162,775, k = 12), disomic liver (n = 110,671, k = 3) and disomic femur (n = 53,807, k = 3) coloured by broad cell-type categories. NK, natural killer. c, Stacked barplot of relative abundances of different broad cell types in fetuses with Ts21 and disomy. The arrows indicate a significant increase or decrease in cell number in the Ts21 liver compared with the disomic liver. The difference in cell proportion was tested by a two-sided Wilcoxon rank-sum test with significance determined at FDR < 0.1.
Fig. 2
Fig. 2. Gene–environment interactions in Ts21 and disomic HSCs.
a, Differential expression analysis (DEA) between the liver and femur within Ts21 and disomic cells. HSC/MPP genes were characterized as environment driven (detected in Ts21 and disomic cells), Ts21 induced (discovered in Ts21 cells) or Ts21 reverted (discovered in disomic cells) by downsampling Ts21 liver and femur data to the same size as disomic liver and femur data. Owing to reduced statistical power, differentially expressed genes (DEGs) were found in the full Ts21 dataset, but not in the downsampled Ts21 or disomic data, making it inconclusive whether they were Ts21 induced or environment driven. A volcano plot of DEGs between fetal bone marrow and liver HSC/MPPs from fetuses with Ts21 (bottom) or disomy (top) is also shown. The x axis indicates the log2 fold change (LFC), and the y axis denotes −log10 FDR. ** indicates significance in DEA of the specified genetic background. Illustrations adapted from ref. , Springer Nature Limited, and created using BioRender (https://biorender.com). b, Gene set enrichment analysis of upregulated Ts21-induced genes using EnrichR. The scatter plots show Gene Ontology (GO) terms (molecular function (MF) and biological process (BP)) or ENCODE and ChEA transcription factors (TFs). Significance is displayed using FDR values. c, Pie chart of cells in G1, G2M and S phase in cycling Ts21 fetal liver HSC/MPPs. d, Volcano plot between cycling and normal Ts21 HSC/MPPs. The blue dots represent genes with FDR < 0.05 and LFC > 1. The genes of interest are coloured by Gene Ontology terms. Analyses in panels ad include the Ts21 liver (n = 780,299, k = 15), Ts21 femur (n = 162,775, k = 12), disomic liver (n = 110,671, k = 3) and disomic femur (n = 53,807, k = 3). e,f, Boxplots displaying per-sample MitoTracker (e) and MitoSOX (f) staining in disomic (n = 3 samples) and Ts21 (n = 3 samples) haematopoietic populations: HSCs (LinCD34+CD38CD90+CD45RA population), CD38 (LinCD45+CD34+CD38 population), CD38+ (LinCD45+CD34+CD38+ population) and Lin+ (CD3/CD8/CD11b/CD56/CD14/CD19, lineage-positive population). Nominal significance is shown using a single-cell Gaussian mixed model.
Fig. 3
Fig. 3. Multiome analysis.
a, Integration, UMAP and cell populations of 10X multiome ATAC profiles from the Ts21 and disomic datasets. cDC, classical dendritic cell; MEMP, megakaryocyte–erythroid–mast progenitor; pDC, plasmacytoid dendritic cell. b, Circular projection of absorption probabilities for every HSC towards terminal states (using CellRank; left). Disomic HSCs are in blue, and Ts21 HSCs are in red. The proportion of HSCs differentiating towards the erythroid and megakaryocytic lineage (absorption probability > 0.5) with binomial test P values is also shown (right). c, UMAP with cells coloured according to RNA and ATAC similarity in disomic (left) and Ts21 (middle) HSCs, as estimated by the mutual information of RNA and ATAC topics in a single cell. The HSC latent UMAP space is characterized by a joint representation of both RNA and ATAC topic models (using MIRA). The UMAP space of all disomy and trisomy HSCs (n = 3,784 Ts21 and n = 2,431 disomic HSCs) is in grey. The boxplots represent the 25th, 50th and 75th percentiles, and the whiskers represent 1.5× the interquartile range. Significance was determined using a two-sided Mann–Whitney U-test. d, UMAP with cells coloured according to pseudotime. The arrows denote vectors of the directed cell transition matrix. e, Branches of HSC differentiation in the UMAP space (using MIRA). Cells are coloured by their probability of belonging to a specific branch. f, Compositional STREAM graph indicating abundances of disomic and Ts21 HSCs in each branch along pseudotime. The dashed line denotes half of the pseudotime.
Fig. 4
Fig. 4. Integration of peak–gene links and GWAS SNPs.
a,b, All motif enrichments (a) and AP-1 motif-related enrichments (b) in promoters and enhancers for elements with greater accessibility in Ts21 or disomic HSCs. Significance was determined using monaLisa. CRE, cAMP-response element; TRE, TRA-response element. c, Schematic of the SCENT peak–gene multiome analysis performed in n = 3,784 Ts21 and n = 2,431 disomic HSCs. P–G, peak–gene. Schematic was created using BioRender (https://biorender.com). d, Number of significant peak–gene links in Ts21 and disomic HSCs using SCENT (FDR < 0.2), including after downsampling Ts21 HSCs (top), and the proportion of significant peak–gene links with a significant accessibility-by-trisomy interaction term (FDR < 0.2; bottom). e, Proportion of catalogued Ts21 and disomic HSC mutations in the introns of disomy HSC-expressed genes (top), Ts21 HSC-expressed genes (middle) and Ts21 cycling HSC-expressed genes (bottom) that overlap candidate cis-regulatory elements from the ENCODE project. The histograms represent the empirical distribution of this overlap from 10,000 bootstrapped sets of somatic variants in disomic HSCs. P values were determined by the proportion of bootstrapped disomic values that are more extreme than the observed Ts21 value. f, Enrichment of fine-mapped GWAS SNPs from RBC counts in SCENT peak–gene links (termed active cis-regulatory regions) as identified in Ts21 HSCs (top), and enrichment of target GWAS genes within DEGs, as identified in the large scRNA-seq analysis of HSCs (bottom). Odds ratios (ORs) and standard errors were calculated by Fisher’s exact test using three sets of peak–gene links based on significance. The red dashed line indicates the null hypothesis of OR = 1. gi, Colonies (n = 322) generated by single-cell-sorted HSC/MPPs from three independent disomic and Ts21 fetal livers. Total cell number (live and dead) in Ts21 and disomic HSC-derived colonies (g); lineage proportions in uni-lineage, bi-lineage or multi-lineage colonies (top) and only in uni-lineage colonies (bottom; h); and lineage output (defined as the lineage with the highest cell count by flow cytometry) of HSC/MPP-derived colonies (i) are shown. Significance was determined by Wilcoxon rank-sum test (g) and chi-squared test (h).
Extended Data Fig. 1
Extended Data Fig. 1. Differentiation trajectory within the BM niche.
a, PAGA graphs overlaid on the diffusion maps, computed from cell types representing the BM niche population and their connectivity (top-disomic, bottom-Ts21). b, Left: trajectory with the directionality of the differentiation process from CAR cells to osteoprogenitors and osteoblasts in disomic and Ts21 samples. Stream plot overlaid on Force-directed (FLE) graph of diffusion map of CAR cells, LepR + CAR cells, osteoprogenitors and osteoblasts. Right: scatter plot of the Pearson correlation between gene expression and CellRank’s terminal state absorption probabilities in disomic and Ts21. Significantly correlated genes (FDR < 0.05) were plotted. Colours indicate associated GO terms. c. Left - stream plot overlaid on FLE graph of diffusion map of arterial endothelial cells, transitioning endothelial cells and osteoblasts. Right - scatter plot of GO terms estimated from top 500 genes most positively/negatively correlated with the absorption probabilities.
Extended Data Fig. 2
Extended Data Fig. 2. Impact of chromosome 21 on differential expression analysis.
In liver (a) and femur (b), differential expression analysis was performed between Ts21 and disomic cells using limma-voom and sample-level pseudobulks. The median log2-fold change (LFC) was calculated for chr21 genes (blue) and all other genes (Not chr21, red). c, Percentage of differentially expressed genes (DEG), (FDR < 0.05) on chromosome “N” versus other chromosomes. Each point represents a cell type. n = 1,107,552 cells and k = 18 foetuses, represented by Ts21 liver (n = 780,299, k = 15), Ts21 femur (n = 162,775, k = 12), disomic liver (n = 110,671, k = 3) and disomic femur (n = 53,807, k = 3). d, Left, median log-fold changes for genes on each chromosome between fetuses #15633 and #15781. Right, median log-fold changes for genes on each chromosome between fetuses #15633 and #15781, after increasing mapped reads to genes on chromosome 21 by 50% in two #15781 pseudobulk samples. e, Comparison of log-fold changes for all genes between the two analyses. Orange points represent the genes on chromosome 21, which have increased expression within the two #15781 pseudobulk samples in the spiked chr21 analysis (y-axis). The log-fold changes of the underlying real data is along the x-axis. f, Average normalised gene expression of statistically significant Environment-driven DEGs and Ts21-induced HSC/MPPs DEGs within each dataset. Normalised expression was calculated by first transforming a gene’s expression to have mean = 0 and variance = 1, and then averaging transformed expression across all genes. Mean normalised expression across cells is shown, with vertical bars representing 2 standard errors around the mean. g, Comparison of the percentage of cells cycling within disomic samples (x-axis) and Ts21 samples (y-axis). Each dot represents a different cell type. Asterisk (*) signifies statistically significant difference in cycling of cells in Ts21 vs disomic by performing a Mann-Whitney U test on sample-level pseudobulk proportions. Dashed line represents y = x.
Extended Data Fig. 3
Extended Data Fig. 3. CellRank and MIRA differentiation analysis.
a, Left, force directed layout (FLE)(ForceAtlas2) of cells belonging to the myeloid lineage. Harmony batch corrected and PAGA initialised. HSC cluster set as the root for pseudotime calculation. Black arrows indicate the projected transition matrix (CellRank). Right, PAGA representation. b, Five terminal states were automatically identified using CellRank. Normalised expression of genes with highest correlation with each terminal state plotted in FLE space (CellRank lineage drivers) (IRF8:pDCs, ITGA2B:Megakaryocytes, TFRC:Late erythroid, LMO4:Mast cells, SAMHD1: monocytes). PROM1 was added to illustrate the location of HSCs. c, MIRA topic analysis performed on data including both disomic and Ts21 HSCs. Topic analysis was performed separately on RNA and ATAC raw data. Cross-correlation matrix between RNA topics and ATAC topics. Left, Ts21 HSCs. Right, disomic HSCs. d, Each cell is associated with a single RNA topic according to the topic with the highest cumulative expression in that cell. Bar graph illustrating the composition of topics each MIRA identified branch, as measured by topics assigned to each cell of that branch. RNA topic 9 has the highest frequency in branch 2 and topic 8 has the highest frequency in branch 3. e, Left, gene set enrichment analysis (GSEA) of branch 2 specific topic 9 from querying “MSigDB_Hallmark_2020” (enrichr). GSEA analysis of branch 3 specific topic 8 from querying “HDSigDB_Human_2021” (enrichr). f. UMAP plot representing the joint RNA and ATAC MIRA latent space of HSCs. Expression of cell-cycling gene MKI67 (raw counts).
Extended Data Fig. 4
Extended Data Fig. 4. Trans-regulated genes in HSC multiome.
a, Compositional STREAM graph indicating topic abundance proportion within cells ordered along pseudotime for each branch. Left, RNA expression topics. Right, ATAC accessibility topics. b, Left, scatter plot comparing the TFs regulating expression of genes turned on in branch 2 or 3. P-values calculated using a Wilcoxon rank sum test over the association scores. Right, top genes regulated by labelled branch 2 TFs. The expression (blue) and accessibility (green) indicate Ts21 HSC specificity. Data is normalised by row to illustrate preference between disomic and Ts21. Analyses include Ts21 liver (n = 35,633 cells, k = 3) and disomic liver (n = 21,257, k = 3) samples; n = 3,784 Ts21 and n = 2,431 disomic cells are HSCs. c, The cumulative gene NITE score (MIRA) across all HSCs separated by differentially expressed genes (DEGs) (pseudobulk DESeq2) between disomic and Ts21. Significance of P < 0.001 was determined using a two-sided Wilcoxon rank sum with Benjamini-Hochberg correction. d, Distribution of the cumulative gene NITE score across all modelled genes (n = 4,446). Black, top genes regulated by branch 2 transcription factors. Blue, top genes with highest NITE score. e, UMAP plots (MIRA’s joint RNA and ATAC topic model latent representation) indicating the raw expression of genes with the highest cumulative NITE score. f, Representation of the gene, TFR2, with the highest NITE score. UMAP plots from left to right illustrate raw expression, LITE modelling prediction, NITE modelling prediction, and the chromatin differential (difference between LITE and NITE). Scatter plots (right) indicate the correlation between regulatory potential modelling prediction and the normalised expression of the gene. The NITE model that incorporates both cis and trans accessibility greater than doubles the predictive efficiency of TFR2 expression (LITE: R2 = 0.3, NITE: R2 = 0.64). g, Gene set enrichment analysis (GSEA) (enrichr) results from the top 500 genes according to the cumulative NITE score. Left, GSEA results from querying “BioPlanet_2019”. Right, GSEA results from querying “RNA-Seq_Disease_Gene_and_Drug_Signatures_from_GEO”. Colouring indicates adjusted p-value (-log 10).
Extended Data Fig. 5
Extended Data Fig. 5. Transcription factor motif enrichment in Ts21 and disomic HSCs.
a, Enrichment of selected motifs by monaLisa in peaks with greater accessibility in Ts21 (left) and reduced accessibility in disomy (right). b, Barplots describing the number and proportion of (i) EPD promoters that overlap with peaks accessible in HSCs, (ii) expressed genes with at least one EPD promoter, and (iii) expressed genes with at least one EPD promoter that overlaps with peaks accessible in HSCs. c, The association between differentially accessible EPD promoters and differentially expressed (DE) linked genes (odds ratios with standard errors). Left used DE genes at FDR < 0.05 (adjusted) and right used DE genes at nominal P < 0.05. d, Gene set enrichment analysis of genes linked to differentially accessible (DA) promoters with greater accessibility in Ts21. e-f, Gene set enrichment analysis results for (e) genes linked to CRE-containing promoters with greater accessibility in trisomy and (f) genes linked to TRE-containing promoters with greater accessibility in disomy.
Extended Data Fig. 6
Extended Data Fig. 6. Transcription factor motif enrichment in enhancers in Ts21 and disomic HSCs.
a-c, Histogram of the number of ABC enhancers per gene (a), differentially accessibility ABC enhancers per gene (b), and association between differentially accessible ABC enhancers and differential expression of their target genes (c). d, The absolute value of log-fold changes for differentially accessible peaks, stratified by peaks with significantly higher accessibility in disomy (left) and Ts21 (right), and ABC enhancers (blue) or EPD promoters (red). e, Proportion of variance explained in the differential accessibility of trisomy 21 HSCs for each TF motif instance. f, The differential accessibility, estimated by |logFC| between Ts21 and disomic HSCs, between different peak sets and stratified by GATA-containing elements or not.
Extended Data Fig. 7
Extended Data Fig. 7. Gene regulation and somatic mutation accrual in HSCs.
a, Distribution of significant peak-gene links identified in Ts21 (top) or disomic HSCs (bottom) (FDR < 0.2). The y-axis represents the proportion of links that are on that chromosome versus genome-wide. b-c, The enrichment of Ts21 somatics relative to disomic somatics within CREs of differentially expressed genes from (b) Ts21 vs Disomy HSCs and (c) Ts21 cycling vs less-cycling HSCs, across different P-value thresholds.
Extended Data Fig. 8
Extended Data Fig. 8. Enrichment of RBC traits GWAS SNPs in multiome peaks.
a, aggregated accessibility and expression of HSCs from disomic and Ts21 HSCs for TFR2 and TSPAN32 using 10X multiome data. b, Pseudobulk expression within HSC populations using the scRNA-seq data. Each point represents a different sample. c, CD235a expression in Ctrl HUDEP-2 and in the population of highly expressing TFR2 cells. *** p-value < 0.001 (two-sided Mann-Whitney U test). Boxplots represent 25th, 50th and 75th percentiles, whiskers represent 1.5× interquartile range.

References

    1. Belson, M., Kingsley, B. & Holmes, A. Risk factors for acute leukemia in children: a review. Environ. Health Perspect.115, 138–145 (2007). - PMC - PubMed
    1. Hasle, H., Clemmensen, I. H. & Mikkelsen, M. Risks of leukaemia and solid tumours in individuals with Down’s syndrome. Lancet355, 165–169 (2000). - PubMed
    1. Choi, J. K. Hematopoietic disorders in Down syndrome. Int. J. Clin. Exp. Pathol.1, 387–395 (2008). - PMC - PubMed
    1. Hasaart, K. A. L. et al. Mutation accumulation and developmental lineages in normal and Down syndrome human fetal haematopoiesis. Sci. Rep.10, 12991 (2020). - PMC - PubMed
    1. Cabelof, D. C. et al. Mutational spectrum at GATA1 provides insights into mutagenesis and leukemogenesis in Down syndrome. Blood114, 2753–2763 (2009). - PMC - PubMed

MeSH terms

LinkOut - more resources