. 2024 Oct;634(8034):712-720.
doi: 10.1038/s41586-024-07962-4. Epub 2024 Sep 25.

The type 2 cytokine Fc-IL-4 revitalizes exhausted CD8+ T cells against cancer

Affiliations

The type 2 cytokine Fc-IL-4 revitalizes exhausted CD8+ T cells against cancer

Bing Feng et al. Nature. 2024 Oct.

Abstract

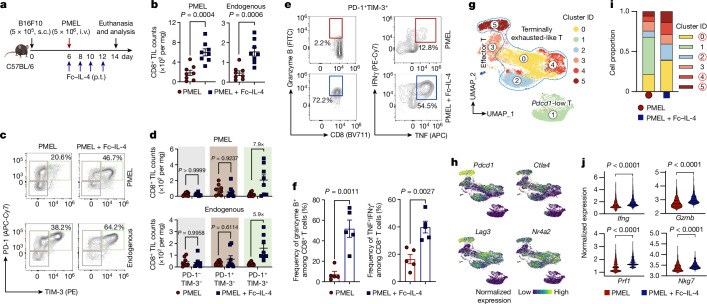
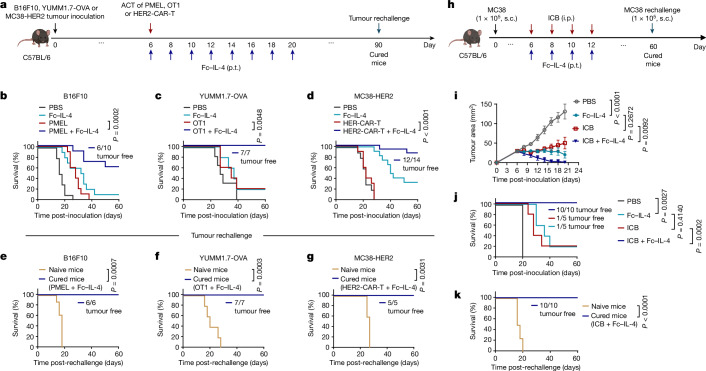
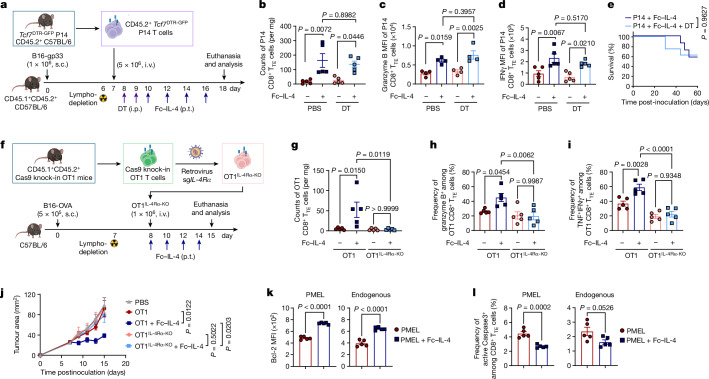
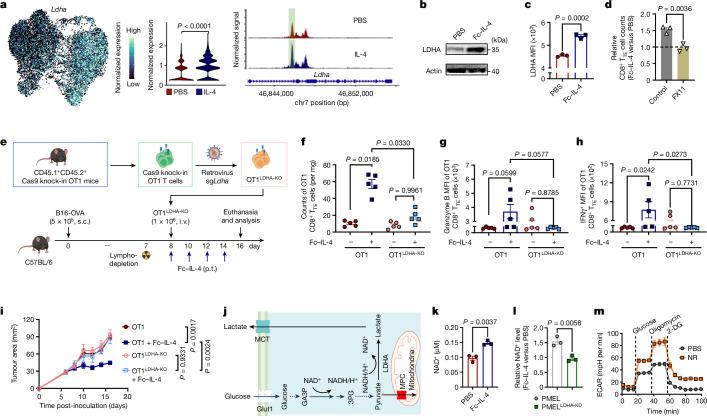
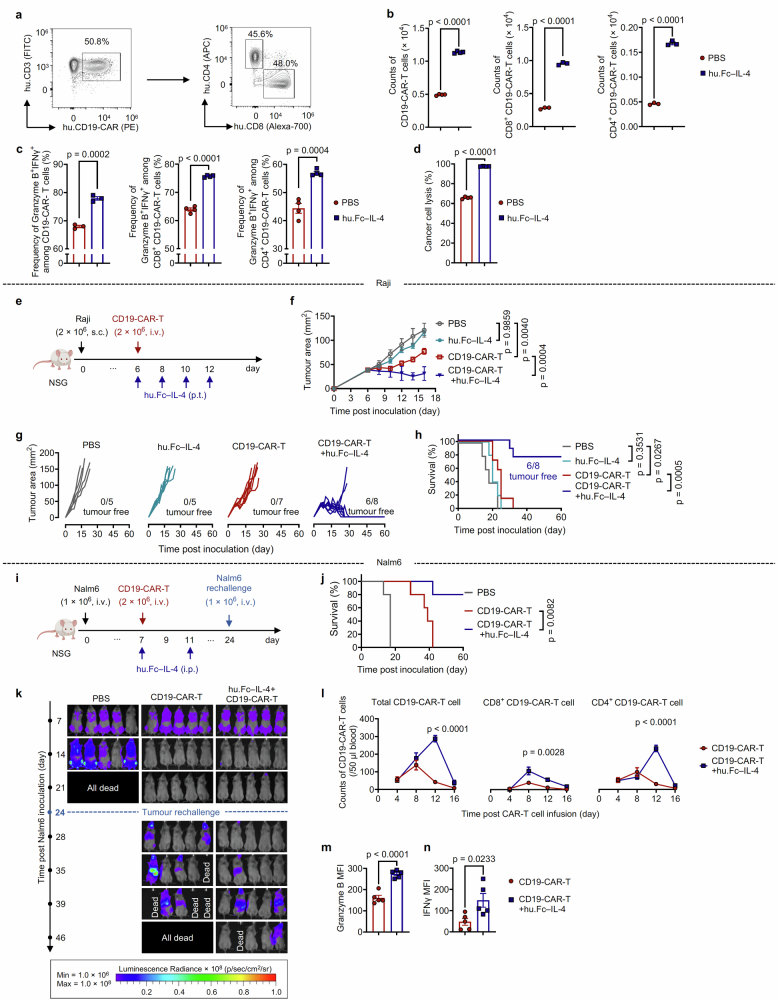
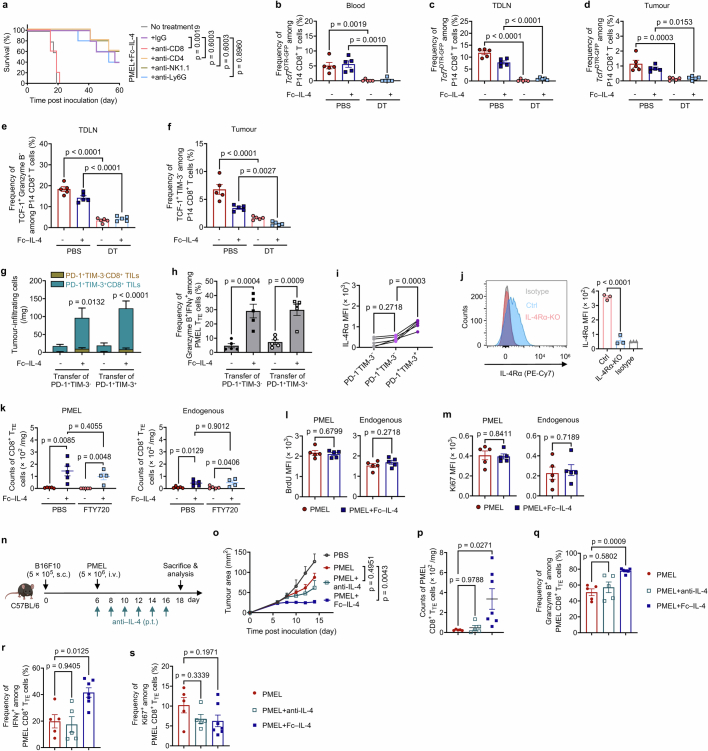
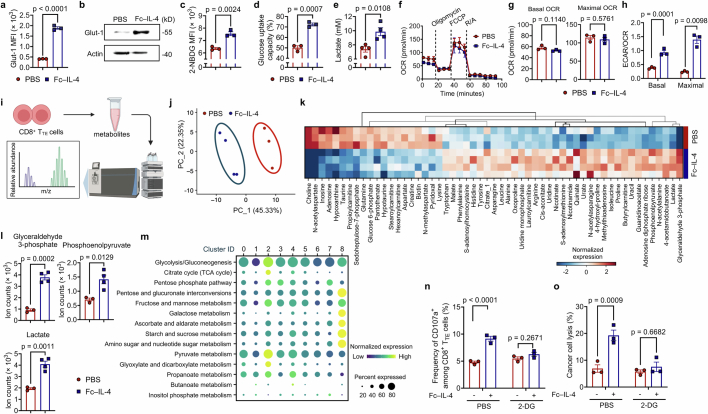
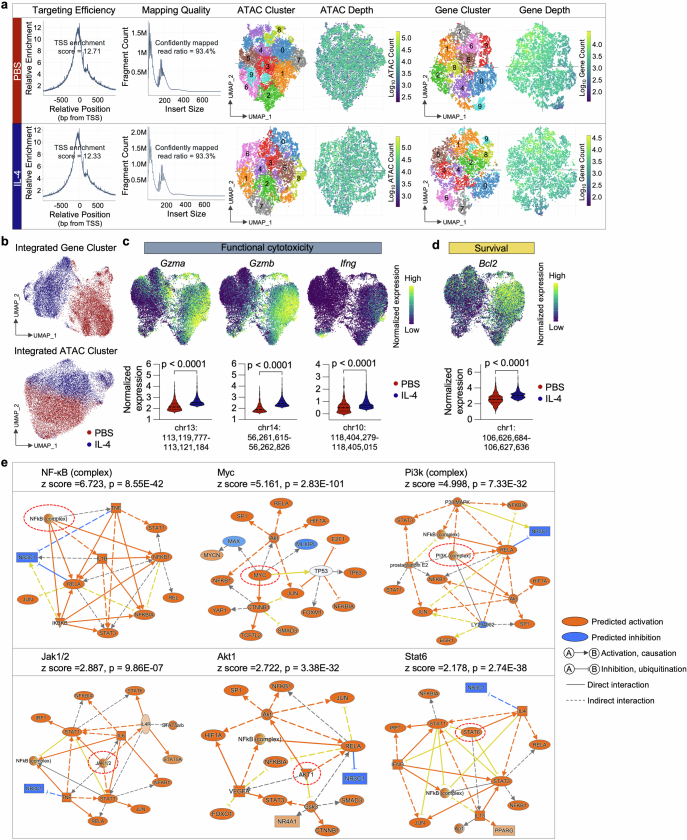
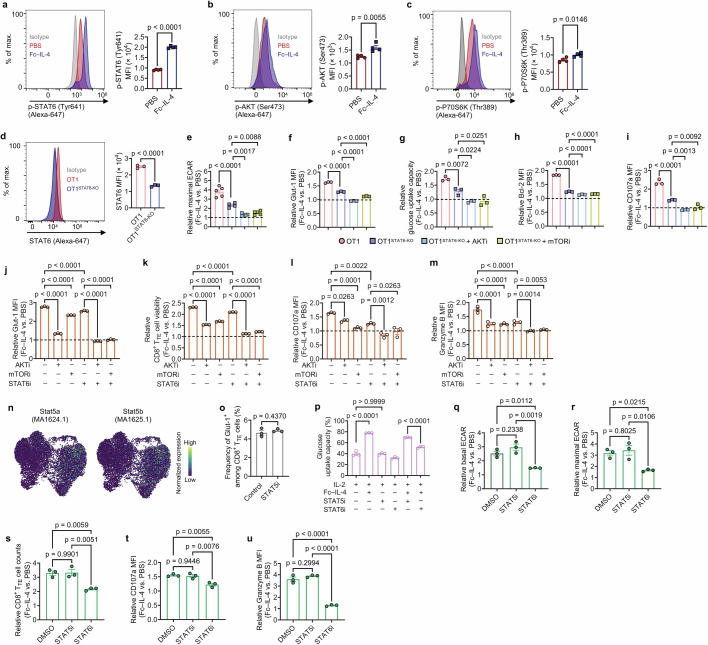
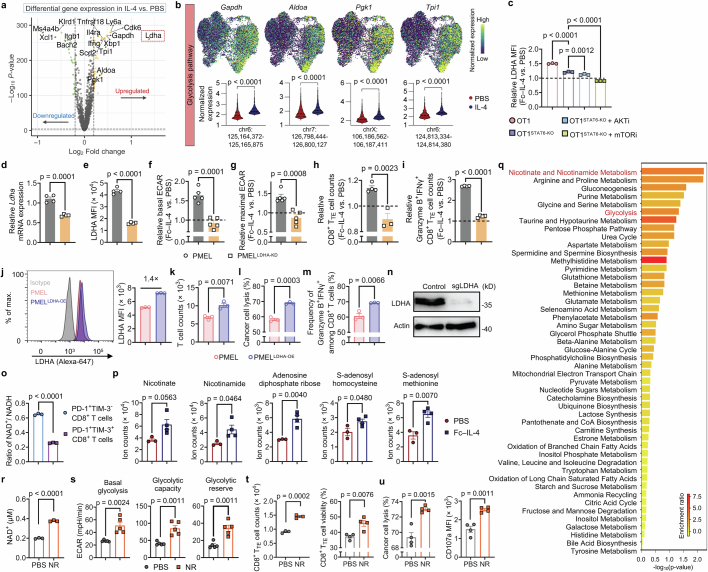
Current cancer immunotherapy predominately focuses on eliciting type 1 immune responses fighting cancer; however, long-term complete remission remains uncommon1,2. A pivotal question arises as to whether type 2 immunity can be orchestrated alongside type 1-centric immunotherapy to achieve enduring response against cancer3,4. Here we show that an interleukin-4 fusion protein (Fc-IL-4), a typical type 2 cytokine, directly acts on CD8+ T cells and enriches functional terminally exhausted CD8+ T (CD8+ TTE) cells in the tumour. Consequently, Fc-IL-4 enhances antitumour efficacy of type 1 immunity-centric adoptive T cell transfer or immune checkpoint blockade therapies and induces durable remission across several syngeneic and xenograft tumour models. Mechanistically, we discovered that Fc-IL-4 signals through both signal transducer and activator of transcription 6 (STAT6) and mammalian target of rapamycin (mTOR) pathways, augmenting the glycolytic metabolism and the nicotinamide adenine dinucleotide (NAD) concentration of CD8+ TTE cells in a lactate dehydrogenase A-dependent manner. The metabolic modulation mediated by Fc-IL-4 is indispensable for reinvigorating intratumoural CD8+ TTE cells. These findings underscore Fc-IL-4 as a potent type 2 cytokine-based immunotherapy that synergizes effectively with type 1 immunity to elicit long-lasting responses against cancer. Our study not only sheds light on the synergy between these two types of immune responses, but also unveils an innovative strategy for advancing next-generation cancer immunotherapy by integrating type 2 immune factors.


Conflict of interest statement

Y.G., L.T. and B.F. are inventors of the patents relevant to the findings reported here. L.T. and Y.G. are cofounders, share-holders and advisors for Leman Biotech. The interests of L.T. were reviewed and managed by EPFL. R.F. is scientific founder and adviser for IsoPlexis, Singleron Biotechnologies and AtlasXomics. The interests of R.F. were reviewed and managed by Yale University Provost’s Office in accordance with the University’s conflict of interest policies. J.J.M. hold patents related to CAR-T cell manufacturing and biomarker discovery. The remaining authors declare no competing interests.

Figures

Fig. 1
Fig. 1. Fc–IL-4 enriches functional CD8+ TTE cells in the TME.
af, C57BL/6 mice bearing B16F10 tumours received ACT of PMEL T cells (5 × 106, i.v.) followed by administration of Fc–IL-4 (20 µg, p.t.) or PBS every other day for four doses. Mice were euthanized on day 14 and the tumour tissues were collected for analysis by flow cytometry. Data are a single representative of two independent experiments. All data represent mean ± s.e.m. Shown are the experimental timeline (a), cell counts of PMEL or endogenous CD8+ TILs (b) (n = 8 animals), representative flow cytometry plots showing the frequencies of tumour-infiltrating CD8+ TTE cells (PD-1+TIM-3+) among PMEL or endogenous CD8+ TILs (c), cell counts of three subpopulations among PMEL or endogenous CD8+ TILs (d) (n = 8 animals), and representative flow cytometry plots (e) and frequencies (f) of granzyme B+ and TNF+IFNγ+ among tumour-infiltrating CD8+ TTE cells (n = 5 animals). gj, C57BL/6 mice bearing B16F10 tumours received ACT of PMEL T cells (5 × 106, i.v.) followed by administration of Fc–IL-4 (20 µg, p.t.) or PBS every other day for four doses in total. Mice were euthanized on day 14, tumour tissues were collected, and PMEL CD8+ T cells were sorted for scRNA-seq (n = 5 animals). g, UMAP clustering of all the PMEL CD8+ TILs. h, Indicated co-inhibitory gene marker expression on the UMAP. i, Comparison of cell proportion in each cluster. j, Comparison of functional gene expression in the terminally exhausted-like T cells. Statistical analyses are performed using two-sided unpaired Student’s t-test. Schematic in a created using BioRender (https://Biorender.com). Source Data
Fig. 2
Fig. 2. Fc–IL-4 potentiates ACT and ICB immunotherapies for tumour clearance and durable protection in many syngeneic models.
ag, C56BL/6 mice were inoculated (s.c.) with B16F10 (5 × 105), YUMM1.7-OVA (1 × 106) or MC38-HER2 (5 × 105) cells and treated with ACT of activated PMEL T cells, OT1 T cells or HER2-CAR-T cells (5 × 106, i.v.), respectively, on day 6 followed by administration of Fc–IL-4 (20 μg, p.t.) or PBS every other day for eight doses, or Fc–IL-4 alone. Cured mice receiving the combination treatment were rechallenged (s.c.) with B16F10 (1 × 105), YUMM1.7-OVA (5 × 105) or MC38-HER2 (1 × 105) cells on day 90. Shown are the experimental timeline (a); Kaplan–Meier survival curves of mice bearing B16F10 (b) (n = 10 animals), YUMM1.7-OVA (c) (n = 7 animals) or MC38-HER2 (d) (n = 14 animals) tumours; and survival curves of naive or cured mice rechallenged with B16F10 (e) (n = 6 animals), YUMM1.7-OVA (f) (n = 7 animals) or MC38-HER2 (g) (n = 5 animals) cells. hk, C56BL/6 mice were inoculated with MC38 cells (1 × 105, s.c.) and received the combination treatment of ICB (anti-PD-1 (100 μg, i.p.) plus anti-CTLA-4 (100 μg, i.p.)) and Fc–IL-4 (20 μg, p.t.) every other day for four doses (n = 10 animals). Mice receiving injections of PBS, Fc–IL-4 or ICB only served as controls (n = 5 animals). Cured mice receiving the combination treatment were rechallenged with MC38 cells (1 × 105, s.c.) on day 60. Shown are experimental timeline (h), average tumour growth curves (i) and Kaplan–Meier survival curves (j) of tumour-bearing mice, and survival curves of naive or cured mice that were rechallenged (k) (n = 10 animals). Data are pooled from two independent experiments. All data represent mean ± s.e.m. and are analysed by log-rank test (bg, j and k) or one-way ANOVA and Tukey’s test (i). Schematics in a,h created using BioRender (https://Biorender.com). Source Data
Fig. 3
Fig. 3. Fc–IL-4 enhances the survival of CD8+ TTE cells directly through IL-4Rα signalling.
ae, CD45.1+CD45.2+ C57BL/6 mice bearing B16-gp33 tumours received ACT of activated CD45.2+ Tcf7DTR-GFP P14 T cells (5 × 106, i.v.) 1 day post-lymphodepletion, followed by the injection of diphtheria toxin (DT) (1 µg × 2, i.p.) and subsequent treatment of Fc–IL-4 (20 µg, p.t.) or PBS every other day for four doses. Shown are the experimental timeline (a), counts of tumour-infiltrating P14 CD8+ TTE cells (Tcf7DTR-GFP−PD-1+TIM-3+) (b) (n = 5 animals), mean fluorescence intensity (MFI) of granzyme B (c) (n = 4 animals) and IFNγ (d) (n = 5 animals) of tumour-infiltrating P14 CD8+ TTE cells, and Kaplan–Meier survival curves of mice (n = 8 animals) (e). fj, Mice bearing B16-OVA tumours received ACT of activated WT OT1 or OT1IL-4Rα-KO T cells (1 × 106, i.v.) 1 day after lymphodepletion followed by treatment with Fc–IL-4 (20 µg, p.t.) or PBS every other day for four doses (n = 5 animals). Shown are the experimental timeline (f), counts of tumour-infiltrating OT1 CD8+ TTE cells (g), frequencies of granzyme B+ (h) and TNF+IFNγ+ (i) among tumour-infiltrating OT1 CD8+ TTE cells, and average tumour growth curves (j). k,l, Experimental setting was similar to that described in Fig. 1a except that BrdU (1 mg, i.p.) was injected 24 h before tumour tissue collection (n = 5 animals). Shown are Bcl-2 MFI (k) and frequencies of active Caspase-3+ cells (l) among PMEL and endogenous CD8+ TTE cells. Data are a single representative of two independent experiments. All data represent mean ± s.e.m. and are analysed by one-way ANOVA and Tukey’s test (bd and gj), log-rank test (e) or two-sided unpaired Student’s t-test (k and l). Schematics in a,f created using BioRender (https://Biorender.com). Source Data
Fig. 4
Fig. 4. Fc–IL-4 augments glycolytic metabolism of CD8+ TTE cells through STAT6 signalling and PI3K–AKT–mTOR axis.
a,b, Real-time ECAR analysis (a) and average basal glycolysis, glycolytic capacity and reserve (b) of ex vivo-induced CD8+ TTE cells (n = 5 biological replicates). mpH, milli-pH. c, Volcano plot of altered metabolites in ex vivo-induced CD8+ TTE cells treated with Fc–IL-4 (n = 4 biological replicates) versus PBS (n = 3 biological replicates). df, Experimental setting as described in Fig. 1g. Shown are unsupervised UMAP clustering of PMEL CD8+ TILs based on the 1,667 genes involved in KEGG-defining metabolic pathways (d), cell proportion in each cluster (e) and systematic expression comparison of carbohydrate metabolisms among top four clusters (f). g,h, T cell counts (g) and frequencies of granzyme B+IFNγ+ (h) among ex vivo-induced CD8+ TTE cells with or without 2-DG (n = 4 biological replicates). i,j, Schematic illustration of single-cell ATAC and gene coprofiling of IL-4 versus PBS-treated ex vivo-induced CD8+ TTE cells and a joint ATAC–gene UMAP (i), and volcano plot showing differentially active motifs (j). k,l, Experimental setting as described in Fig. 1g. Shown are signalling pathways regulated by DEGs (k) and top 20 ranked upstream regulators predicted from DEGs (l) in PMEL CD8+ TILs. m, Western blot analysis of indicated proteins in ex vivo-induced CD8+ TTE cells (n = 3 biological replicates). np, Relative basal glycolysis (n) (n = 5 biological replicates), T cell counts (o) and granzyme B MFI (p) (n = 3 biological replicates) in Fc–IL-4-treated ex vivo-induced OT1 and OT1STAT6-KO CD8+ TTE cells (normalized by that in the PBS group) with or without indicated inhibitors. All data represent mean ± s.e.m. and are analysed by two-sided unpaired Student’s t-test (b and g,h), two-tailed Mann–Whitney test (j), right-tailed Fisher’s exact test (k) or one-way ANOVA and Tukey’s test (np). Schematics in i created using BioRender (https://Biorender.com). Source Data
Fig. 5
Fig. 5. Fc–IL-4 promotes LDHA-mediated glycolysis and cellular NAD+ levels of CD8+ TTE cells.
a, Expression of Ldha on the joint UMAP in Fig. 4i and pseudo-bulk chromatin accessibility tracks in the genomic region of Ldha. The enhancer element predicted by ENCODE is highlighted in green. b,c, Western blot (b) and flow cytometry (c) analyses of LDHA expression in ex vivo-induced CD8+ TTE cells with or without treatment of Fc–IL-4 (n = 3 biological replicates). d, Relative counts of Fc–IL-4-treated ex vivo-induced CD8+ TTE cells normalized by those in the PBS group with or without FX11 (n = 3 biological replicates). ei, Mice bearing B16-OVA tumours received ACT of activated WT OT1 or OT1LDHA-KO T cells (1 × 106, i.v.) 1 day after lymphodepletion, followed by treatment with Fc–IL-4 (20 µg, p.t.) or PBS every other day for four doses (n = 5 animals). Shown are the experimental timeline (e), counts (f), granzyme B MFI (g) and IFNγ MFI (h) of tumour-infiltrating OT1 CD8+ TTE cells, and average tumour growth curves (i). j, Schematic illustration of LDHA-mediated NAD+/NADH recycling. k, Cellular NAD+ level of ex vivo-induced CD8+ TTE cells with or without treatment of Fc–IL-4 (n = 3 biological replicates). l, Relative NAD+ levels in Fc–IL-4-treated ex vivo-induced PMEL and PMELLDHA-KD CD8+ TTE cells (normalized by those in the PBS group) (n = 3 biological replicates). m, Real-time ECAR analysis of ex vivo-induced CD8+ TTE cells with or without the treatment with nicotinamide riboside (NR) (n = 5 biological replicates). Data are a single representative of three independent experiments. All data represent mean ± s.e.m. and are analysed by two-sided unpaired Student’s t-test (a, c, d, k and l) or one-way ANOVA and Tukey’s test (fi). Schematics in e,j created using BioRender (https://Biorender.com). Source Data
Extended Data Fig. 1
Extended Data Fig. 1. Characterizations of Fc–IL-4 and investigation of its impact on tumour-infiltrating immune cells.
a, Representative size-exclusion chromatographic traces of Fc–IL-4 fusion protein. Peak 2 (P2) was collected and analysed. b, SDS-PAGE analysis of purified Fc–IL-4. βME, β-mercaptoethanol (Image is one representative of two independent experiments). c, Fold change of PMEL T cell counts (normalized by that in PBS group) upon treatment of IL-4 or Fc–IL-4 at equivalent concentrations in vitro. d, Median effective dose (ED50) of native IL-4 and Fc–IL-4 was determined using the CTLL-2 proliferation assay. e, The pharmacokinetics in plasma and half-life of IL-4 and Fc–IL-4 (n = 3 animals). f, The phenotype, cytokine production, and expression of transcription factors of activated PMEL T cells prior to transfer. g, Experimental setting was described in Fig. 1a. Shown are counts of various tumour-infiltrating immune cells. Treg, regulatory CD4+ T cells; TAMs, tumour-associated macrophages; MDSCs, myeloid-derived suppressive cells. Data are one representative of three independent experiments with n = 3 biological replicates (c, and d) or one representative of two independent experiments with n = 8 animals (g). All data represent mean ± s.e.m. and are analysed by one-way ANOVA and Tukey’s test. Source Data
Extended Data Fig. 2
Extended Data Fig. 2. Fc–IL-4 enriches CD8+ TTE cells in an antigen-dependent manner.
a-c, Experimental setting was similar to that described in Fig. 1a (n = 5 animals). Shown are the representative flow cytometry plots (a) and the frequencies (b) of CD8+ TTE cells (TCF-1-TIM-3+) among PMEL or endogenous CD8+ TILs, and frequencies of Granzyme B+IFNγ+ among different subpopulations of PMEL or endogenous CD8+ TILs (c). d-g, CD45.2+ C57BL/6 mice were sublethally lymphodepleted on day -4 and received adoptive co-transfer of CD45.1+ naive OT1 T cells (2 × 10⁶, i.v.) and CD90.1+ naive PMEL T cells (2 × 10⁶, i.v.) on day -3. The mice were then inoculated with B16F10 tumour cells on day 0. On day 7, the mice were treated with ACT of activated CD90.2+ PMEL T cells (5 × 10⁶, i.v.) followed by administration of Fc–IL-4 (20 µg, p.t.) or PBS every other day for 4 doses. On day 15, mice were euthanized and tumour tissues were collected for flow cytometry analysis (n = 6 animals). Shown are the experimental timeline (d), representative flow cytometry plots (e), frequencies of transferred CD45.1+ OT1 and CD90.1+ PMEL T cells among total CD8+ TILs (f), and frequencies of PD-1+TIM-3+ subpopulation among transferred CD45.1+ OT1 or CD90.1+ PMEL T cells (g). h-j, Experimental setting was similar to that described in Fig. 1a (n = 5 animals). Shown are representative flow cytometry plots (h) and frequencies of IFNγ+ or IL-4+ among PMEL and endogenous CD8+ T cells (i), and frequencies of IFNγ+ or IL-4+ among endogenous CD4+ T cells (j). All data represent mean ± s.e.m. and are analysed by two-way ANOVA and Sidak multiple comparisons test (b, and c), or two-sided unpaired Student’s t-test (f-j). Schematic in d created using BioRender (https://Biorender.com). Source Data
Extended Data Fig. 3
Extended Data Fig. 3. Single-cell RNA-seq analysis of antigen-specific CD8+ T cells treated with Fc–IL-4.
a, Schematic of the experimental setting (as described in Fig. 1g). b, UMAP clustering of all the antigen-specific PMEL CD8+ T cells, split by the treatment condition (PMEL or PMEL + Fc–IL-4). c, Heatmap of differentially expressed genes defining the top 6 identified clusters. d, Comparison of functional gene module expression of all the terminally exhausted-like cells from PMEL or PMEL + Fc–IL-4 group. Genes defining each group are listed below. Statistical analyses are performed using two-sided unpaired Student’s t-test. Schematics in a created using BioRender (https://Biorender.com).
Extended Data Fig. 4
Extended Data Fig. 4. Fc–IL-4 potentiates ACT and ICB immunotherapies and induces long-term immune memory without overt toxicities.
a-j, Experimental setting was described in Fig. 2a. Shown are average and individual tumour growth curves of mice bearing B16F10 (a, and b) (n = 10 animals), YUMM1.7-OVA (c, and d) (n = 7 animals), and MC38-HER2 (f, and g) (n = 14 animals) tumours. HER2-CAR-T cells were analysed by flow cytometry for the frequency of CD4+ and CD8+ T cells prior to transfer (e). Shown are individual tumour growth curves of naive or cured mice re-challenged with B16F10 (h) (n = 6 animals), YUMM1.7-OVA (i) (n = 7 animals), and MC38-HER2 (j) (n = 5 mice) tumour cells. k-m, Experimental setting was similar to that described in Fig. 2a except that the surviving mice were rechallenged with the parental cell line, MC38. Shown are the experimental timeline (k), tumour growth curves (l), and survival curves (m) of the rechallenged mice (n = 5 animals). n, Experimental setting was described in Fig. 2a (n = 5 animals). Surviving mice from the combinatory treatment were euthanized 120 days post-treatment and various tissues were collected for flow cytometry analysis. Shown is the frequencies of effector memory (defined as CD44+CD62L) and central memory (defined as CD44+CD62L+) T cells among PMEL T cells in different tissues. o, Experimental setting was described in Fig. 2a. Shown is the relative body weight of B16F10 tumour-bearing mice. p, q, Experimental setting was similar to that described in Fig. 1a and the peripheral blood was collected on day 14 for AST and ALT liver enzyme assays (n = 5 animals). Shown are serum AST (p) and ALT (q) levels of B16F10 tumour-bearing mice. r, Experimental setting was described in Fig. 2h (n = 5 animals). Shown is the relative body weight of MC38 tumour-bearing mice. Data are one representative of two independent experiments. All data represent mean ± s.e.m. and are analysed by one-way ANOVA and Tukey’s test (a, c, f, p, and q), two-sided unpaired Student’s t-test (h-j, and l), or log-rank test (m). Schematics in k created using BioRender (https://Biorender.com). Source Data
Extended Data Fig. 5
Extended Data Fig. 5. Fc–IL-4 enhances efficacy of human CD19-CAR-T cell therapy.
a, Representative flow cytometry plots showing the frequency of CD4+ and CD8+ T cells among CD19-CAR-T cells prior to transfer. b-d, Human CD19-CAR-T cells were co-cultured with Nalm6 cells at an effector/target (E/T) ratio of 1:8 for 4 days in the presence or absence of hu.Fc–IL-4 (20 ng ml−1). Shown are the counts of total CD19-CAR-T cells (n = 4 biological replicates), CD8+ and CD4+ CD19-CAR-T cells (n = 3 biological replicates) (b), and frequencies of Granzyme B+IFNγ+ among total CD19-CAR-T cells (n = 3 biological replicates), CD8+ and CD4+ CD19-CAR-T cells (n = 4 biological replicates) (c), and percent of cancer cell lysis (d) (n = 4 biological replicates). e-h, NSG mice were inoculated with Raji cells (2 × 10⁶, s.c.) and received ACT of CD19-CAR-T cells (2 × 10⁶, i.v.) on day 6 followed by administration of hu.Fc–IL-4 (20 μg, p.t.) (n = 8 animals) or PBS (n = 7 animals) every other day for 4 doses. Mice receiving injections of PBS or hu.Fc–IL-4 only served as controls (n = 5 animals). Shown are the experimental timeline (e), average tumour growth curves (f), individual tumour growth curves (g), and Kaplan-Meier survival curves (h) of treated mice (n = 8 animals). i-n, NSG mice were inoculated with Nalm6-luciferase cells (1 × 10⁶, i.v.) and received ACT of CD19-CAR-T cells (2 × 10⁶, i.v.) on day 7 followed by administration of hu.Fc–IL-4 (100 ng, i.p.) or PBS. The survivor mice were rechallenged with Nalm6-luciferase cells (1 × 10⁶, i.v.) on day 24 (n = 5 animals). Shown are the experimental timeline (i), Kaplan-Meier survival curves (j), bioluminescence images representing the tumour burden (k), the counts of total CD19-CAR-T cells, CD8+ and CD4+ CD19-CAR-T cells in peripheral blood at various time points following CAR-T cell infusion (l), the MFI of Granzyme B (m) and IFNγ (n) of CD19-CAR-T cells in peripheral blood on day 12 post CAR-T cell infusion. All data represent mean ± s.e.m. and are analysed by two-sided unpaired Student’s t-test (b-d, and l-n), one-way ANOVA and Tukey’s test (f), or log-rank test (h, and j). Schematics in e,i created using BioRender (https://Biorender.com). Source Data
Extended Data Fig. 6
Extended Data Fig. 6. Fc–IL-4 directly acts on CD8+ TTE cells through IL-4Rα for enhanced survival and effector function.
a, B16F10 tumour-bearing mice receiving treatment of ACT of PMEL T cells (5 × 10⁶, i.v.) were injected with lgG, anti-CD8, anti-CD4, anti-NK1.1, or anti-Ly6G antibodies (400 μg × 3, i.p.) to deplete the corresponding immune cells (n = 5 animals). Shown are the Kaplan-Meier survival curves of each treatment group. b-f, Experimental setting was similar to that described in Fig. 3a except that mice were euthanized on day 12 and the tumour-draining lymph node (TDLN), spleen, blood, and tumour tissues were collected for analysis by flow cytometry (n = 5 animals). Shown are the frequencies of Tcf7DTR-GFP+ progenitor exhausted T cells among transferred P14 T cells in the peripheral blood (b), TDLN (c), and tumour (d), and frequencies of TCF-1+Granzyme B among transferred P14 T cells in the TDLN (e), and frequencies of TCF-1+TIM-3- among transferred P14 T cells in the tumour (f). g, h, One day post-lymphodepletion, mice bearing B16F10 tumours received ACT of PD-1+TIM-3- (1 × 10⁶, i.v.) or PD-1+TIM-3+ PMEL T cells (1 × 10⁶, i.v.) on day 7, which were sorted from ex vivo-induced PMEL T cells, followed by the treatment of Fc–IL-4 (20 µg, p.t.) or PBS every other day for 4 doses (n = 5 animals). Mice were euthanized on day 15 and the tumour tissues were collected for analysis by flow cytometry. Shown are the counts of PMEL T cells (g) and frequency of Granzyme B+IFNγ+ among PMEL CD8+ TTE cells (h). i, MFI of IL-4Rα expression among different subsets of tumour-infiltrating CD8+ T cells (n = 5 animals). j, IL-4Rα expression in OT1IL-4Rα-KO T cells examined by flow cytometry (n = 3 biological replicates). k, B16F10 tumour-bearing mice were treated with ACT of PMEL T cells (5 × 10⁶, i.v.) on day 6 followed by administration of Fc–IL-4 (20 µg, p.t.) or PBS every other day for 6 doses, and FTY720 (40 µg, i.p.) every day for 9 doses in total. Mice were euthanized on day 16 to collect the tumour tissues for flow cytometry analysis. Shown are counts of PMEL and endogenous CD8+ TTE cells in the tumour (n = 5 animals). l, m, Experimental setting was described in Fig. 3k. Shown are BrdU MFI (l), and Ki67 MFI (m) of PMEL and endogenous CD8+ TTE cells (n = 5 animals). n-s, B16F10 tumour-bearing mice received ACT of PMEL T cells (5 × 10⁶, i.v.) followed by administration of anti-IL-4 antibody (200 µg, p.t.), or Fc–IL-4 (20 µg, p.t.), or PBS every other day for 6 doses. Mice were euthanized on day 18 and the tumour tissues were collected for analysis by flow cytometry (n = 5 animals). Shown are the experimental timeline (n), average tumour growth curves (o), counts of tumour-infiltrating PMEL CD8+ TTE cells (p), frequencies of Granzyme B+ (q), IFNγ+ (r), and Ki67+ (s) among tumour-infiltrating PMEL CD8+ TTE cells. Data are one representative of two independent experiments. All data represent mean ± s.e.m. and are analysed by log-rank test (a), one-way ANOVA and Tukey’s test (b-k, and o-s), or two-sided unpaired Student’s t-test (l, and m). Schematic in n created using BioRender (https://Biorender.com). Source Data
Extended Data Fig. 7
Extended Data Fig. 7. Fc–IL-4 enhances glycolytic metabolism of CD8+ TTE cells in vitro and in vivo.
a-e, Ex vivo-induced CD8+ TTE cells were re-stimulated by dimeric anti-CD3 antibody (0.5 µg ml−1) for 48 h in the presence or absence of Fc–IL-4 (n = 3 biological replicates). Shown are the Glut-1 MFI (a), WB images of Glut-1 (b), glucose uptake capacity measured by the 2-NBDG assay (c) and the Glucose Colorimetric Detection Kit (Invitrogen™, EIAGLUC) (d), and extracellular lactate concentration (e). f, Real-time OCR analysis of ex vivo-induced CD8+ TTE cells re-stimulated by dimeric anti-CD3 antibody (0.5 µg ml−1) for 48 h in the presence or absence of Fc–IL-4 (n = 3 biological replicates). g, Average basal and maximal OCR calculated from f. pmol, pico mole. h, The ratio of basal and maximal ECAR to OCR. i-l, Ex vivo-induced CD8+ TTE cells were re-stimulated by dimeric anti-CD3 antibody (0.5 µg ml−1) and treated with Fc–IL-4 (n = 4 biological replicates) or PBS (n = 3 biological replicates). The metabolites were collected for metabolomics analysis. Shown are the schematic illustration of metabolomic analysis (i), Principal Component Analysis (PCA) of 120 metabolites of CD8+ TTE cells (j), and heatmap showing the metabolic expression pattern of each sample in the Fc–IL-4 and PBS groups (k). The fold change between Fc–IL-4 vs. PBS was calculated for each metabolite, and only metabolites with significant differences (p < 0.05) were included. Shown are the cellular ion counts of glyceraldehyde 3-phosphate, phosphoenolpyruvate, and lactate in ex vivo-induced CD8+ TTE cells (l). Multiple pathway targeted analysis results of metabolites are provided in Supplementary Table 1. m, Experimental setting was described in Fig. 1g. Shown is the systematic expression comparison of carbohydrate metabolisms across all identified clusters in Fig. 4d, with each metabolic pathway name indicated. The size of circle represents proportion of single cells expressing the pathway, and the colour shade indicates normalized expression level. Genes defining each pathway are provided in Supplementary Table 2. n, o, B16F10 tumour cells were co-cultured with ex vivo-induced CD8+ TTE cells in the presence or absence of Fc–IL-4 with or without the treatment of 2-DG (10 mM) (n = 3 biological replicates). Shown are the frequencies of CD107a+ among CD8+ T cells (n) and percent of cancer cell lysis (o). Data are one representative of three independent experiments. All data represent mean ± s.e.m. and are analysed by two-sided unpaired Student’s t-test. Schematic in i created using BioRender (https://Biorender.com). Source Data
Extended Data Fig. 8
Extended Data Fig. 8. Single-cell ATAC and gene co-profiling analysis of IL-4 treated PMEL CD8+ TTE cells and upstream regulator analysis based on scRNA-seq results.
a, Quality assessment of sequenced data from IL-4 or PBS conditions, featuring TSS enrichment score, insert size distribution, unsupervised clustering analysis of ATAC and gene datasets, and corresponding count distribution. Consistent performance is observed with negligible batch effect. b, Gene or ATAC expression UMAP of all the single cells color-coded by their respective conditions. c, d, Expression of functional cytotoxicity (c) and survival (d) gene markers on the joint UMAP in Fig. 4i, along with comparisons of corresponding accessible peaks between conditions. Statistical analyses were performed using two-sided unpaired Student’s t-test. e, Experimental setting was described in Fig. 1g. Shown is the mechanistic networks associated with the significant activation of selected upstream regulators in Fc–IL-4 treated PMEL CD8+ TILs relative to the PBS condition. z score is computed and used to reflect the predicted activation level (z > 0, activated/upregulated; z < 0, inhibited/downregulated; z ≥ 2 or z ≤ −2 can be considered significant). Statistical analyses are performed using right-tailed Fisher’s Exact Test.
Extended Data Fig. 9
Extended Data Fig. 9. Fc–IL-4 enhances the glycolytic metabolism of CD8+ TTE cells through STAT6 signalling and PI3K-AKT-mTOR axis.
a-c, Ex vivo-induced PMEL CD8+ TTE cells were re-stimulated by dimeric anti-CD3 antibody (0.1 µg ml−1) in the presence or absence of Fc–IL-4 (n = 4 biological replicates) for 0.5 h. Shown are the representative flow cytometry plots and MFI of p-STAT6 (a), p-AKT (Ser473) (b), p-P70S6K (Thr389) (c). d, STAT6 was knock-out in OT1 T cells using CRISPR-Cas9 gene editing (n = 3 biological replicates). Shown are representative flow cytometry plots and MFI of STAT6. e-i, Ex vivo-induced OT1 and OT1STAT6-KO CD8+ TTE cells were re-stimulated by dimeric anti-CD3 antibody (0.5 µg ml−1) with AKT inhibitor VIII (HY-10355, 1 µM), mTOR inhibitor (Rapamycin, 100 nM), or no inhibitors, in the presence or absence of Fc–IL-4 for 24 h (n = 3 biological replicates). Shown are relative maximal ECAR (e), Glut-1 MFI (f), glucose uptake capacity (g), Bcl-2 MFI (h), and CD107a MFI (i) in the Fc–IL-4 treatment group normalized by that in the PBS group. j-m, Ex vivo-induced PMEL CD8+ TTE cells were re-stimulated by dimeric anti-CD3 antibody (0.5 µg ml−1) and treated with AKT inhibitor VIII (HY-10355, 1 µM), mTOR inhibitor (Rapamycin, 100 nM), or STAT6 inhibitor (AS1517499, 50 nM) in the presence or absence of Fc–IL-4 for 24 h (n = 3 biological replicates). Shown are relative Glut-1 MFI (j), T cell viability (k), CD107a MFI (l), and Granzyme B MFI (m) in the Fc–IL-4 treatment group normalized by that in the PBS group. n, Visualization of motif activity expression for Stat5a (MA1624.1) and Stat5b (MA1625.1) on the joint UMAP in Fig. 4i. o-u, Ex vivo-induced PMEL CD8+ TTE cells were re-stimulated by dimeric anti-CD3 antibody (0.5 µg ml−1) and treated with inhibitors for STAT6 (AS1517499, 50 nM) or STAT5 (Bestellnummer 573108, 25 µM) in the presence or absence of Fc–IL-4 (n = 3 biological replicates). Shown are frequency of Glut-1+ among PMEL CD8+ TTE cells (o), glucose uptake capacity of PMEL CD8+ TTE cells (p), and relative level of basal ECAR (q), maximal ECAR (r), T cell counts (s), CD107a MFI (t), and Granzyme B MFI (u) in the Fc–IL-4 treatment group normalized by that in the PBS group. Data are one representative of three independent experiments. All data represent mean ± s.e.m. and are analysed by two-sided unpaired Student’s t-test (a-d, and o), or by one-way ANOVA and Tukey’s test (e-m, and p-u). Source Data
Extended Data Fig. 10
Extended Data Fig. 10. Fc–IL-4 reinvigorates CD8+ TTE cells by enhancing LDHA-dependent glycolysis and promoting the cellular NAD+ level.
a, b, Experimental setting was described in Fig. 4i. Shown is a volcano plot showing differential gene expression between IL-4 vs. PBS-treated PMEL CD8+ TTE cells (a), and expression of glycolysis pathway gene markers on the joint UMAP along with comparisons of corresponding accessible peaks between conditions (b). c, Relative expression of LDHA in Fc–IL-4-treated ex vivo-induced OT1 and OT1STAT6-KO CD8+ TTE cells (normalized by that in PBS group) with or without indicated inhibitors (n = 3 biological replicates). d-i, WT PMEL or PMELLDHA-KD T cells were re-stimulated by dimeric anti-CD3 antibody (0.5 µg ml−1) in the presence or absence of Fc–IL-4 (n = 4 biological replicates). Shown are the relative transcriptome level (d) and MFI of LDHA (e) in WT PMEL and PMELLDHA-KD T cells, and the relative basal (f) and maximal (g) ECAR, and relative counts of CD8+ TTE cells (h) and Granzyme B+IFNγ+ polyfunctional CD8+ TTE cells (i) in the Fc–IL-4 treatment group normalized by that in the PBS group. j-m, WT PMEL or PMELLDHA-OE T cells were co-cultured with B16F10 for 48 h (n = 3 biological replicates). Shown are representative flow cytometry plots and LDHA MFI (j), T cell counts (k), percent of cancer cell lysis (l), and frequencies of Granzyme B+IFNγ+ (m) among WT PMEL and PMELLDHA-OE T cells. n, WB images of LDHA showing the LDHA knock-out in OT1LDHA-KO T cells. o, PD-1+TIM-3- and PD-1+TIM-3+ PMEL T cells were sorted from ex vivo-induced PMEL T cells. The cellular level of NAD+ and NADH was assessed in both cell subsets. Shown is the ratio of NAD+ to NADH in the two cell subsets (n = 3 biological replicates). p, q, Experimental setting was described in Extended Data Fig. 7i. Shown are the cellular ion counts of metabolites engaged in nicotinate and nicotinamide metabolic pathways (p), and metabolic pathways enriched in Fc–IL-4 treated cells vs. PBS control group using metabolite set enrichment analysis (q). r, The cellular NAD+ level of ex vivo-induced CD8+ TTE cells with supplementation of a NAD+ precursor, nicotinamide riboside (NR) (100 µM) (n = 3 biological replicates). s, Ex vivo-induced CD8+ TTE cells were re-stimulated by dimeric anti-CD3 antibody (0.5 μg ml−1) for 48 h in the presence or absence of NR (100 μM). Shown are average basal glycolysis, glycolytic capacity, and glycolytic reserve analysed from Fig. 5m (n = 5 biological replicates). t, Ex vivo-induced CD8+ TTE cells were re-stimulated by dimeric anti-CD3 antibody (0.5 µg ml−1) for 48 h in the presence or absence of NR (100 µM). Shown are the counts (n = 3 biological replicates) and viability (n = 4 biological replicates) of CD8+ TTE cells. u, Ex vivo-induced CD8+ TTE cells were co-cultured with B16F10 tumour cells for 48 h in the presence or absence of NR (100 µM) (n = 4 biological replicates). Shown are the percent of cancer cell lysis and CD107a MFI of CD8+ TTE cells. Data are one representative of three independent experiments. All data represent mean ± s.e.m. and are analysed by two-sided unpaired Student’s t-test (b, d-m, and o-u), or one-way ANOVA and Tukey’s test (c). Source Data

References

    1. Wei, S. C. et al. Distinct cellular mechanisms underlie anti-CTLA-4 and anti-PD-1 checkpoint blockade. Cell170, 1120–1133 (2017). - PMC - PubMed
    1. Lee, E. H. J. et al. Antigen-dependent IL-12 signaling in CAR T cells promotes regional to systemic disease targeting. Nat. Commun.14, 4737 (2023). - PMC - PubMed
    1. Gao, S., Hsu, T. W. & Li, M. O. Immunity beyond cancer cells: perspective from tumor tissue. Trends Cancer7, 1010–1019 (2021). - PMC - PubMed
    1. Bai, Z. et al. Single-cell antigen-specific landscape of CAR T infusion product identifies determinants of CD19-positive relapse in patients with ALL. Sci. Adv.8, eabj2820 (2022). - PMC - PubMed
    1. Gocher, A. M., Workman, C. J. & Vignali, D. A. A. Interferon-γ: teammate or opponent in the tumour microenvironment? Nat. Rev. Immunol.22, 158–172 (2022). - PMC - PubMed

MeSH terms