. 2024 Oct;634(8035):995-1003.
doi: 10.1038/s41586-024-07966-0. Epub 2024 Sep 25.

The genetic architecture of protein stability

Affiliations

The genetic architecture of protein stability

Andre J Faure et al. Nature. 2024 Oct.

Abstract

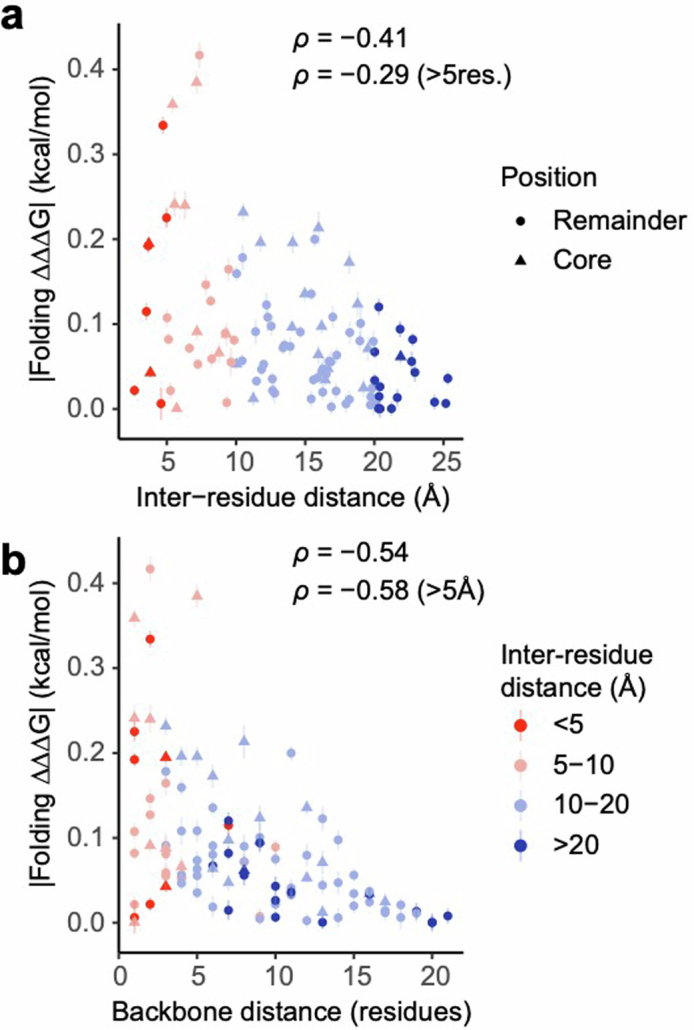
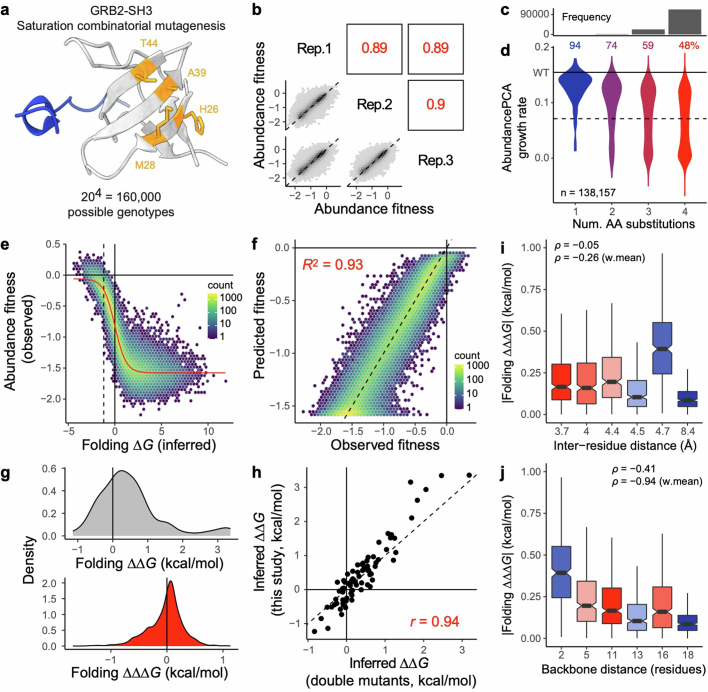
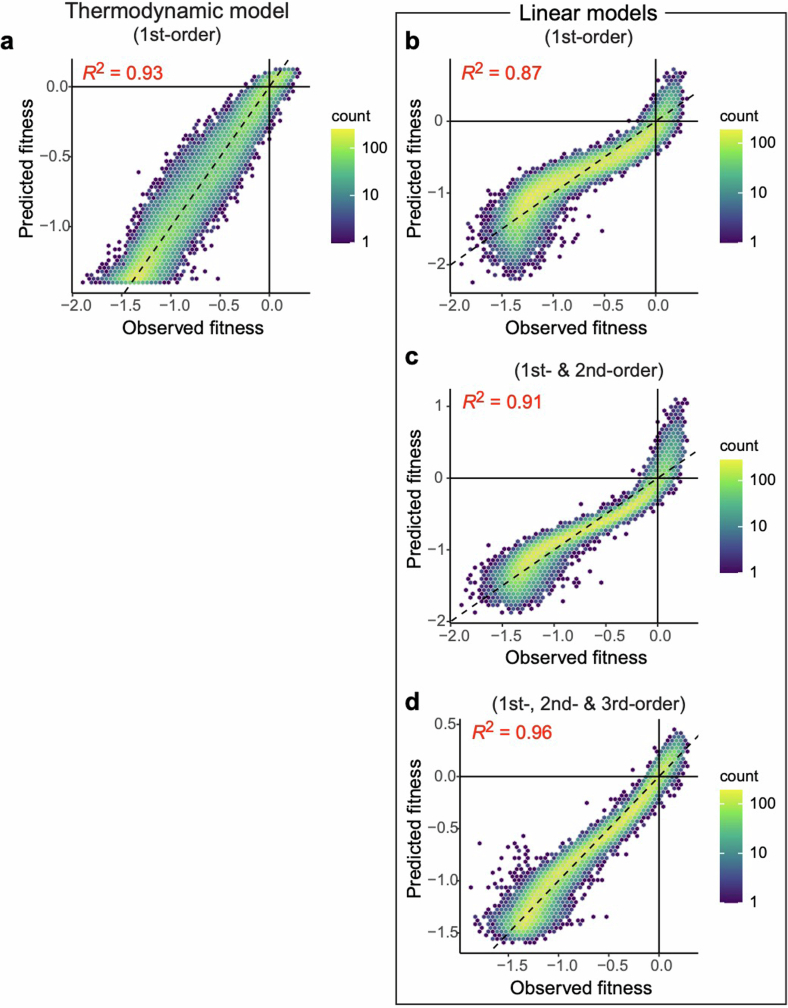
There are more ways to synthesize a 100-amino acid (aa) protein (20100) than there are atoms in the universe. Only a very small fraction of such a vast sequence space can ever be experimentally or computationally surveyed. Deep neural networks are increasingly being used to navigate high-dimensional sequence spaces1. However, these models are extremely complicated. Here, by experimentally sampling from sequence spaces larger than 1010, we show that the genetic architecture of at least some proteins is remarkably simple, allowing accurate genetic prediction in high-dimensional sequence spaces with fully interpretable energy models. These models capture the nonlinear relationships between free energies and phenotypes but otherwise consist of additive free energy changes with a small contribution from pairwise energetic couplings. These energetic couplings are sparse and associated with structural contacts and backbone proximity. Our results indicate that protein genetics is actually both rather simple and intelligible.


Conflict of interest statement

A.J.F. and B.L. are founders, employees and shareholders of ALLOX. J.M.S. is a founder, employee and shareholder of factorize.bio.

Figures

Fig. 1
Fig. 1. An efficient strategy to explore high-dimensional protein sequence space and enrich multi-mutants for conserved fold and function.
a, Violin plot showing distributions of simulated AbundancePCA growth rates (assuming additivity of individual inferred folding free energy changes) versus number of random aa substitutions (n = 100,000). Violins are scaled to have the same maximum width. b, DMS data, energy model and algorithm used to select a set of single aa substitutions for combinatorial mutagenesis. A shallow double-mutant library of GRB2-SH3 protein variants was assayed by AbundancePCA (see panel c) and BindingPCA (see Fig. 4b; in combination referred to as ddPCA), followed by energy modelling to infer single aa substitution free energy changes of folding and binding. We used this model together with a greedy algorithm to select a set of 34 single aa substitutions that, when combined, would simultaneously maximize both the predicted AbundancePCA and BindingPCA growth rates, that is, preserving both fold and function. 3D structure of GRB2-SH3 (PDB: 2VWF) indicating the 34 combinatorially mutated residues (orange) and GAB2 ligand (blue) is shown on the right. c, Overview of AbundancePCA on the protein of interest (GRB2-SH3). yes, yeast growth; no, yeast growth defect; DHF, dihydrofolate; THF, tetrahydrofolate. d, Scatter plots showing the reproducibility of fitness estimates from triplicate AbundancePCA experiments. Pearson’s r is indicated in red. Rep., biological replicate. e, Histogram showing the number of observed aa variants at increasing Hamming distances from the wild type (denoted by WT), for which the x axis is shared with panel f. f, Violin plot showing distributions of AbundancePCA growth rates inferred from deep sequencing data versus number of aa substitutions. In panels a and f, the percentage of folded protein variants (predicted fraction folded molecules > 0.5) is shown at each Hamming distance from the wild type.
Fig. 2
Fig. 2. Thermodynamic modelling of protein abundance to infer folding free energy changes and energetic couplings.
a, Two-state equilibrium and corresponding neural network architecture used to fit thermodynamic model to AbundancePCA data (bottom, target and output data), thereby inferring the causal changes in free energy of folding associated with single aa substitutions (top, input values). ΔGf, Gibbs free energy of folding; Kf, folding equilibrium constant; pf, fraction folded; g, nonlinear function of ΔGf; R, gas constant; T, temperature in kelvin. b, Performance of first-order linear models (left column) and first-order energy models (right column) evaluated on GRB2-SH3 combinatorial AbundancePCA data. The top row indicates the results of models that were trained on a subset of the same combinatorial DMS data. The bottom row indicates the results of models that were trained on GRB2-SH3 ddPCA data consisting of single and double aa substitutions only. R2 is the proportion of variance explained. c, Nonlinear relationship (global epistasis) between observed AbundancePCA fitness and changes in free energy of folding. Thermodynamic model fit is shown in red. d, Comparisons of the model-inferred free energy changes to previously reported estimates using GRB2-SH3 ddPCA data. Pearson’s r is shown. e, Performance of energy model that includes all first-order and second-order genetic interaction (energetic coupling) terms/coefficients. See Extended Data Fig. 2 for plots of the residuals versus fitted values for linear and energy models of the first and second order. f, Distributions of folding free energy changes (ΔΔG, grey) and pairwise energetic couplings (ΔΔΔG, red). WT, wild type.
Fig. 3
Fig. 3. Structural determinants of energetic couplings inferred from combinatorial mutagenesis.
a, Relationship between folding coupling energy strength and minimal inter-residue side-chain heavy-atom distance. The mean is shown and error bars indicate 95% confidence intervals from a Monte Carlo simulation approach (n = 10 experiments). Points are coloured by binned inter-residue distances (see legend in panel b). Spearman’s ρ is shown for all couplings (top value), as well as those involving pairs of residues separated by more than five residues in the primary sequence (bottom value). Core residues are indicated as triangles. b, Relationship between folding coupling energy strength and linear sequence (backbone) distance in number of residues. The measure of centre and error bars are as defined in panel a. c, Interaction matrix indicating folding energy coupling strength, as well as pairwise structural contacts in GRB2-SH3 (Protein Data Bank (PDB): 2VWF; minimal side-chain heavy-atom distance < 8 Å, black circles). Grey cells indicate missing values (non-mutated residues) and constitutive single aa substitutions are indicated in the x-axis and y-axis labels. Black diagonal lines demarcate residue pairs that are distal in the primary sequence (backbone distance > 5 residues). Reference secondary structure elements (arrow, beta strand) are shown at the top and right. d, 3D structure of GRB2-SH3 (PDB: 2VWF) indicating the top ten energetic couplings with black dashed lines. Combinatorially mutated residues are shown in orange. e, Bar plot showing ranked features from the linear model to predict folding coupling strength. Bar width indicates coefficient significance (P value from uncorrected two-sided t-test). Blue, positive coefficient; red, negative coefficient; grey, non-significant (P > 0.05). f, Correlation between linear model predicted and observed folding coupling strength for training (top) and test (bottom) data. Pearson’s r is shown. The error bands represent the 95% confidence intervals for the predicted values.
Fig. 4
Fig. 4. Combinatorial ddPCA shows that abundant multi-mutants are binding-competent (have a conserved fold).
a, 3D structure of GRB2-SH3 (PDB: 2VWF) indicating 15 combinatorially mutated residues in library 3 (orange) and GAB2 ligand (blue). b, Overview of BindingPCA of GRB2-SH3 binding to GAB2 (ref. ). no, yeast growth defect; DHF, dihydrofolate; THF, tetrahydrofolate. c, Scatter plots showing the reproducibility of fitness estimates from triplicate BindingPCA experiments. Pearson’s r indicated in red. Rep., biological replicate. d, 2D density plots comparing abundance and binding fitness of third-order (left), sixth-order (middle) and ninth-order mutants (right). See Extended Data Fig. 6g for similar plots at all mutant orders. e, Three-state equilibrium and corresponding thermodynamic model. ΔGf, Gibbs free energy of folding; ΔGb, Gibbs free energy of binding; Kf, folding equilibrium constant; Kb, binding equilibrium constant; c, ligand concentration; pf, fraction folded; pfb, fraction folded and bound; R, gas constant; T, temperature in kelvin. f, Neural network architecture used to fit thermodynamic model to ddPCA data (bottom, target and output data), thereby inferring the causal changes in free energy of folding and binding associated with single aa substitutions (first-order terms) and pairwise (second-order) interaction terms (top, input values). Variables as per panel e and: gf, nonlinear function of ΔGf; gfb, nonlinear function of ΔGf and ΔGb. g, Nonlinear relationships between observed AbundancePCA fitness and changes in free energy of folding (top) or BindingPCA fitness and free energies of both binding and folding (bottom). Thermodynamic model fit is shown in red. h, Performance of models fit to ddPCA data. R2, proportion of explained variance. i, Comparisons of the model-inferred single aa substitution free energy changes to previously reported estimates using GRB2-SH3 ddPCA data. Pearson’s r is shown.
Fig. 5
Fig. 5. Proximity and connectivity of residues near the binding interface explain energetic effects on binding affinity.
a, Relationship between the absolute change in free energy of folding (top) and binding (bottom) and minimal side-chain heavy-atom distance to the ligand. Residues are coloured by their position in the structure relative to the binding interface, triangles indicate beta strand residues and connection lines indicate the strength of energetic couplings between aa pairs (see legend). Spearman’s ρ is shown. b, Interaction matrix indicating folding (top) and binding (bottom) coupling terms, as well as pairwise structural contacts in GRB2-SH3 (PDB: 2VWF; minimal side-chain heavy-atom distance < 8 Å, black circles). Grey cells indicate missing values (non-mutated residues) and constitutive single aa substitutions are indicated in the x-axis and y-axis labels (see panel a for axis label text colour key). Mutations in beta strand residues are indicated and couplings between beta strand residues are boxed. The bar plots above and to the right of the binding interaction matrix indicate the total number of pairwise physical interactions (<8 Å) involving each residue, with green bars indicating the fraction of interacting partners classified as second-shell residues. The strongest binding energetic coupling (P11A:G18C) is indicated by an arc.
Fig. 6
Fig. 6. Combinatorial mutagenesis of SRC.
a, 3D structure of SRC (PDB: 2SRC) indicating the 15 combinatorially mutated residues in library 4 (orange) and ATP (blue). b, Scatter plots showing the reproducibility of fitness estimates from triplicate AbundancePCA experiments. Pearson’s r indicated in red. Rep., biological replicate. c, Histogram showing the number of observed aa variants at increasing Hamming distances from the wild type, in which the x axis is shared with panel d. d, Violin plot showing distributions of abundance growth rates inferred from deep sequencing data versus number of aa substitutions. The percentage of bound protein variants (predicted fraction bound molecules > 0.5) is shown at each Hamming distance from the wild type. e, Nonlinear relationship (global epistasis) between observed abundance fitness and changes in free energy of folding. Thermodynamic model fit is shown in red. f, Performance of energy model that includes all first-order and second-order genetic interaction (energetic coupling) terms/coefficients. g, Relationship between folding coupling energy strength and minimal inter-residue side-chain heavy-atom distance. The mean is shown and error bars indicate 95% confidence intervals from a Monte Carlo simulation approach (n = 10 experiments). Points are coloured by binned inter-residue distances (see legend in panel h). Spearman’s ρ is shown for all couplings (top value), as well as those involving pairs of residues separated by more than five residues in the primary sequence (bottom value). Core residues are indicated as triangles. h, Relationship between folding coupling energy strength and linear sequence (backbone) distance in number of residues.
Extended Data Fig. 1
Extended Data Fig. 1. Combinatorial mutagenesis library 1 design and simulations.
a, Violin plot showing distributions of simulated AbundancePCA growth rates (assuming additivity of individual inferred folding free energy changes) versus number of random aa substitutions (n = 100,000) for PSD95-PDZ3. Violins are scaled to have the same maximum width. b, Simulated median AbundancePCA/BindingPCA growth rates of optimal combinatorial libraries of increasing maximum aa Hamming distances from the wild type. The horizontal dashed line indicates the 70th percentile of the maximal geometric mean (black). The vertical dashed line indicates the number of aa substitutions selected (n = 34) for the synthesized combinatorial mutagenesis library 1. c, Violin plot showing simulated distributions of AbundancePCA growth rates versus number of aa substitutions for combinatorial mutagenesis library 1. d, Similar to panel c but showing simulated distributions for BindingPCA growth rates. In panels c and d, the percentage of folded and bound protein variants (predicted fraction folded or bound molecules > 0.5) is shown at each Hamming distance from the wild type.
Extended Data Fig. 2
Extended Data Fig. 2. Residuals versus fitted values for linear and thermodynamic models fit to AbundancePCA data from combinatorial library 1.
a, Residual fitness (observed − predicted) versus predicted fitness for first-order linear models (left) and first-order thermodynamic models (right) evaluated on GRB2-SH3 combinatorial AbundancePCA data (combinatorial library 1; see Fig. 1). The smoothed conditional mean (generalized additive model) is shown in red. b, Similar to panel a except models include all first-order and second-order genetic interaction (energetic coupling) terms/coefficients. c, Similar to panel a except results are shown for models that were trained on GRB2-SH3 ddPCA data consisting of single and double aa substitutions only.
Extended Data Fig. 3
Extended Data Fig. 3. Structural determinants of energetic couplings inferred from ddPCA data from combinatorial library 3.
a, Relationship between folding coupling energy strength and minimal inter-residue side-chain heavy-atom distance for combinatorial library 3 (see Fig. 4). The mean is shown and error bars indicate 95% confidence intervals from a Monte Carlo simulation approach (n = 10 experiments). Points are coloured by binned inter-residue distances (see legend in panel b). Spearman’s ρ is shown for all couplings, as well as those involving pairs of residues separated by more than five residues in the primary sequence. Core residues are indicated as triangles. b, Relationship between folding coupling energy strength and linear sequence (backbone) distance in number of residues. The measure of centre and error bars are as defined in panel a.
Extended Data Fig. 4
Extended Data Fig. 4. Design of combinatorial mutagenesis libraries 2 and 3.
a, Clustered heat map showing structural contacts (minimal side-chain heavy-atom distance < 5 Å) between all GRB2-SH3 surface residues (RSASA ≥ 0.25) existing in secondary structure elements. The four highlighted residues are all physically proximal and were selected as the targets for library 2 saturation combinatorial mutagenesis (see Extended Data Fig. 5). b, Bar plot indicating the number of candidate mutant residues in stretches of 20, 21 and 22 consecutive residues in GRB2-SH3 used to design mutagenesis library 3. Candidate mutations were defined as single aa substitutions with mild effects (within one-third of the AbundancePCA fitness interquartile range of the wild type) in close proximity in the primary sequence and reachable by single-nucleotide substitutions while avoiding mutations in binding interface residues (minimal side-chain heavy-atom distance to the ligand < 5 Å). The selected mutant window size (22 aa residues), residue start position (10) and number of mutated residues (15) is indicated. The final library consisted of all combinations of the following randomly selected candidate mutations at these 15 positions: D10N, P11A, D14N, G15E, G18C, R20S, R21Q, D23E, F24I, H26L, V27I, M28K, D29E, N30T and S31T (see Fig. 4).
Extended Data Fig. 5
Extended Data Fig. 5. Saturation combinatorial mutagenesis of a protein surface patch.
a, 3D structure of GRB2-SH3 (PDB: 2VWF) indicating four residues targeted for saturation combinatorial mutagenesis (orange, library 2) and GAB2 ligand (blue). See also Extended Data Fig. 4. b, Scatter plots showing the reproducibility of fitness estimates from triplicate AbundancePCA experiments. Pearson’s r indicated in red. Rep., biological replicate. c, Histogram showing the number of observed aa variants at increasing Hamming distances from the wild type, in which the x axis is shared with panel d. d, Violin plot showing distributions of AbundancePCA growth rates inferred from deep sequencing data versus number of aa substitutions. The percentage of folded protein variants (predicted fraction folded molecules > 0.5) is shown at each Hamming distance from the wild type. e, Nonlinear relationship (global epistasis) between observed AbundancePCA fitness and changes in free energy of folding. Thermodynamic model fit shown in red. f, Performance of energy model including all first-order and second-order genetic interaction (energetic coupling) terms/coefficients. g, Distributions of folding free energy changes (ΔΔG, grey) and pairwise energetic couplings (ΔΔΔG, red). h, Comparisons of the model-inferred single aa substitution free energy changes to previously reported estimates using GRB2-SH3 ddPCA data. Pearson’s r is shown. i, Box plots showing relationship between folding coupling energy strength and minimal inter-residue side-chain heavy-atom distance. Boxes are coloured by inter-residue distance. Spearman’s ρ is shown for all couplings (n = 2,166 second-order coefficients), as well as the weighted mean per residue pair (n = 6 residue pairs). j, Relationship between folding coupling energy strength and linear sequence (backbone) distance in number of residues. Boxes are coloured as in panel i. For box plots in panels i and j: centre line, median; box limits, upper and lower quartiles; whiskers, 1.5× interquartile range; n = 2,166 second-order coefficients.
Extended Data Fig. 6
Extended Data Fig. 6. ddPCA data from combinatorial library 3 show that abundant multi-mutants are binding-competent (have conserved fold).
a, Scatter plots showing the reproducibility of fitness estimates from triplicate AbundancePCA experiments for combinatorial library 3 (see Fig. 4). Pearson’s r indicated in red. Rep., biological replicate. b, Similar to panel a but showing results from triplicate BindingPCA experiments (same as Fig. 4c). c, Histogram showing the number of observed aa variants at increasing Hamming distances from the wild type for AbundancePCA, in which the x axis is shared with panel d. d, Violin plot showing distributions of AbundancePCA growth rates inferred from deep sequencing data versus number of aa substitutions. The percentage of folded protein variants (predicted fraction folded molecules > 0.5) is shown at each Hamming distance from the wild type. e,f, Similar to panels c and d but showing results for BindingPCA. The percentage of bound protein variants (predicted fraction folded molecules > 0.5) is shown at each Hamming distance from the wild type in panel f. g, 2D density plots comparing abundance and binding fitness for increasing Hamming distances 1–14 from the wild type as indicated.
Extended Data Fig. 7
Extended Data Fig. 7. Performance of models fit to AbundancePCA data from combinatorial library 3.
a, Performance of first-order two-state thermodynamic model (folded and unfolded states) fit to AbundancePCA data from combinatorial library 3 (see Fig. 4). bd, Performance of first-order (b), second-order (c) and third-order (d) linear models fit to AbundancePCA data from combinatorial library 3 (see Fig. 4). R2 is the proportion of variance explained.

References

    1. Notin, P., Rollins, N., Gal, Y., Sander, C. & Marks, D. Machine learning for functional protein design. Nat. Biotechnol.42, 216–228 (2024). - PubMed
    1. Kinney, J. B. & McCandlish, D. M. Massively parallel assays and quantitative sequence–function relationships. Annu. Rev. Genom. Hum. Genet.20, 99–127 (2019). - PubMed
    1. Fowler, D. M. & Fields, S. Deep mutational scanning: a new style of protein science. Nat. Methods11, 801–807 (2014). - PMC - PubMed
    1. Olson, C. A., Wu, N. C. & Sun, R. A comprehensive biophysical description of pairwise epistasis throughout an entire protein domain. Curr. Biol.24, 2643–2651 (2014). - PMC - PubMed
    1. Nedrud, D., Coyote-Maestas, W. & Schmidt, D. A large-scale survey of pairwise epistasis reveals a mechanism for evolutionary expansion and specialization of PDZ domains. Proteins89, 899–914 (2021). - PubMed