. 2024 Oct;634(8032):61-68.
doi: 10.1038/s41586-024-07930-y. Epub 2024 Sep 25.

Larger and more instructable language models become less reliable

Affiliations

Larger and more instructable language models become less reliable

Lexin Zhou et al. Nature. 2024 Oct.

Abstract

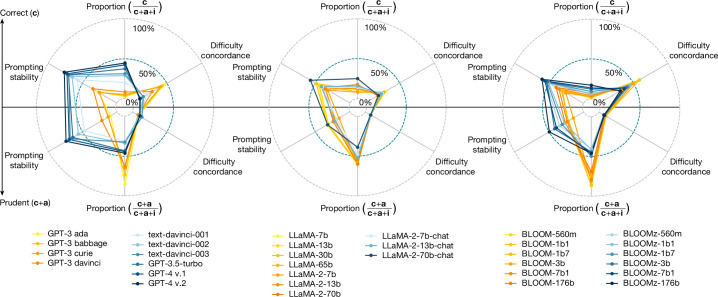
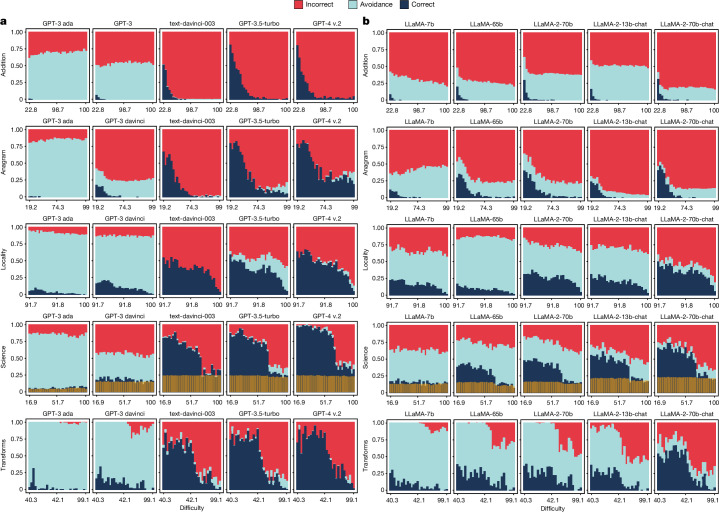
The prevailing methods to make large language models more powerful and amenable have been based on continuous scaling up (that is, increasing their size, data volume and computational resources1) and bespoke shaping up (including post-filtering2,3, fine tuning or use of human feedback4,5). However, larger and more instructable large language models may have become less reliable. By studying the relationship between difficulty concordance, task avoidance and prompting stability of several language model families, here we show that easy instances for human participants are also easy for the models, but scaled-up, shaped-up models do not secure areas of low difficulty in which either the model does not err or human supervision can spot the errors. We also find that early models often avoid user questions but scaled-up, shaped-up models tend to give an apparently sensible yet wrong answer much more often, including errors on difficult questions that human supervisors frequently overlook. Moreover, we observe that stability to different natural phrasings of the same question is improved by scaling-up and shaping-up interventions, but pockets of variability persist across difficulty levels. These findings highlight the need for a fundamental shift in the design and development of general-purpose artificial intelligence, particularly in high-stakes areas for which a predictable distribution of errors is paramount.


Conflict of interest statement

The authors declare no competing interests. Some authors received economic compensation for red teaming some of the models that appear in this study, as well as for red teaming other models created by the same companies.

Figures

Fig. 1
Fig. 1. Key indicators for several models in GPT (OpenAI), LLaMA (Meta) and BLOOM (BigScience) families.
The raw models (yellow to orange) and the shaped-up models (light to dark blue) cluster differently. As the answers for all these models fall into three categories (correct, avoidant and incorrect), shortened as c, a and i, respectively, we have indicators for correctness versus avoidance + incorrectness, and prudence (correctness + avoidance) versus incorrectness. Looking at the correctness indicators (top half), which represent accurate responses, we see that the shaped-up models are more stable to prompt variations and are more frequently correct (higher correctness proportion) but are less concordant with human difficulty than the raw counterparts. Looking at the prudence indicators (bottom half), we see that the shaped-up models are also more stable to prompt variations, but fail more frequently (lower prudence proportion, by avoiding less) and are not much more concordant with human difficulty. Focusing only on the shaped-up models (in blue), we observe that the most powerful GPT-4 v.2, LLaMA-2-70b-chat and BLOOMz-176b models perform best in correctness proportion and prompting stability (top and bottom), but equal to or worse than other models for all the other indicators, with many fluctuations that do not indicate a clear positive trend in these other dimensions. Details of the indicators and data used for this plot are found in the Methods. Extended Data Table 1 provides a more detailed perspective on the same results. Source Data
Fig. 2
Fig. 2. Performance of a selection of GPT and LLaMA models with increasing difficulty.
The values are split by correct, avoidant and incorrect results. For each combination of model and benchmark, the result is the average of 15 prompt templates (see Supplementary Tables 1 and 2). For each benchmark, we show its chosen intrinsic difficulty, monotonically calibrated to human expectations on the x axis for ease of comparison between benchmarks. The x axis is split into 30 equal-sized bins, for which the ranges must be taken as indicative of different distributions of perceived human difficulty across benchmarks. For ‘science’, the transparent yellow bars at the bottom represent the random guess probability (25% of the non-avoidance answers). Plots for all GPT and LLaMA models are provided in Extended Data Figs. 1 and 2 and for the BLOOM family in Supplementary Fig. 14. Source Data
Fig. 3
Fig. 3. Evolution of types of supervision error versus difficulty according to human survey S2.
In the survey (Supplementary Fig. 4), participants have to determine whether the output of a model is correct, avoidant or incorrect (or do not know, represented by the ‘unsure’ option in the questionnaire). Difficulty (x axis) is shown in equal-sized bins. We see very few areas where the dangerous error (incorrect being considered correct by participants) is sufficiently low to consider a safe operating region. Source Data
Fig. 4
Fig. 4. Scaling analysis of LLaMA and BLOOM families and non-instruct GPT models.
The plot uses a logarithmic scale for FLOPs. The focus is on avoidance (a; top left), incorrectness (i; bottom left) and ultracrepidarianism (i/(a + i); right)—the proportion of incorrect over both avoidant and incorrect answers. Source Data
Extended Data Fig. 1
Extended Data Fig. 1. Performance of GPT models over difficulty.
The values are split by correct, avoidant and incorrect results. Details as in Fig. 2.
Extended Data Fig. 2
Extended Data Fig. 2. Performance of LLaMA models over difficulty.
The values are split by correct, avoidant and incorrect results. Details as in Fig. 2.
Extended Data Fig. 3
Extended Data Fig. 3. Prompting stability of GPT models over difficulty.
Proportion of correctness and avoidance represented as (grey) curves over difficulty for the 15 prompt templates for the GPT models addressing each of the five benchmarks. The green and bronze curves correspond to the prompt template that has, respectively, the highest and lowest average correctness, avoidance, or incorrectness. The two small numbers in green and bronze in the plot identify them (corresponding to the template codes in Supplementary Tables 1 and 2). The plots for all the models and all response categories are in section 9 of the Supplementary Information. The same plot for the BLOOM family is in section 11 of the Supplementary Information.
Extended Data Fig. 4
Extended Data Fig. 4. Prompting stability of LLaMA models over difficulty.
Proportion of correctness and avoidance represented as (grey) curves over difficulty for the 15 prompt templates for the LLaMA models addressing each of the five benchmarks. Details as in Extended Data Fig. 3. The plots for all the models and all response categories are in section 9 of the Supplementary Information. The same plot for the BLOOM family is in section 11 of the Supplementary Information.

References

    1. Kaplan, J. et al. Scaling laws for neural language. Preprint at https://arxiv.org/abs/2001.08361 (2020).
    1. Markov, T. et al. A holistic approach to undesired content detection in the real world. In Proc. AAAI Conference on Artificial Intelligence 15009–15018 (PKP Publishing Services, 2023).
    1. OpenAI. GPT-4 technical report. Preprint at https://arxiv.org/abs/2303.08774 (2023).
    1. Chung, H. W. et al. Scaling instruction-finetuned language models. J. Mach. Learn. Res.25, 1–53 (2024).
    1. Ouyang, L. et al. Training language models to follow instructions with human feedback. Adv. Neural Inf. Process. Syst.35, 27730–27744 (2022).

LinkOut - more resources