. 2024 Nov;635(8037):229-236.
doi: 10.1038/s41586-024-07979-9. Epub 2024 Sep 25.

Structural basis of archaeal FttA-dependent transcription termination

Affiliations

Structural basis of archaeal FttA-dependent transcription termination

Linlin You et al. Nature. 2024 Nov.

Abstract

The ribonuclease FttA (also known as aCPSF and aCPSF1) mediates factor-dependent transcription termination in archaea1-3. Here we report the structure of a Thermococcus kodakarensis transcription pre-termination complex comprising FttA, Spt4, Spt5 and a transcription elongation complex (TEC). The structure shows that FttA interacts with the TEC in a manner that enables RNA to proceed directly from the TEC RNA-exit channel to the FttA catalytic centre and that enables endonucleolytic cleavage of RNA by FttA, followed by 5'→3' exonucleolytic cleavage of RNA by FttA and concomitant 5'→3' translocation of FttA on RNA, to apply mechanical force to the TEC and trigger termination. The structure further reveals that Spt5 bridges FttA and the TEC, explaining how Spt5 stimulates FttA-dependent termination. The results reveal functional analogy between bacterial and archaeal factor-dependent termination, functional homology between archaeal and eukaryotic factor-dependent termination, and fundamental mechanistic similarities in factor-dependent termination in bacteria, archaea, and eukaryotes.


Figures

Extended Data Fig. 1 ∣
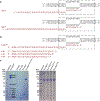
Extended Data Fig. 1 ∣. Nucleic acids and proteins.
a, Nucleic-acid scaffolds for structural studies: TEC and TEC. Black, DNA; brick red, RNA; dashed rectangle, TEC. b, Nucleic-acid scaffold and RNA markers for biochemical studies: F-TEC, F-RNA, F-RNA, and F-RNA. F, fluorescein. Other features as in a. c, Proteins for structural and biochemical studies (Coomassie-stained PAGE). The analysis was performed twice, with consistent results obtained.
Extended Data Fig. 2 ∣
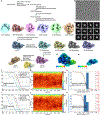
Extended Data Fig. 2 ∣. Structure determination: Tko FttA(H255A/H591A)–Spt4–Spt5–TEC.
a, Data processing scheme (Extended Data Table 1). b, Representative electron microphotograph. c, 2D class averages. d,e, EM density map coloured by local resolution for global map (map 1a) and locally refined map for FttA, RNAP stalk, and Spt5 KOW (map 1b). fh, Fourier-shell correlation (FSC) plot, orientation distribution plot, and 3D FSC plot for map 1a. ik, Fourier-shell correlation (FSC) plot, orientation distribution plot, and 3D FSC plot for map 1b.
Extended Data Fig. 3 ∣
Extended Data Fig. 3 ∣. Structure: Tko FttA(H255A/H591A)–Spt4–Spt5–TEC.
aj, Representative EM density (isocontours) and fits (Cα traces for backbones; sticks for sidechains) for FttAprox, FttAdist, RNAP stalk (RpoE and RpoF), Spt5, RNA interacting with FttAprox, RNA interacting with FttAdist, interface between FttAprox and RNAP RpoA’ and RpoB, interface between FttAprox and RNAP stalk (RpoE and RpoF), interface between FttAprox and Spt5, and interface between FttAdist and Spt5. Colours as in Fig. 2.
Extended Data Fig. 4 ∣
Extended Data Fig. 4 ∣. Structure determination: Tko FttA(H255A/H591A)–Spt4–Spt5–TEC.
a, Data processing scheme (Extended Data Table 1). b, Representative electron microphotograph. c, 2D class averages. d,e, EM density map coloured by local resolution for global map (map 2a) and locally refined map for FttA, RNAP stalk, and Spt5 KOW (map 2b). fh, Fourier-shell correlation (FSC) plot, orientation distribution plot, and 3D FSC plot for map 2a. ik, Fourier-shell correlation (FSC) plot, orientation distribution plot, and 3D FSC plot for map 2b.
Extended Data Fig. 5 ∣
Extended Data Fig. 5 ∣. Structure: Tko FttA(H255A/H591A)–Spt4–Spt5–TEC.
aj, Representative EM density (isocontours) and fits (Cα traces for backbones; sticks for sidechains) for FttAprox, FttAdist, RNAP stalk (RpoE and RpoF), Spt5, RNA interacting with FttAprox, RNA interacting with FttAdist, interface between FttAprox and RNAP RpoA’ and RpoB, interface between FttAprox and RNAP stalk (RpoE and RpoF), interface between FttAprox and Spt5, and interface between FttAdist and Spt5. Colours as in Fig. 2.
Extended Data Fig. 6 ∣
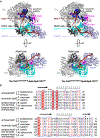
Extended Data Fig. 6 ∣. Structure: Tko FttA(H255A/H591A)–Spt4–Spt5–TEC and Tko FttA(H255A/H591A)–Spt4–Spt5–TEC.
a, Comparison of structures Tko FttA(H255A/H591A)–Spt4–Spt5–TEC (left) and Tko FttA(H255A/H591A)–Spt4–Spt5–TEC (right). Colours as in Fig. 2. b, Sequence alignment of regions of archaeal Spt5 that contact nontemplate-strand DNA in Tko FttA(H255A/H591A)–Spt4–Spt5–TEC and Tko FttA(H255A/H591A)–Spt4–Spt5–TEC to corresponding regions of yeast and human Spt5, Bacillus subtilis and Mycobacterium tuberculosis NusG (which have “pro-pausing” activity and which make corresponding protein-DNA interactions,), and E. coli NusG (which has “anti-pausing” activity and which does not make corresponding protein-DNA interactions). Arrows, β-strands; helices, α-helices; red dots, residues that contact nontemplate-strand DNA in Tko FttA(H255A/H591A)–Spt4–Spt5–TEC and Tko FttA(H255A/H591A)–Spt4–Spt5–TEC. Boxes denote conserved sequence positions. Colours denote levels of sequence conservation (red fill with white letters, high conservation; red letters, moderate conservation).
Extended Data Fig. 7 ∣
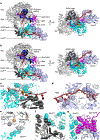
Extended Data Fig. 7 ∣. Protein-RNA interactions by FttA and dimerization interface of FttA in Tko FttA(H255A/H591A)–Spt4–Spt5–TEC and Tko FttA(H255A/H591A)–Spt4–Spt5–TEC.
af, Details of protein-RNA interactions by FttAprox, RNAP stalk, and FttAdist in Tko FttA(H255A/H591A)–Spt4–Spt5–TEC (panels ac) and Tko FttA(H255A/H591A)–Spt4–Spt5–TEC (panels df). Colours as in Fig. 2. g,h, Interface between FttAprox and FttAdist in Tko FttA(H255A/H591A)–Spt4–Spt5–TEC (panel g) and Tko FttA(H255A/H591A)–Spt4–Spt5–TEC (panel h). Colours as in Fig. 2.
Extended Data Fig. 8 ∣
Extended Data Fig. 8 ∣. Protein-protein interactions by FttA: effects of alanine substitution of FttA residues that contact RNAP or Spt5 in Tko FttA(H255A/H591A)–Spt4–Spt5–TEC and Tko FttA(H255A/H591A)–Spt4–Spt5–TEC52.
a, Effects of alanine substitution on FttA-dependent transcription termination and RNA cleavage, assessed in release assays with bead-immobilized promoter-generated TECs containing 32P-5’-end-labelled RNA, detecting retained or released RNA by storage-phosphor scanning (methods as in ref. and Fig. 1b). P, pellet fraction; S, supernatant fraction. Top, gel image. Bottom, normalized efficiencies of FttA-dependent RNA cleavage [((RNA-cleavage efficiency)/(RNA-cleavage efficiency with wild-type FttA))100%]. Assays were performed twice, with consistent results obtained. For gel source data, see Supplementary Fig. 1. b, Effects of alanine substitution on FttA-dependent RNA cleavage, assessed in assays with TECs assembled on synthetic nucleic-acid scaffolds containing 44 nt fluorescein-5’-end-labelled nascent RNA, detecting intact and cleaved RNA by x/y fluorescence scanning (methods as in Fig. 1c). Top, gel image. Bottom, normalized efficiencies of FttA-dependent RNA cleavage [((RNA-cleavage efficiency)/(RNA-cleavage efficiency with wild-type FttA))100%]. Assays were performed twice, with consistent results obtained. For gel source data, see Supplementary Fig. 1.
Extended Data Fig. 9 ∣
Extended Data Fig. 9 ∣. Structural relationship between archaeal FttA-dependent pre-termination complex and eukaryotic XRN2-dependent termination complex.
Comparison of archaeal FttA-dependent pre-termination complex (left; Fig. 2) and yeast XRN2 (Rat1)-dependent termination complex (right; PDB 8JCH). In left panel, FttAprox KH1-KH2 domains and FttAdist are omitted for clarity. In right panel, Rai1 is omitted for clarity. Rat1, cyan. Other colours as in Fig. 2.
Fig. 1 ∣
Fig. 1 ∣. The transcription termination factor FttA and transcription elongation factor NusG/Spt5.
a, FttA-dependent transcription termination, assessed using release assays with bead-immobilized promoter-generated TECs, detecting retained and released RNAP RpoA′ and RpoB subunits by Coomassie staining. P, pellet fraction; S, supernatant fraction; Spt4/5, Spt4–Spt5 complex. Assays were performed twice, with consistent results. b, FttA-dependent transcription termination and RNA cleavage, assessed using release assays with bead-immobilized promoter-generated TECs containing 32P-5′-end-labelled RNA, detecting retained and released RNA by storage-phosphor scanning (methods as in ref. 1). Assays were performed twice, with consistent results. c, Single-nucleotide-resolution mapping of FttA-dependent RNA cleavage, assessed using TECs assembled on synthetic nucleic acid scaffolds containing 44-nt fluorescein-5′-end-labelled nascent RNA, detecting intact and cleaved RNA by x/y fluorescence scanning and sizing cleavage products by comparison to fluorescein-5′-end-labelled synthetic RNAs corresponding to 22-, 24-, and 26-nt cleavage products (scaffold and marker sequences in Extended Data Fig. 1b). Assays were performed twice, with consistent results. d, Domain architectures of archaeal FttA, eukaryotic CPSF73, and eukaryotic INTS11-,,. Residue numbers for domains of Tko FttA are as follows: KH1, 6–75; KH2, 76–144; MβLa, 198–428; βCASP, 433–557; MβLb, 576–639. CTD, C-terminal domain. e, Domain architectures of bacterial NusG, archaeal Spt5, and eukaryotic Spt5-. KOW1–KOW5 are present in all eukaryotes; KOW6–KOW7 are present only in plants and metazoans. CTR, C-terminal region.
Fig. 2 ∣
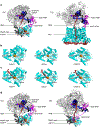
Fig. 2 ∣. Structure of the FttA pre-termination complex (Tko FttA(H255A/H591A)–Spt4–Spt5–TEC).
a, Cryo-EM structure. Left, view with the TEC RNA-exit channel aligned with the y axis, showing passage of RNA through the TEC RNA-exit channel and across FttAprox and FttAdist. Right, orthogonal view showing the inferred RNA path across FttAprox and FttAdist. FttAprox, cyan, with the nucleolytic active-centre Zn2+ ion (I) as orange sphere and position of nucleolytic active-centre catalytic Zn2+ ion (II) (absent due to H255A/H591A substitution in the FttA derivative used for structure determination; position based on superimposition of PDB 3AF55) as yellow sphere; FttAdist, lavender; Spt4, pink; Spt5, magenta; RNAP TEC, grey; RNAP stalk, dark grey; nontemplate-strand DNA, black; template-strand DNA, blue; RNA, brick red. dsDNA, double-stranded DNA. b, Cryo-EM structure with inferred full path of RNA through TEC RNA-exit channel, FttAprox, and FttAdist. RNA segment in central and distal parts of TEC RNA-exit channel, modelled by superimposition and interpolation, is shown in pink. c, Protein–RNA interactions of FttAprox and RNAP stalk (RpoE). d, Protein–RNA interactions of FttAdist. e, Protein–protein interactions of FttAprox with RNAP zinc-binding domain 1 (RpoA′ ZBD1) and RNAP zinc-binding domain 3 (RpoB ZBD3). f, Protein–protein interactions of FttAprox with RNAP stalk (RpoE and RpoF). g, Protein–protein interactions of FttAprox and FttAdist with Spt5 KOW.
Fig. 3 ∣
Fig. 3 ∣. Structural analogy of factor-dependent pre-termination complexes in bacteria and archaea, and structural homology of factor-dependent pre-termination complexes in archaea and eukaryotes.
a, Comparison of archaeal FttA-dependent pre-termination complex (left; Fig. 2) and bacterial Rho-dependent pre-termination complex (right; PDB 8E6W and PDB 8E6X). In the left panel, FttAprox KH1 and KH2 domains and FttAdist are omitted for clarity. Rho, cyan; NusG, magenta. Other colours as in Fig. 2b. b, Comparison of MβL and β-CASP domains of archaeal FttAprox (Fig. 2), eukaryotic INTS11 (PDB 7YCX), and eukaryotic CPSF73 (PDB 6V4X). MβL and β-CASP, cyan; nucleolytic active-centre Zn2+ ions, orange and yellow spheres. c, Comparison of RNA-bound MβL and β-CASP domains of FttAprox (Fig. 2), INTS11 (PDB 7YCX), and CPSF73 (PDB 6V4X). RNA segment 3′ to nucleolytic active centre, red. Other colours as in b. d, Comparison of archaeal FttA-dependent pre-termination complex (left; Fig. 2) and eukaryotic INT-dependent pre-termination complex (right; PDB 7YCX). In the left panel, FttAprox KH1 and KH2 domains and FttAdist are omitted for clarity. In the right panel, INT and PPA2 subunits other than INTS11, INTS11 CTD, RPB1 CTD, NELF, Spt4 and Spt5 KOW domains other than the N-terminal domain and KOW4 are omitted for clarity. INTS11, cyan; connector between Spt5 NGN and Spt5 KOW4, dashed magenta line. Other colours as in Fig. 2.
Fig. 4 ∣
Fig. 4 ∣. Mechanisms of bacterial, archaeal, and eukaryotic factor-dependent termination.
a, Bacterial Rho-dependent termination. b, Archaeal FttA-dependent termination (Figs. 2 and 3). c, Eukaryotic INT-dependent termination (INTS11 as FttA homologue) and CPSF-dependent termination (CPSF73 as FttA homologue)-,-. The top right pathway is thought to predominate for INT-dependent termination,; the bottom right pathway is thought to predominate for CPSF-dependent termination-,-. Bold text shows the complexes formed by the indicated reactions.

Update of

References

    1. Sanders T. et al. FttA is a CPSF73 homologue that terminates transcription in Archaea. Nat. Microbiol 5, 545–553 (2020). - PMC - PubMed
    1. Yue L. et al. The conserved ribonuclease aCPSF1 triggers genome-wide transcription termination of Archaea via a 3′-end cleavage mode. Nucleic Acids Res. 48, 9589–9605 (2020). - PMC - PubMed
    1. Li J. et al. aCPSF1 cooperates with terminator U-tract to dictate archaeal transcription termination efficacy. eLife 10, e70464 (2021). - PMC - PubMed
    1. Phung D. et al. Archaeal β-CASP ribonucleases of the aCPSF1 family are orthologs of the eukaryal CPSF-73 factor. Nucleic Acids Res. 41, 1091–1103 (2013). - PMC - PubMed
    1. Nishida Y. et al. Crystal structure of an archaeal cleavage and polyadenylation specificity factor subunit from Pyrococcus horikoshii. Proteins 78, 2395–2398 (2010). - PubMed

MeSH terms

LinkOut - more resources