. 2024 Dec;8(12):1665-1681.
doi: 10.1038/s41551-024-01255-x. Epub 2024 Sep 25.

Engineered allogeneic T cells decoupling T-cell-receptor and CD3 signalling enhance the antitumour activity of bispecific antibodies

Affiliations

Engineered allogeneic T cells decoupling T-cell-receptor and CD3 signalling enhance the antitumour activity of bispecific antibodies

Edo Kapetanovic et al. Nat Biomed Eng. 2024 Dec.

Abstract

Bispecific antibodies (biAbs) used in cancer immunotherapies rely on functional autologous T cells, which are often damaged and depleted in patients with haematological malignancies and in other immunocompromised patients. The adoptive transfer of allogeneic T cells from healthy donors can enhance the efficacy of biAbs, but donor T cells binding to host-cell antigens cause an unwanted alloreactive response. Here we show that allogeneic T cells engineered with a T-cell receptor that does not convert antigen binding into cluster of differentiation 3 (CD3) signalling decouples antigen-mediated T-cell activation from T-cell cytotoxicity while preserving the surface expression of the T-cell-receptor-CD3 signalling complex as well as biAb-mediated CD3 signalling and T-cell activation. In mice with CD19+ tumour xenografts, treatment with the engineered human cells in combination with blinatumomab (a clinically approved biAb) led to the recognition and clearance of tumour cells in the absence of detectable alloreactivity. Our findings support the development of immunotherapies combining biAbs and 'off-the-shelf' allogeneic T cells.


Conflict of interest statement

Competing interests: E.K., S.T.R., C.R.W. and R.V.-L. are co -inventors on the patent ‘Universal TCR variants for allogeneic immunotherapy’ filed by ETH Zurich related to AED TCRs and methods of their use. The other authors declare no competing interests.

Figures

Fig. 1
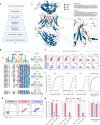
Fig. 1. Mutations in the aCPM of TCRs abrogate TCR–antigen binding and CD3 signalling.
a, The TCR–CD3 complex is a functionally dependent octamer; genomic knockout (KO) of any of the components disrupts a complete assembly in the endoplasmic reticulum and Golgi apparatus. Individual chains and incomplete TCR complexes are retained or degraded in the endoplasmic reticulum, and the result is loss of surface expression of the entire complex; for example, CRISPR–Cas9 KO of the TCR alpha chain constant region (TRAC) leads to a functional KO of CD3 molecules. b, The aCPM has been identified as a key motif for TCR–antigen (pMHC) binding and CD3 signal transduction in mouse T cells. The motif is spanning the junction of exons 2 and 3 of the TRAC locus, and its residues (FETDxNLN) are highly conserved across mammalian species. Two Jurkat cell lines expressing TCR variants with mutations in aCPM (Jkt-DMF5FATADALN and Jkt-DMF5GGGSGSG) are shown. c, Schematic representation of the co-culture assays. APCs (T2) are pulsed with a different concentration of peptide (ELA) and cultured overnight with Jkt-DMF5 cells in a 1:2 ratio; Raji cells express CD19 antigen and are cultured with blinatumomab and Jkt-DMF5 overnight in 1:2 ratio. d, Left panel: overnight co-cultures with the T2 cells pulsed with MART-1 peptide antigen (ELA). Right panel: Jkt-T-cell NFAT-GFP dose response to blinatumomab (ng ml−1) in co-culture with Raji (CD19+) tumor cells. Data are normalized to the WT Jkt-DMF5. e, A comparison of the highest responses of all TCR variants to a peptide (left) and blinatumomab (right) with statistical analysis. f, Representative flow cytometry plots of T-cell binding to MART-1 dextramer and CD3 expression in Jkt-DMF5FATADALN and Jkt-DMF5GGGSGSG variants. g, Assembly of the extracellular domains of the TCR/CD3 complex is mediated by the connecting peptides of the TCR αβ chains and their molecular interactions with CD3γε and CD3εδ. Multiple bonds between TCR-α cPM residues (F236-N243) and CD3 molecules are displayed (PDB, 6JXR). In d and e, the experiment was performed three times. Asterisks indicate statistical significance between Jkt-DMF5 variants and WT Jkt-DMF5 TCR as determined by one-way ANOVA with Tukey’s post hoc test for multiple comparisons. Data are displayed as mean ± s.d. *P < 0.05; **P < 0.01; ***P < 0.001; ****P < 0.0001; NS, not significant. Significant P > 0.001 are numerically written. Panels ac were created with BioRender.com. Source data
Fig. 2
Fig. 2. TCR sequence analysis and functional decoupling of TCR–antigen binding from CD3 signalling.
a, Key criteria defined for identifying motifs to enable decoupling of TCR–antigen binding from CD3 signalling. b, Multiple sequence alignment of TRAJ germlines from humans (left) and selected mammals (right) shows a highly conserved motif (FGxGT). c, DMF5 TCR (PDB, 3QDJ) structure is represented with alpha-beta chain spatial conformation and colour-coded CDRs (yellow, CDR1; green, CDR2; magenta, CDR3). The magnified square depicts inter-chain molecular contacts between the α-chain FGxGT motif and β-chain residues in proximity. A complete amino acid sequence of the DMF5 TCR chains with highlighted CDRs is located in the top right corner. d, Representative flow plots of MART-1-HLA A2 dextramer binding. e, Representative flow cytometry plots of NFAT-GFP and CD3 expression in Jkt-DMF5 (red) and Jkt-AEDDMF5 01 cells (blue). T cells were co-cultured overnight with peptide-pulsed T2 cells (ELA). In grey, Jkt-CD3- cell-line basal activation and in culture with the highest concentration of ELA peptide (10 µg ml−1). f, Three leftmost panels: NFAT-GFP response curves for Jkt-DMF5 and Jkt-AEDDMF5 01 cells to three known cognate peptide antigens (ELA, AAG, EAA). Rightmost panel: CD3 activation curves with blinatumomab. Data are normalized to the Jkt-DMF5. g, Three leftmost panels: bar plots of the two highest peptide concentrations 4log10(nM) (10 µg ml−1) and 3log10(nM) (1 µg ml−1) measured for Jkt-DMF5 and Jkt-AEDDMf5 01 and their statistical analysis. Rightmost panel: two selected highest concentrations for blinatumomab. In f and g, the experiment was performed three times. Data are displayed as mean ± s.d. P values were determined using a two-tailed, unpaired Student’s t-test. *P < 0.05; **P < 0.01; ***P < 0.001; ****P < 0.0001; NS, not significant. Significant P > 0.001 are numerically written. Source data
Fig. 3
Fig. 3. AED T-cell discovery with library mutagenesis and functional screening.
a, Three TCRs with specificity to tumour-associated antigens and their HLA restriction, TCRa V-gene germline (TRAV) and TRAJ usage, and FGxGT sequence motif. b, The DMF5 motif (FGQGT) was used for all the libraries. The glycine (G) residues were mutated with NNK mutagenic oligonucleotides yielding a library size of 400 variants for each TCR. First, T cells with maintained CD3 surface expression and pMHC binding were selected by FACS. Next, co-culture assays were performed with either T2 cells pulsed with cognate peptide (DMF5 and 1G4) or with EJM cells (a3a); NFAT-GFP+ CD3+ expressing variants were isolated by FACS. The same selection strategy was applied to cells co-cultured with CD19+ cells and blinatumomab. The fraction with a low response to the peptide (orange square, P2) was pursued in the next round of selection (three rounds total). Genomic DNA from each group was extracted and submitted for deep sequencing. ce, DMF5 TCR library (c), 1G4 TCR library (d) and a3a TCR library (e). Ranking of variants was followed through DEX/CD3+, PEP+ and BLINA+ populations. Selected variants were primarily selected on their improved ranking in the BLINA+ versus PEP+ population. Selected variants were introduced into Jurkat T cells and individually tested for peptide and blinatumomab response (12 ng ml−1). In d and e, the experiment was performed once with technical replicates. Data were normalized to the highest GFP signal for each TCR group and are displayed as the mean ± s.d. P values were determined using a one-way ANOVA with Tukey’s correction for multiple comparisons. *P < 0.05; **P < 0.01; ***P < 0.001; ****P < 0.0001; NS, not significant. Significant P > 0.001 are numerically written. Panels a and b were created with BioRender.com. Source data
Fig. 4
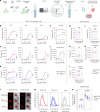
Fig. 4. In vitro functional assays of primary human AED T cells.
a, Primary human T cells (AEDDMF5 01 and WTDMF5) were transfected with the dsDNA/CRISPR–Cas9 and isolated by FACS based on binding to MART-1 dextramer (DEX+) and CD3 expression (CD3+). Sorted T cells were co-cultured with T2 cells pulsed with a range of cognate peptides (ELA, AAG, EAA) at a 1:10 ratio (T to T2 cells). b, The proliferation curves for AEDDMF5 01 and WTDMF5 are plotted for each MART-1 peptide and three different HLA donors. c,d,f, Co-culture supernatants were collected and values of IFN-γ (c), IL-2 (d) and Granzyme B (ELA) (f) were measured by ELISA, and dose–response curves are displayed. e, Degranulation was measured by CD107a staining upon incubating T cells for 4 h with ELA peptide-pulsed T2 cells (1:1 cell ratio). In bf, symbols are means of three biological replicates. Error bars, s.d. gi,k, T-cell proliferation (g), IFN-γ (h), IL-2 (i) and Granzyme B secretion (k) are shown for WT donor T cells, WTDMF5 and AED DMF5 01 T cells following co-culture with CD19+ tumour cells (Raji) and blinatumomab. j, Degranulation was measured by CD107a staining upon incubating T cells for 4 h with blinatumomab (12 ng ml−1) and Raji cells (1:1 cell ratio). In gk, symbols are means of three biological replicates. Error bars, s.d. l, Raji cells were labelled with a red fluorescent dye and were added to the wells containing T cells at a 1:5 ratio. Microscopy images depict the Raji cell cluster size difference between +blinatumomab and −blinatumomab samples, and a formation of T-cell rings is observed around Raji cells when blinatumomab is added. m, The radial intensity difference shows T-cell activation around Raji clusters with (solid line, dark) and without (dashed line, light) blinatumomab (n = 12); s.d. (shaded area) n, The intensity difference between Raji cells and T cells is shown for donor, DMF5 and AEDDMF5 01 cultured with and without blinatumomab. In the box plot, the line represents the median and whiskers minimum and maximum values measured. Dots represent 12 clusters measured across three technical replicates (one donor). P values were determined with one-way ANOVA with Tukey’s correction for multiple comparisons. *P < 0.05; **P < 0.01; ***P < 0.001; ****P < 0.0001; NS, not significant. Significant P > 0.001 are numerically written. Panel a was created with Biorender.com. Source data
Fig. 5
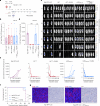
Fig. 5. AED T cells with blinatumomab drive potent antitumour response and do not show alloreactivity.
a, Schematic of the human tumour xenograft mouse model. All cell injections were performed subcutaneously with a 1:15 Raji to T-cell mix. WT T cells were a 1:1 mix of two donors (UDN001 and UDN002). Blinatumomab (0.1 µg) was administered intravenously once a day for five consecutive days. Mice were killed on day 42 when the control group (Raji only) reached the highest allowed level of LUC (5 × 109 photons per s). NSG, nod-scid-gamma. b, Bioluminescence activity in each mouse group was measured on day 0 by in vivo imaging system (IVIS) imaging. c, Tumour progression was followed with weekly IVIS imaging at specified time points. Four mice in each group with WT T cells were killed on day 28 to determine the complete loss of bioluminescence. d, Tumour bioluminescence was measured at the end of the experiment (day 42). Mice were killed at an earlier time point, and their values are also plotted. e, Tumour bioluminescence signals are measured at specified time points. Individual lines denote data obtained from each animal. In ae, the experiment was performed once with two donors. Symbols are means of three to five mice. Error bars, s.d. f, Kaplan–Meier curves show the overall survival of mice in the selected experimental groups. P values were determined using a two-sided log-rank test. g, Immunohistochemistry (CD19) and chromogenic staining (CD3) of representative mice in the mouse groups with tumour cell overgrowth. In d, P values were calculated using one-way ANOVA with Sidak’s correction for multiple comparisons. *P < 0.05; **P < 0.01; ***P < 0.001; ****P < 0.0001; NS, not significant. Significant P > 0.001 are numerically written. Panel a was created with Biorender.com. Source data

References

    1. Kantarjian, H. et al. Blinatumomab versus chemotherapy for advanced acute lymphoblastic leukemia. N. Engl. J. Med.376, 836–847 (2017). - PMC - PubMed
    1. Topp, M. S. et al. Phase II trial of the anti-CD19 bispecific T cell–engager blinatumomab shows hematologic and molecular remissions in patients with relapsed or refractory B-precursor acute lymphoblastic leukemia. J. Clin. Oncol.32, 4134–4140 (2014). - PubMed
    1. Hathaway, L., Sen, J. M. & Keng, M. Impact of blinatumomab on patient outcomes in relapsed/refractory acute lymphoblastic leukemia: evidence to date. Patient Relat. Outcome Meas.9, 329–337 (2018). - PMC - PubMed
    1. Jabbour, E. et al. Outcome of patients with relapsed/refractory acute lymphoblastic leukemia after blinatumomab failure: no change in the level of CD19 expression. Am. J. Hematol.93, 371–374 (2018). - PubMed
    1. Thommen, D. S. & Schumacher, T. N. T cell dysfunction in cancer. Cancer Cell33, 547–562 (2018). - PMC - PubMed

Publication types

MeSH terms

LinkOut - more resources