. 2024 Nov;25(11):4777-4802.
doi: 10.1038/s44319-024-00246-y. Epub 2024 Sep 25.

Kinesin-1 mediates proper ER folding of the CaV1.2 channel and maintains mouse glucose homeostasis

Affiliations

Kinesin-1 mediates proper ER folding of the CaV1.2 channel and maintains mouse glucose homeostasis

Yosuke Tanaka et al. EMBO Rep. 2024 Nov.

Abstract

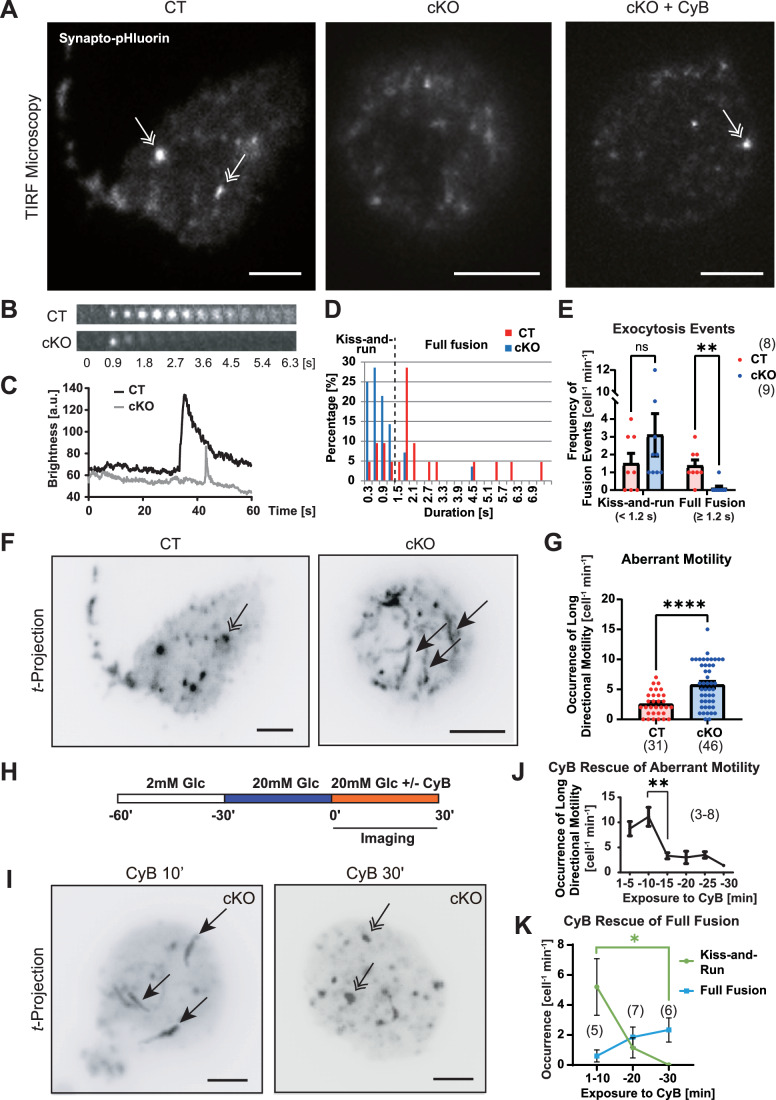
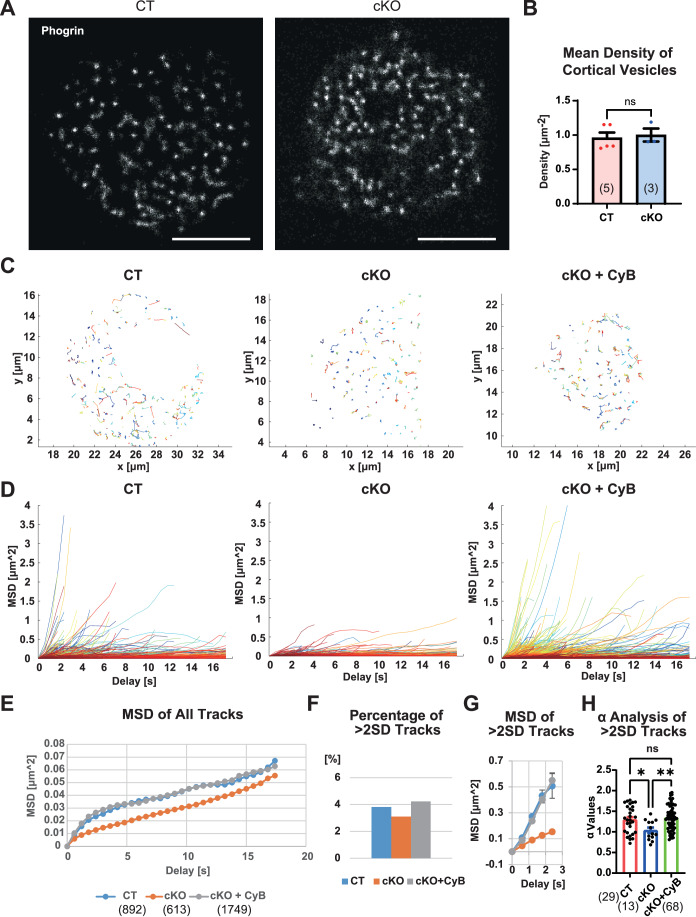
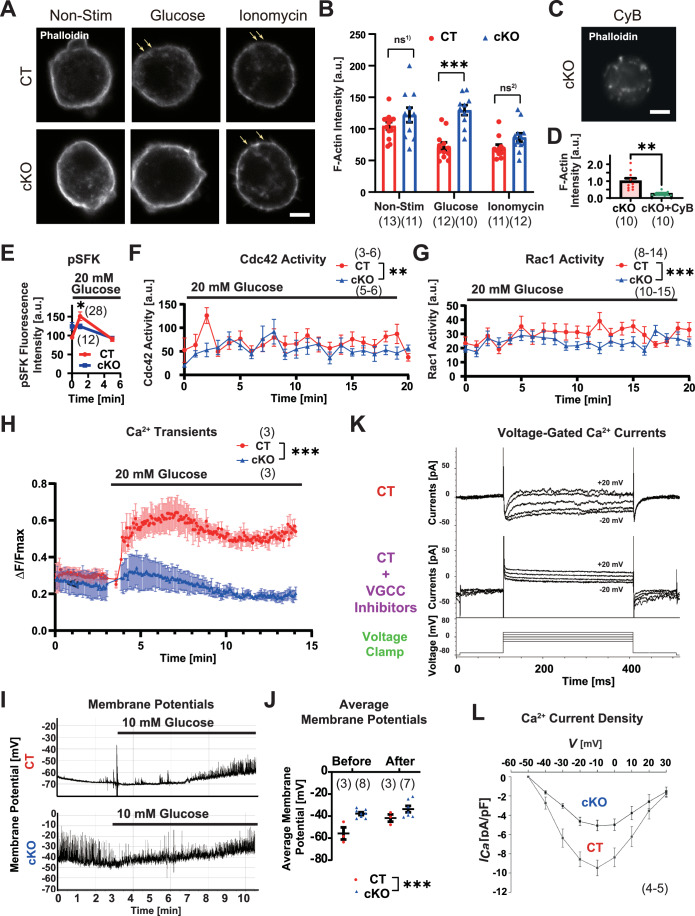
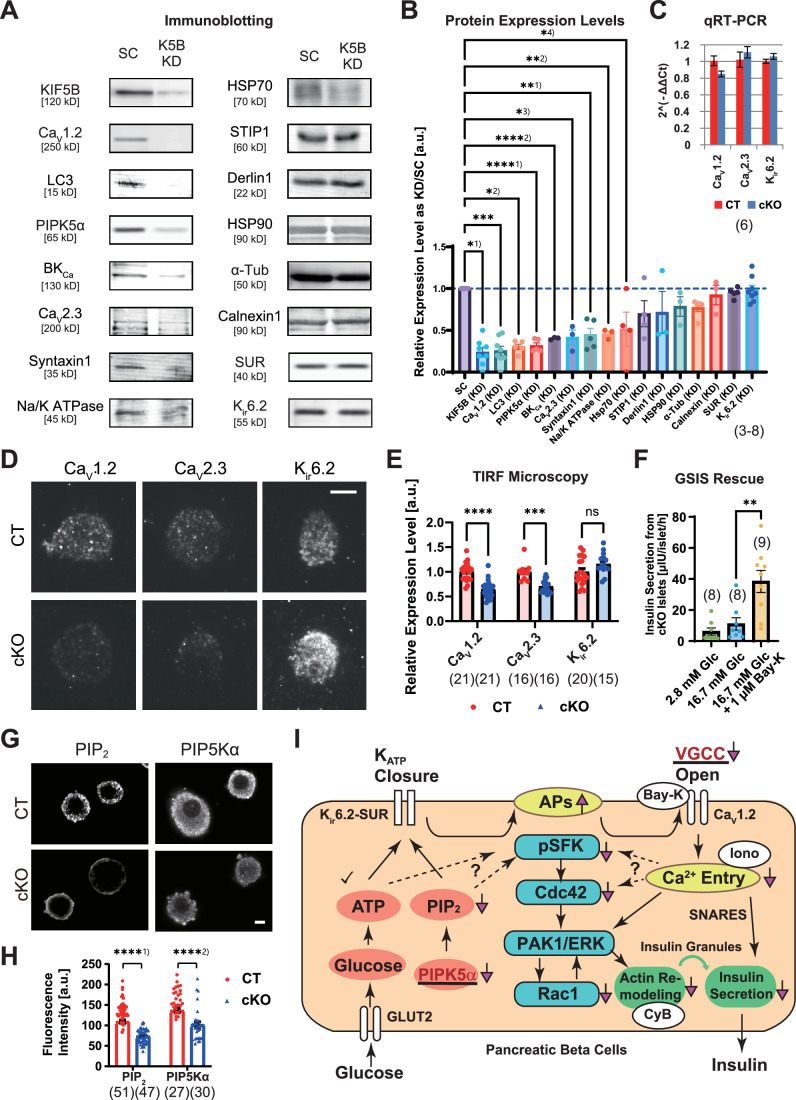
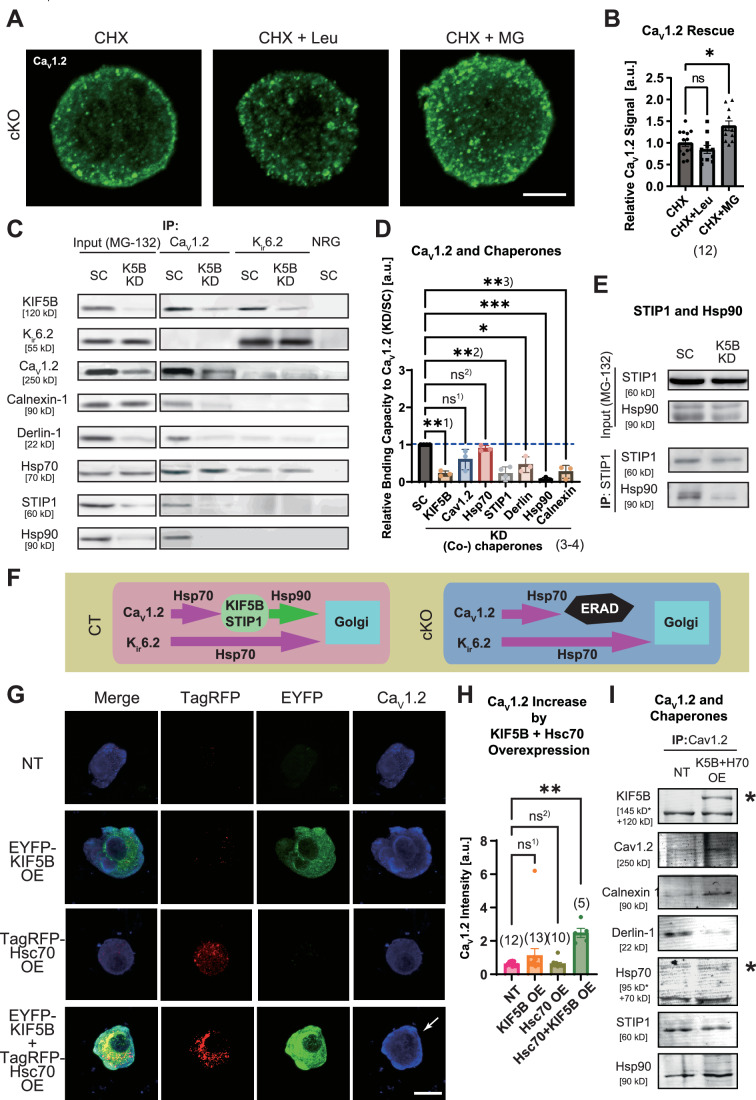
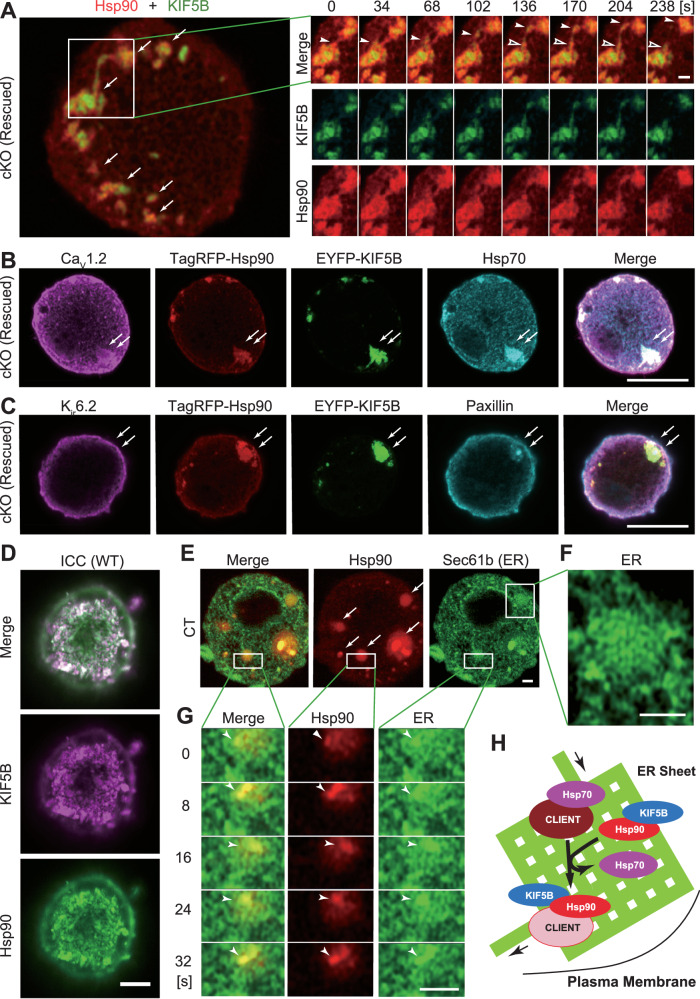
Glucose-stimulated insulin secretion (GSIS) from pancreatic beta cells is a principal mechanism for systemic glucose homeostasis, of which regulatory mechanisms are still unclear. Here we show that kinesin molecular motor KIF5B is essential for GSIS through maintaining the voltage-gated calcium channel CaV1.2 levels, by facilitating an Hsp70-to-Hsp90 chaperone exchange to pass through the quality control in the endoplasmic reticulum (ER). Phenotypic analyses of KIF5B conditional knockout (cKO) mouse beta cells revealed significant abolishment of glucose-stimulated calcium transients, which altered the behaviors of insulin granules via abnormally stabilized cortical F-actin. KIF5B and Hsp90 colocalize to microdroplets on ER sheets, where CaV1.2 but not Kir6.2 is accumulated. In the absence of KIF5B, CaV1.2 fails to be transferred from Hsp70 to Hsp90 via STIP1, and is likely degraded via the proteasomal pathway. KIF5B and Hsc70 overexpression increased CaV1.2 expression via enhancing its chaperone binding. Thus, ER sheets may serve as the place of KIF5B- and Hsp90-dependent chaperone exchange, which predominantly facilitates CaV1.2 production in beta cells and properly enterprises GSIS against diabetes.

Keywords: Calcium Channel; ER Sheets; Hsp90; Insulin Secretion; Kinesin.


Conflict of interest statement

The authors declare no competing interests.

Figures

Figure 1
Figure 1. KIF5B is essential for proper GSIS and blood glucose homeostasis.
(AC) Immunohistochemistry of Kif5bflox/flox Rip2-Cre●/● (CT) and Kif5bflox/flox Rip2-Cretg/● (cKO) mouse pancreas (A, B); against insulin (green in (A) and gray in (B)) and/or KIF5B (red in (A)); accompanied by the islet morphometry (C). Bars, 10 μm in (A) and 1 mm in (B). **P = 0.0014, two-sided unpaired Welch’s t test, n = 5 mice. Data are represented by the mean ± SEM. Arrows in (A), beta cells. Arrowheads in (A), non-beta cells. Arrows in (B), islets. Corresponding to Fig. EV1. (D) Intraperitoneal glucose tolerance test (IPGTT) of 4-month-old CT and cKO mice. ***1)P = 0.0023; ***2)P = 0.0045; one-sided unpaired Welch’s t test, n = 8 mice at each time point. Data are represented by the mean ± SEM. (E) ATP/ADP ratio measurements in the islets of the indicated genotypes stimulated for 3 min. ns, P = 0.5323, two-way ANOVA, n = 4–5 biological replicates. Data are represented by the mean ± SEM. (F, G) Perifusion assay of CT and cKO mouse pancreatic islets stimulated with 20 mM glucose for 40 min (F), quantified for the respective amounts of basal secretion (plotted in an inverted manner) and the first- (0–10 min) and second phase (10–44 min) of GSIS increments. ***1)P = 0.000060; ***2)P = 0.000008; ***3)P = 2.66 × 10-8; two-sided unpaired Welch’s t test, n = 12 biological replicates. Data are represented by the mean ± SEM.
Figure 2
Figure 2. KIF5B stabilizes insulin exocytosis through actin remodeling.
(A) Typical images of the surface of synapto.pHluorin-transduced primary beta cells on the indicated conditions in TIRF microscopy. Double arrows, full fusion. CyB, 10 µg/mL cytochalasin B treatment. Scale bars, 5 μm. Corresponding to Movie EV1. (B, C) Typical time-lapse images of synapto.pHluorin exocytosis on the cell surface of the indicated genotypes by time-lapse total internal reflection fluorescence (TIRF) microscopy (B) and their typical traces of fluorescence intensity (C), recorded at 30–60 min after glucose stimulation. (D) Histogram of the duration of each exocytosis event at 30–60 min of glucose stimulation. (E) Quantification of the occurrence of full-fusion events (defined to be longer than 1.2 s in (D)) and kiss-and-run events (shorter than 1.2 s) in each genotype. Note that KIF5B deficiency significantly reduced the occurrence of full-fusion exocytosis. ns, P = 0.2480; **P = 0.0054, two-sided unpaired Welch’s t test, n = 8–9 cells. Data are represented by the mean ± SEM. (F, G) Temporal projection of the time-lapse images of CT and cKO primary beta cells (F) and its quantification for the occurrence of long directional motility (G). Scale bars, 5 μm. ****P = 5.46 × 10−6, two-sided unpaired Welch’s t test, n = 31–46 cells. Double arrow, full fusion; single arrows, cortical long-range directional motilities. (HK) Time course of the pharmacological rescue of insulin granule dynamics of cKO cells by CyB treatment, represented by an experimental design (H); temporal projection of time-lapse images (I); time course of the occurrence of peripheral directional motility after CyB treatment (J), and time course of the occurrence of indicated types of exocytosis after CyB treatment (K). Scale bars, 5 μm. *P = 0.0323; **P = 0.0020; one-sided unpaired Welch’s t test (J) and Dunn’s multiple comparisons test following a Kruskal–Walls test (K), n = 5–7 cells (J, K). Data are represented by the mean ± SEM. Double arrow, full fusion; single arrows, cortical long-range directional motilities.
Figure 3
Figure 3. KIF5B facilitates short directional motility of insulin granules.
(A, B) Images of cortical insulin granules of control (CT) and cKO primary beta cells, transfected with a phogrin-Dronpa-Green1 expression vector, starved, and stimulated by 20 mM glucose for 30 min (A), accompanied by quantification of cortical insulin granules (B). Bar, 2 µm. ns, P = 0.7508, n = 3–5 cells, two-sided unpaired Welch’s t test. Data are represented by the mean ± SEM. (CH) Quantification of insulin granule motility tagged by phogrin-EGFP with a 5LIVE-Duo confocal microscope, in primary beta cells of the indicated genotypes and treatments for 100 s, at 30 min after glucose stimulation; represented by particle tracks (C), MSD trajectories (D), MSD curves of all tracks (E), percentage of >2 SD tracks (F), MSD curves of >2 SD tracks (G), and α analysis of >2 SD tracks for directional movements (H); corresponding to Movie EV2. Color coding in (C, D), the time sequence. ns, P = 0.7468; *P = 0.0308; **P = 0.0030; one-way ANOVA with Tukey’s multiple comparison test, n = 13–68 tracks (G, H). Note that cKO beta-cell granules were significantly less motile than CT granules, which were significantly reversed by the CyB treatment. Data are represented by the mean ± SEM.
Figure 4
Figure 4. KIF5B is essential for Ca2+ transients and actin remodeling of beta cells.
(AD) Actin remodeling assay using fluorescent phalloidin-labeled CT and cKO primary beta cells with the indicated treatments (A, C), accompanied by quantification (B, D). Scale bars, 5 μm. ns1), P = 0.2014; ns2), P = 0.0616; ***P = 0.000021; multiple unpaired Welch’s t test, n = 10–13 cells. Quantified at the positions of largest diameter. Arrows, the sites of cortical F-actin remodeling. Data are represented by the mean ± SEM. Corresponding to Fig. EV2A–D and Movie EV3. (EG) Glucose-stimulated activation of SFK (E), Cdc42 (F), and Rac1 (G) in primary beta cells of the indicated genotypes after 20 mM glucose stimulation from time 0, measured by immunofluorescence microscopy (E) and the respective FRET biosensors (F, G). *P = 0.0475; two-sided unpaired Welch’s t test, n = 28–42 cells (E); **P = 0.0047, ***P = 0.0001, two-way ANOVA, n = 3–14 cells (F, G). Data are represented by the mean ± SEM. (H) 20 mM glucose-stimulated calcium transients of the primary beta cells labeled with Fluo4-AM. ***P = 3.7 × 10−222, two-way ANOVA on periods after the stimulation, n = 3 cells. Data are represented by the mean ± SEM. (I, J) Membrane potentials of resting and 10 mM glucose-stimulated primary beta cells according to whole-cell patch-clamp recordings (I); and quantification of the mean membrane potentials before and after the glucose stimulation (J). ***P = 0.0007, two-way ANOVA, n = 3–8 cells. Data are represented by the mean ± SEM. (K) Traces of voltage-gated Ca2+ currents in patch-clamp recording of mouse primary beta cells of the indicated genotypes in 10 mM glucose, with or without the VGCC inhibitors cocktail, containing 20 μM nifedipine, 1 μM SNX482, and 0.3 mM ascorbate, at the range of −20 to +20 mV. Note that the inhibitor treatment significantly abolished the voltage-gated inward currents. (L) Ca2+ inward current density curves of the primary beta cells of the indicated genotypes measured by whole-cell patch clamp. n = 4–5 cells. Data are represented by the mean ± SEM.
Figure 5
Figure 5. KIF5B is essential for CaV1.2 protein expression in beta cells.
(A, B) Immunoblotting of a Kif5b gene silencing system in MIN6 cells using scrambled-control (SC) and KIF5B-knockdown (KD) miRNA, for the indicated proteins (A); and its normalized quantification against the SC-transduced cells (B). *1)P = 0.0178; *2)P = 0.0229; *3)P = 0.0108; *4)P = 0.0490; **1)P = 0.0076; **2)P = 0.0020; ***P = 0.006; ****1)P = 0.0002; ****2)P = 9.59 ×  10−5; one-sided unpaired Welch’s t test between KD and SC, n = 3–8 biological replicates. Data are represented by the mean ± SEM. (C) Quantitative RT–PCR results of the KD system among the indicated genes, n = 6. Data are represented by the mean ± SEM. (D, E) Immunofluorescence microscopy of primary beta cells of the indicated genotypes, against CaV1.2, CaV2.3, and Kir6.2, using TIRF microscopy (D), and its quantification (E). Bar, 5 μm. ns, P = 0.0597; ***P = 0.0002; ****P = 1.45 × 10−7; two-sided unpaired Welch’s t test, n = 11–21 cells. Data are represented by the mean ± SEM. (F) Rescue of impaired GSIS from cKO mouse islets by 1 μM Bay-K 8644. **P = 0.0019, one-way ANOVA, n = 8–9. Data are represented by the mean ± SEM. (G, H) Immunofluorescence microscopy of primary beta cells of the indicated genotypes, against PIP2 and PIP5Kα using a confocal laser scanning microscope (CLSM, G), and quantification (H). Bars, 5 μm. ****1)P = 1.154 × 10−12; ****2)p = 1.805 × 10⁻⁴; one-sided unpaired Welch’s t test, n = 27–51 cells. Data are represented by the mean ± SEM. (I) Schematic representation of possible changes in the stimulation-secretion coupling of GSIS in KIF5B cKO beta cells. Checkmark, normal expression. Red arrows, changes according to KIF5B deficiency. CaV1.2 and PIP5Kα protein downregulation (underlined) in KIF5B-deficient beta cells may primarily result in the abolishment of Ca2+ transients and downregulation of PIP2, respectively. White ovals, pharmacological reagents that directly stimulated the respective pathways: Bay-K Bay-K 8644, Iono ionomycin, CyB cytochalasin B.
Figure 6
Figure 6. KIF5B facilitates chaperone exchange for CaV1.2 protein expression.
(AC) Degradation assay in immunofluorescence against CaV1.2 (A) and CaV2.3 (B) of primary beta cells of the indicated genotypes after the CHX treatment for the indicated periods; accompanied by their quantification along with that of α-tubulin (C). Bars, 5 μm. *P = 0.02561, ***P = 0.00292; one-sided unpaired Welch’s t test at the indicated time points; n = 6 cells (CaV1.2), 17–24 cells (CaV2.3), 5–7 cells (α-tubulin). Data are represented by the mean ± SEM. (D, E) Brefeldin-A (BFA) washout assay with an LSM 5LIVE-Duo microscope, assessing the speeds of post-Golgi trafficking of CaV1.2-EGFP proteins expressed in primary beta cells of the indicated genotypes (D), accompanied by its quantification (E). Time after BFA washout is indicated. Bar, 5 μm. *P = 0.0207, one-sided unpaired Welch’s t test, n = 11 cells. Arrows, the timing of plasma membrane fusion. Data are represented by the mean ± SEM. Corresponding to Movie EV4. (F) TIRF/STORM microscopy of a wild-type primary mouse beta-cell immunolabeled against CaV1.2 and KIF5B. Scale bar, 5 μm. Arrows, colocalizing spots. (G) TIRF/STORM microscopy of primary mouse beta cells of the indicated genotypes immunolabeled against CaV1.2 (green) and CaV2.3 (magenta). Scale bars, 5 μm. (H) Schematic representation of STIP1-dependent Hsp70-to-Hsp90 chaperone exchange machinery. (I, J) Proximity ligation assay in CT and cKO primary beta cells with z-projection views, indicating protein binding signals between CaV1.2 and the indicated Hsp proteins (I); accompanied by quantification (J). Scale bar, 5 μm. **P = 0.0122; ***P = 8.42 × 10−5; one-sided unpaired Welch’s t test, n = 6 cells. Data are represented by the mean ± SEM. (K) Immunoblotting of scramble control (SC) and STIP1-knockdown (KD) MIN6 cells against the indicated epitopes. Note that STIP1 deficiency induced downregulation of CaV1.2 and BKCa proteins. Reproduced twice.
Figure 7
Figure 7. KIF5B–Hsp machinery that facilitates CaV1.2 expression.
(A, B) Rescue of CaV1.2 degradation in cKO primary beta cells in the presence of CHX by leupeptin (Leu) or MG-132 (MG) for 4 h. Scale bar, 5 μm. ns, P = 0.4331; *P = 0.0112; one-way ANOVA with Dunnett’s multiple comparison test, n = 12 cells. Data are represented by the mean ± SEM. (C, D) Vesicle IP of MG-132-treated MIN6 cell lysates transduced with scrambled-control (SC) and KIF5B-knockdown (KD) miRNAs, precipitated using CaV1.2 or Kir6.2 antibodies or normal rabbit IgG (NRG) and immunoblotted for the indicated proteins (C), accompanied by quantification of CaV1.2-coprecipitated fractions (D). ns1), P = 0.0634; ns2), P = 0.2434; *P = 0.0235; **1)P = 0.0014; **2)P = 0.0016; **1)P = 0.0092; ***P = 3.54 × 10−4; one-sided unpaired Welch’s t test between KD and SC, n = 3–4 biological replicates. Data are represented by the mean ± SEM. Note that the CaV1.2-binding capacities of derlin-1, calnexin-1, and Hsp90 chaperones and that of the adaptor protein STIP1 in KD cell lysates were significantly lower than those in SC cell lysates. (E) Vesicle IP of the MG-132-treated MIN6 cell lysates among the KIF5B-KD system against STIP1. Note that the Hsp90 level in the STIP1 immunoprecipitants (IP) was greatly decreased by KIF5B deficiency. Repeated twice. (F) Schematic representation of the working hypothesis on differential KIF5B- and heat-shock-protein (Hsp)-dependencies of opposing ER clients CaV1.2 and Kir6.2 in control (CT) and KIF5B conditional knockout (cKO) mouse beta cells. In cKO cells, CaV1.2 fails in chaperone exchange to undergo ERAD-mediated degradation, but Kir6.2 is intact because it is independent on the KIF5B–Hsp machinery. (G, H) CaV1.2 immunocytochemistry of MIN6 cells that had been transduced with EYFP-KIF5B and/or TagRFP-Hsc70 or without them (NT; G); accompanied by their quantification (H). Scale bar, 5 μm. ns1), P = 0.4266; ns2), P > 0.9999; **P = 0.0017; one-way ANOVA with Dunnett’s multiple comparison between KD and SC, n = 5–13 biological replicates. Data are represented by the mean ± SEM. Arrow in (G), enhanced CaV1.2 expression according to dual overexpression. (I) Vesicle IP of non-transduced (NT) and KIF5B- and Hsc70-overexpressing (K5 + H70 OE) MIN6 cell lysates against CaV1.2. Asterisks, tagged protein bands. The tagRFP-Hsc70 band was overlapped with a band of possibly ubiquitinated form. Reproduced twice.
Figure 8
Figure 8. KIF5B recruits Hsp90 onto ER sheets for proper CaV1.2 protein folding.
(A) Time-lapse imaging in the bottom of a rescued primary cKO beta-cell, expressing tagRFP-Hsp90 (red) and KIF5B-EYFP (green). Scale bar, 1 μm. Arrows, microdroplets. Note that two co-accumulated microdroplets appeared to exchange their components through a double-labeled dynamic tubule (open and closed arrowheads). Corresponding to Fig. EV2E and Movie EV5. (B, C) Immunofluorescence microscopy in the bottom of primary cKO beta cells expressing tagRFP-Hsp90 (red) and KIF5B-EYFP (green), against CaV1.2 and Hsp70 (B) and against Kir6.2 and Paxillin (C). Scale bars, 10 μm. Arrows, co-accumulated microdroplets. Reproduced 5–10 times. (D) Immunocytochemistry of a wild-type islet cell against KIF5B (magenta) and Hsp90 (green) using Airyscan microscopy. Scale bar, 5 μm. Reproduced twice. (EG) Live fluorescence microscopy of the bottom of CT primary beta cells expressing tagRFP-Hsp90 (red) and the ER marker mEmerald-Sec61β (green) using Airyscan microscopy with low (E) and high (F, G) magnifications and in a time sequence (G). Scale bars, 1 μm. Arrows, microdroplets. Arrowheads, a portion of the ER sheet accompanied by Hsp90 microdroplets. Corresponding to Movie EV6. (H) Schematic representation of a ER sheet where the Hsp70-to-Hsp90 chaperone exchange occurs for the quality control of ER client protein folding by the help of KIF5B molecular motor.
Figure EV1
Figure EV1. Conditional knockout of mouse Kif5b gene.
(AD) Establishment of beta-cell-specific Kif5b gene conditional knockout (cKO) mice, represented by a gene targeting strategy in mouse ES cells (A), Southern blotting screening for homologous recombinants (B; asterisks); genotyping PCR for the floxed allele (C: asterisk); and characterization of Rip2-Cre activity in a pancreas section detected by a LacZ reporter, ROSA-STOP mice (D). p, the 74 bp P-loop exon flanked by loxP sites (green triangles). S, SalI; A, ApaI; RI, EcoRI; RV, EcoRV; H, HindIII; X, XbaI. Arrows in (D), specific Cre/loxP recombination sites in the pancreas of a Rip2-Cre ROSA-STOP double heterozygous mouse. Scale bar, 100 μm. Corresponding to Fig. 1A–C.
Figure EV2
Figure EV2. KIF5B facilitates cortical actin remodeling.
(A) Time-lapse study of glucose-stimulated actin remodeling of primary beta cells from Lifeact-mCherry transgenic mouse pancreas, transduced with scrambled-control (SC) or KIF5B-knockdown (KD) miRNA expression vectors. Scale bar, 5 μm. Arrows, actin remodeling. Corresponding to Fig. 4A and Movie EV3. (BD) Rescue study of the glucose-stimulated actin remodeling in cKO primary beta cells by transducing KIF5B-EYFP, represented by immunoblotting of the expressed proteins in Ins1 cells using a mouse anti-GFP antibody and a rabbit anti-KIF5B antibody (B), Lifeact-mCherry transgene labeling (C), and F-actin quantification (D). Scale bar, 5 μm. Asterisks in (B), bands for tagged KIF5B. Arrow in (C), actin remodeling. **P = 0.0042, two-sided unpaired Welch’s t test; n = 18. Corresponding to Fig. 4A. (E) Stereoscopic fluorescence microscopy of a cKO primary beta-cell expressing tagRFP-Hsp90 (red) and KIF5B-EYFP (green). Scale bar, 5 μm. Data are represented by the mean ± SEM. Corresponding to Fig. 8A.

References

    1. Abramoff MD, Magelhaes PJ, Ram SJ (2004) Image processing with ImageJ. Biophotonics Int 11:36–42
    1. Altier C, Garcia-Caballero A, Simms B, You H, Chen L, Walcher J, Tedford HW, Hermosilla T, Zamponi GW (2011) The Cavbeta subunit prevents RFP2-mediated ubiquitination and proteasomal degradation of L-type channels. Nat Neurosci 14:173–180 - PubMed
    1. Aoki R, Kitaguchi T, Oya M, Yanagihara Y, Sato M, Miyawaki A, Tsuboi T (2010) Duration of fusion pore opening and the amount of hormone released are regulated by myosin II during kiss-and-run exocytosis. Biochem J 429:497–504 - PubMed
    1. Arous C, Halban PA (2015) The skeleton in the closet: actin cytoskeletal remodeling in beta-cell function. Am J Physiol Endocrinol Metab 309:E611–E620 - PubMed
    1. Arystarkhova E, Liu YB, Salazar C, Stanojevic V, Clifford RJ, Kaplan JH, Kidder GM, Sweadner KJ (2013) Hyperplasia of pancreatic beta cells and improved glucose tolerance in mice deficient in the FXYD2 subunit of Na,K-ATPase. J Biol Chem 288:7077–7085 - PMC - PubMed

MeSH terms