. 2024 Nov;43(21):5260-5287.
doi: 10.1038/s44318-024-00214-1. Epub 2024 Sep 25.

Chromatin protein complexes involved in gene repression in lamina-associated domains

Affiliations

Chromatin protein complexes involved in gene repression in lamina-associated domains

Stefano G Manzo et al. EMBO J. 2024 Nov.

Abstract

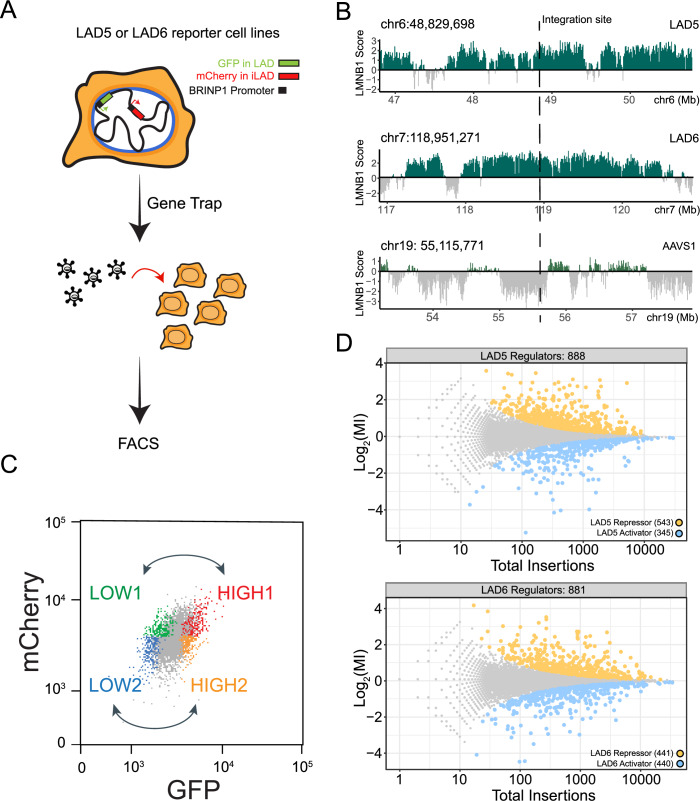
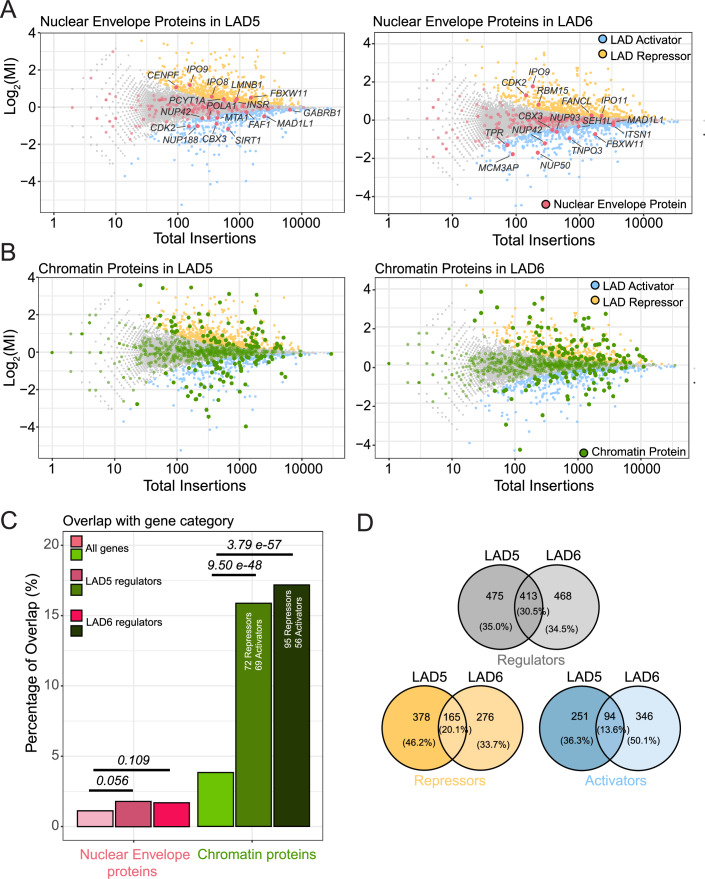
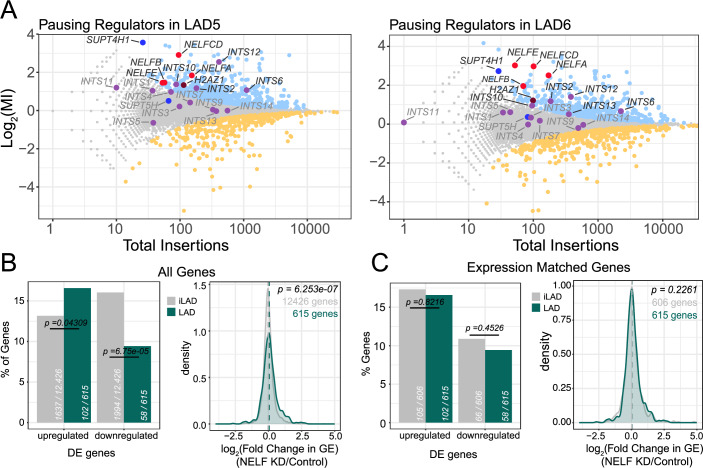
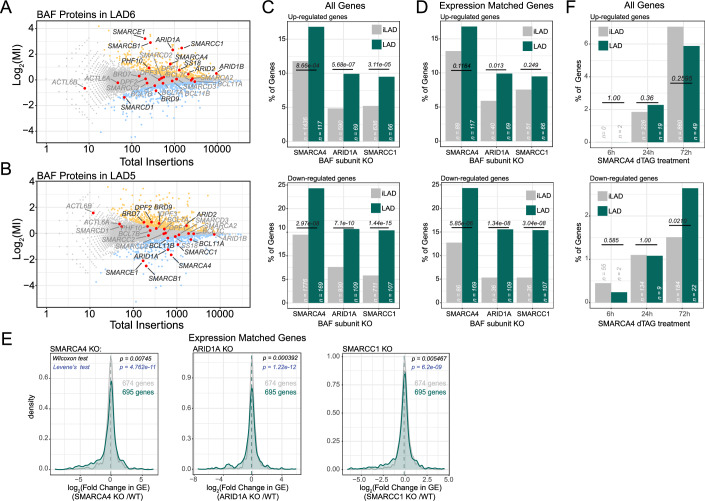
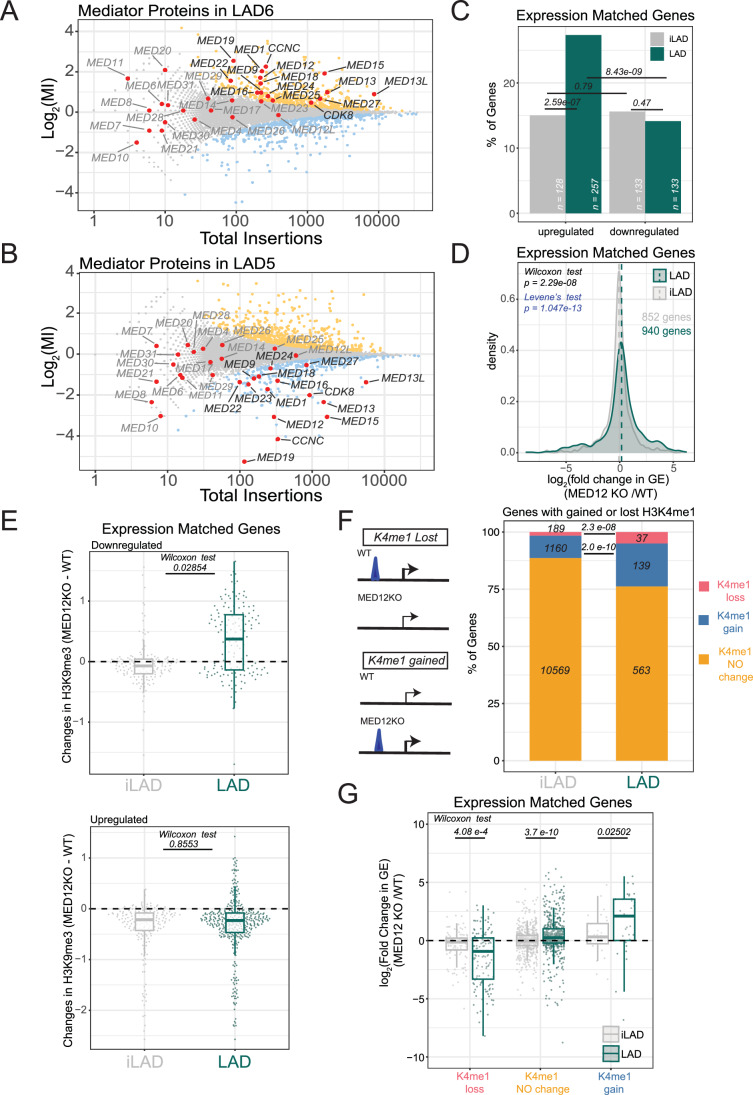
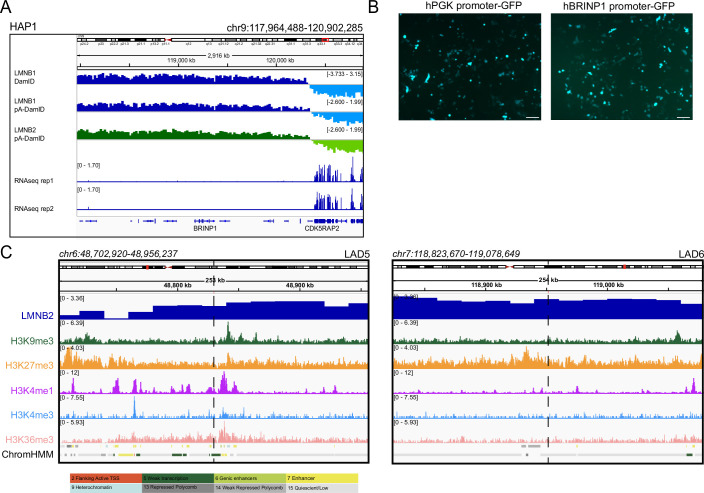
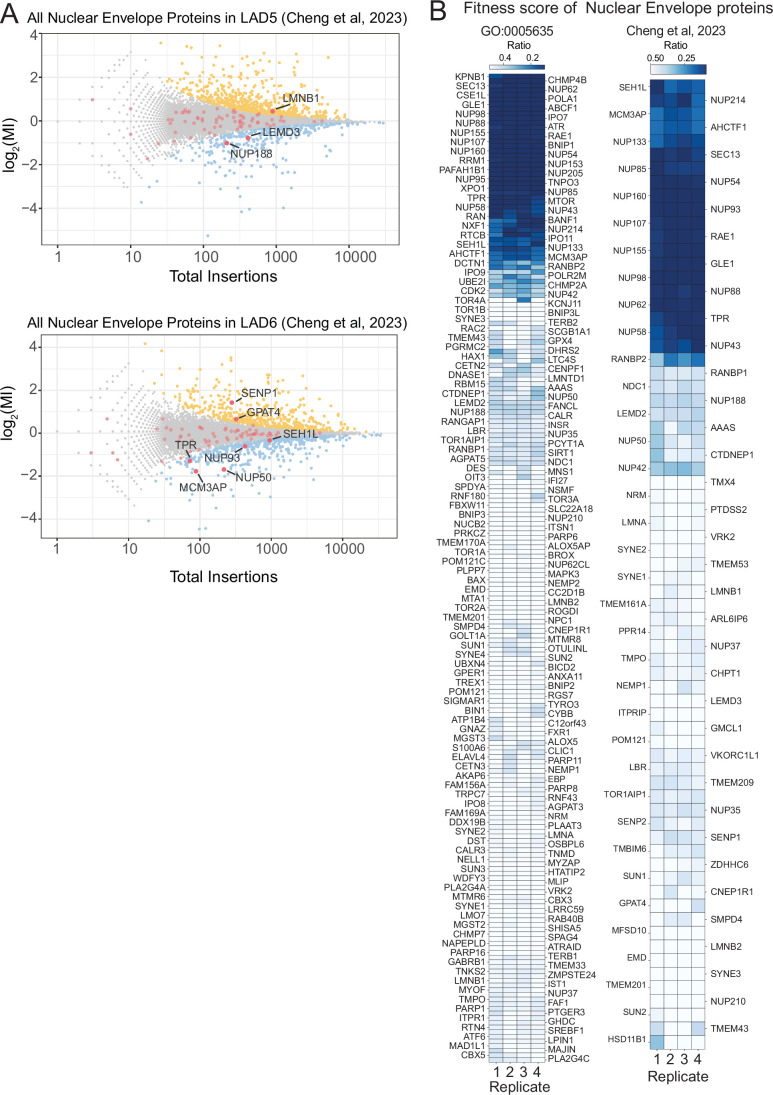
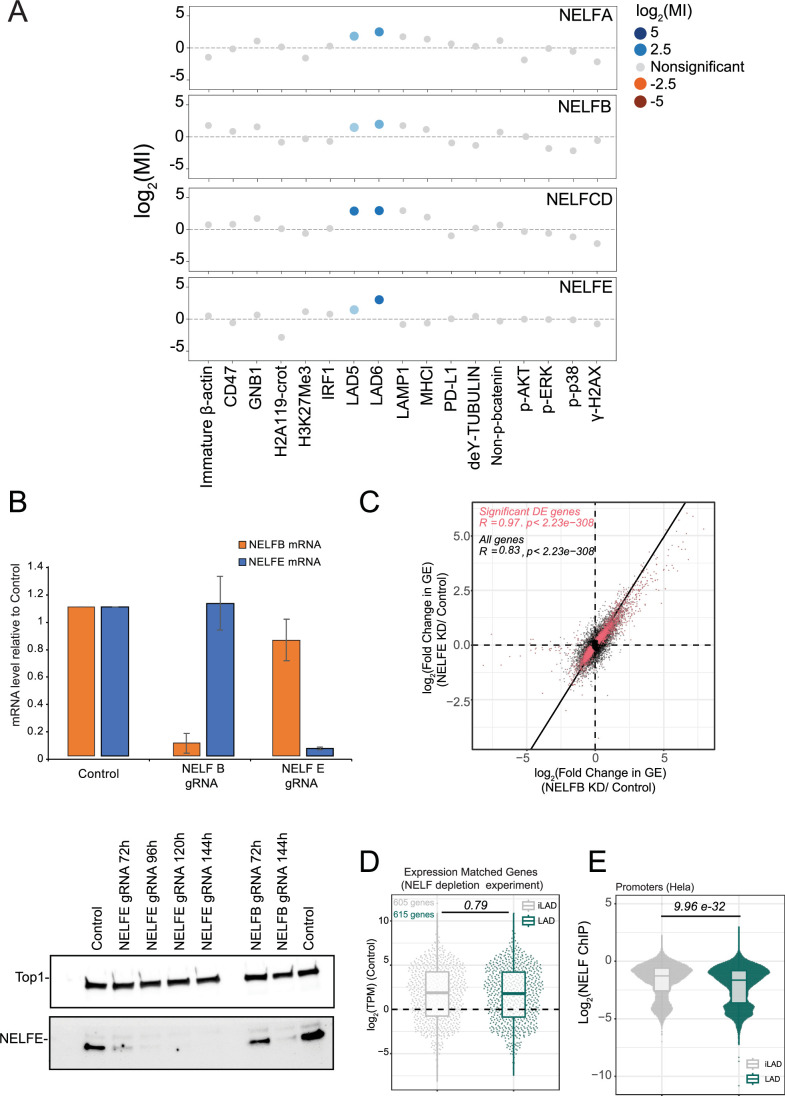
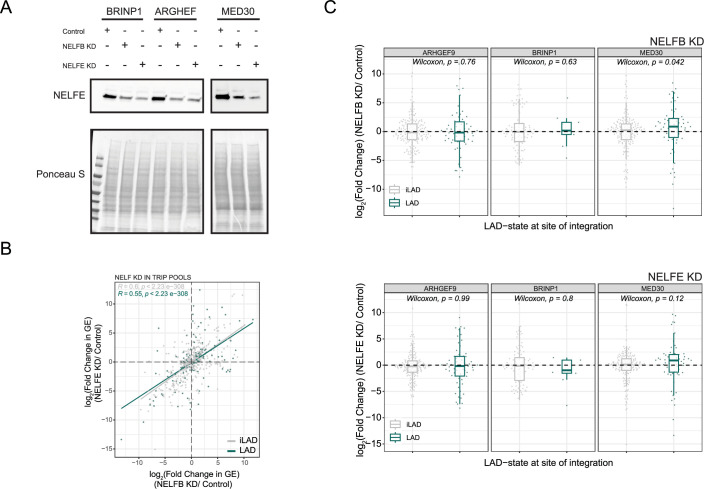
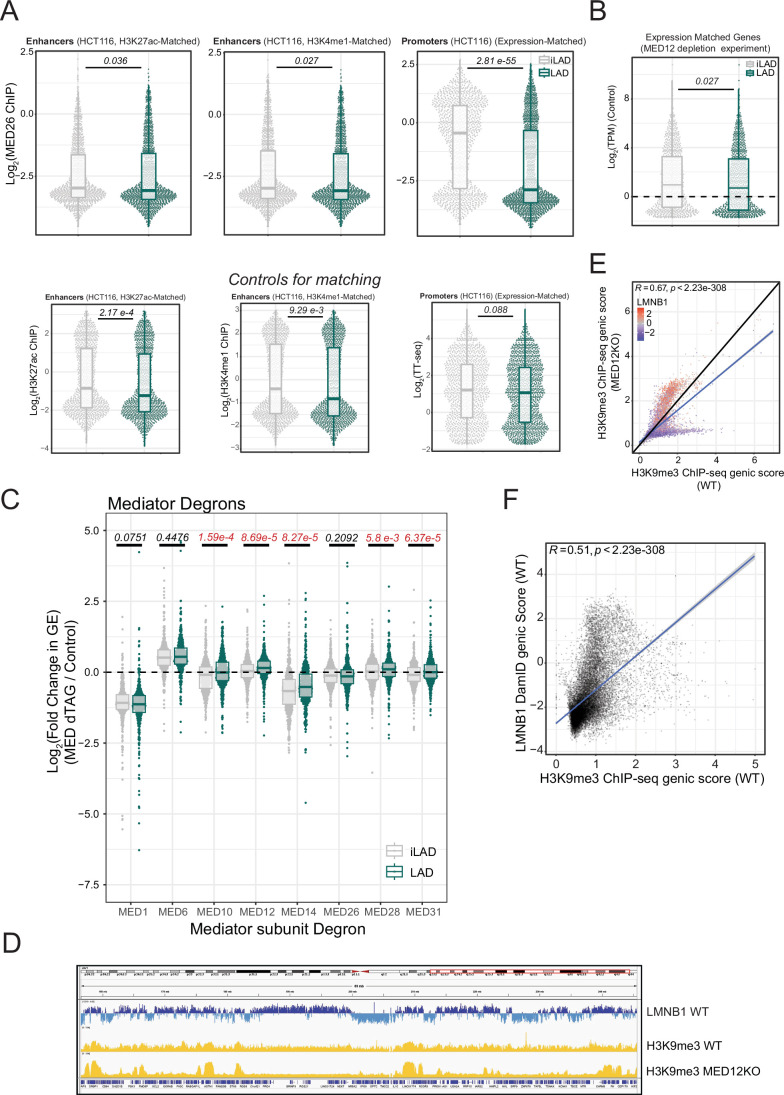
Lamina-associated domains (LADs) are large chromatin regions that are associated with the nuclear lamina (NL) and form a repressive environment for transcription. The molecular players that mediate gene repression in LADs are currently unknown. Here, we performed FACS-based whole-genome genetic screens in human cells using LAD-integrated fluorescent reporters to identify such regulators. Surprisingly, the screen identified very few NL proteins, but revealed roles for dozens of known chromatin regulators. Among these are the negative elongation factor (NELF) complex and interacting factors involved in RNA polymerase pausing, suggesting that regulation of transcription elongation is a mechanism to repress transcription in LADs. Furthermore, the chromatin remodeler complex BAF and the activation complex Mediator can work both as activators and repressors in LADs, depending on the local context and possibly by rewiring heterochromatin. Our data indicate that the fundamental regulators of transcription and chromatin remodeling, rather than interaction with NL proteins, play a major role in transcription regulation within LADs.

Keywords: Chromatin; Gene Repression; Lamina-associated Domains; Mediator; Nuclear Lamina.


Conflict of interest statement

The authors declare no competing interests.

Figures

Figure 1
Figure 1. Designing a screen for LAD-specific transcriptional regulators.
(A) Overview of the haploid genetic screen design. The pBRINP1::GFP reporter was integrated in two different LADs generating two clonal HAP1 cell lines. In the same cell lines pBRINP1::mCherry was integrated in the inter-LAD locus AAVS1. Cells were transduced with a gene-trap lentivirus to generate random knockouts and sorted according to fluorescence intensity. (B) Genomic tracks of LMNB1 DamID signal showing the two LADs (LAD5 and LAD6) and the AAVS1 locus selected as integration sites. (C) Sorting strategy for comparison of HIGH and LOW GFP in gene trapped cells. (D) Fishtail plots showing the mutational index (y-axis, MI) and total number of insertions (x-axis) for all genes. Non-significant genes are colored in gray, significant hits (fcpv < 0.05) are colored in yellow for LAD reporter repressors (positive MI) and in blue for LAD reporter activators (negative MI). Top panel: results for LAD5. Bottom panel: results for LAD6. Screens results are from one biological replicate.
Figure 2
Figure 2. Chromatin proteins rather than NL components modulate expression of LAD reporters.
(A) Screen hits (LAD activators and repressors) annotated as NE proteins (red, GO category GO:0005635). (B) Screen hits annotated as chromatin proteins (green, GO:0006325, GO:0140110, and GO:0003682 combined). (C) Enrichment analysis for NE and chromatin proteins in the LAD reporter regulators dataset. Statistical significance was calculated with Fisher’s Exact Test. (D) Partial overlap of LAD5 and LAD6 regulators (gray Venn diagram for all LAD regulators, yellow for repressors, blue for activators).
Figure 3
Figure 3. Screens identify regulators of PolII elongation as repressors in LADs.
(A) Mutational indices for pausing regulators, in LAD5 (left panel) and LAD6 (right panel). Blue, LAD activators; orange, LAD repressors. Gray, non-significant genes. Several complexes or proteins involved in regulation of pausing are highlighted with different colors. (B) Left: Percentage of up- and down-regulated genes in LADs and iLADs after NELF knockdown. Numbers of genes analyzed in each class are indicated. Completely inactive genes (TPM < 0.3 in control sample) were not included in this analysis. Statistical significance was calculated according to Fisher’s Exact Test. Right: density plot of log2 (fold change) in gene expression (GE) following NELF knockdown for all LAD and iLAD genes. P value according to Wilcoxon’s test. (C) Same as (B), but using a subset of iLAD genes that matched LAD genes for expression levels. Data are from 2 replicates for NELFB knockdown and 3 replicates for NELFE knockdown which were combined together.
Figure 4
Figure 4. BAF complex has an amplified role in LADs.
(A, B) Screen results with BAF complex subunits highlighted in red. BAF mainly acts as a repressor in LAD6 (A) and mostly as an activator in LAD5 (B). Blue, LAD activators; orange, LAD repressors; gray, not significant; red, BAF subunits. (C) Percentage of up- and down-regulated genes in LADs and iLADs in SMARCA4, ARID1A, and SMARCC1 knockout cells. “n” indicates the number of genes analyzed in each class. Completely inactive genes (TPM < 0.3 in control sample) were not included in this analysis. (D) Same as (C), but using a subset of iLAD genes that matched LAD genes for expression levels. (E) Density plot of of log2 (fold change) in gene expression (GE) following SMARCA4, ARID1A, and SMARCC1 knockout for LAD genes and expression-matched iLAD genes. Data are from (Schick et al, 2019). Results are from three biological replicates. Statistical significance was calculated with Wilcoxon test for comparison of median, and Levene’s test for comparison of variance. (F) Same as (C), but for acute depletion of SMARCA4 (6, 24, and 72 h of depletion) (Schick et al, 2021). Results are from two biological replicates. For (C), (D), and (F) Statistical significance was calculated with Fisher’s Exact test.
Figure 5
Figure 5. Mediator modulates heterochromatin and putative enhancers in LADs.
(A, B) Screen results with Mediator subunits highlighted in red. Mediator mainly acts as a repressor in LAD6 (A) and mostly as an activator in LAD5 (B). Blue, LAD activators; orange, LAD repressors; gray, not significant; red, Mediator subunits. (C) Percentage of up- and down-regulated genes following MED12 knockout for LAD and expression-matched iLAD genes. “n” indicates the number of genes analyzed in each class. Completely inactive genes (TPM < 0.3 in control sample) were not included in this analysis. Statistical significance was calculated with Fisher’s Exact test (D) log2(fold change) in gene expression (GE) following MED12 knockout for expression-matched LAD and iLAD genes. Statistical significance was calculated with Wilcoxon test for comparison of median, and Levene’s test for comparison of variance. (E) Changes in H3K9me3 levels at genes for downregulated (top) and upregulated (bottom) LAD genes or expression-matched iLAD genes. (F) Left: cartoon depicting how gain and loss of H3K4me1 peaks following MED12 knockout were selected. Right: Proportion of iLAD and LAD genes with a gain or loss of proximal H3K4me1 peak following MED12 knockout. P values according to Fisher’s Exact test. (G) log2(fold change) in gene expression (GE) following MED12 knockout for LAD and expression-matched iLAD genes, divided by gain or loss of proximal H3K4me1 peak following MED12 knockout. P values in (E, G) are according to Wilcoxon’s test. For (G, E), the central line in the boxplots represents the median. The lower and upper hinges correspond to the first and third quartiles (the 25th and 75th percentiles). The upper and lower whiskers extends from the hinge to the largest or smallest values respectively no further than 1.5 * inter-quartile range. Outliers were removed only for visualization purposes. For (B, CF, G), data are from (Haarhuis et al, 2022) and results are from 6 biological replicates.
Figure EV1
Figure EV1. Characterization of BRINP1 promoter and the chromatin environment around LAD reporters’ integration sites in HAP1 cells.
(A) Top tracks: IGV tracks showing DNA-NL contacts (generated by in vivo DamID, LMNB1 pA-DamID, and LMNB2 pA-DamID) of 3 Mb region surrounding the BRINP1 gene. Bottom tracks: RNA-seq levels for BRINP1 and surrounding genes in the same 3 Mb genomic regions. (B) Transfection of HAP1 cells with phPGK::GFP or pBRINP1::GFP plasmids. BRINP1 promoter is active in HAP1 cells when expressed in an episomal setting. Scale is at 20 μm. (C) DamID tracks for LMNB2 and ChIP-seq data for H3K9me3, H3K27me3, H3K4me1, H3K4me3, and H3K36me3 in HAP1 in a 250 kb window surrounding LAD5 and LAD6 reporter integrations (dashed lines). Data are from (Haarhuis et al, 2022). The bottom track shows annotations of major chromatin states according to ChromHMM (Ernst and Kellis, 2012); corresponding color key is shown in the bottom panel. Results are from at least two biological replicates.
Figure EV2
Figure EV2. Nuclear Lamina genes in the screen and their essentiality in HAP1 cells.
(A) Biochemically identified NE proteins (Cheng et al, 2019) (red dots) highlighted in the screen fishtail plots for LAD5 (top) and LAD6 (bottom). The majority of these NE proteins are not significant hits in the screens. Names of the handful of significant screen hits are indicated in black. (B) Essentiality scores of proteins in GO category GO:0005635 (left panel) and of proteins biochemically identified as NE proteins (Cheng et al, 2019), (right panel). Heatmaps show the ratio of sense insertions to the total insertions in wild-type HAP1 cells across 4 independent replicates under untreated conditions. Data are from (Blomen et al, 2015). The scores represent the ratio of disruptive insertions (sense) to the total insertions (sense “disruptive” + antisense “non-disruptive”) within the intronic regions of each gene. Genes crucial for cell viability will have fewer disruptive insertions as these cells are depleted, whereas cells with non-disruptive (antisense) insertions survive. As disruptive and non-disruptive integrations occur at similar frequencies, the ratio of insertions in the surviving population indicates whether a gene is important for cell fitness (Blomen et al, 2015). The lower the ratio (blue shading), the more important the gene is for HAP1 cell fitness. Results from 4 different biological replicates are shown separately.
Figure EV3
Figure EV3. NELF depletion in HAP1.
(A) The mutational index (MI) for subunits from the NELF complex (NELFA, NEFLB, NELFCD, NELFE) was plotted for the current LAD5 and LAD6 screens and 15 additional FACS-based haploid screens previously conducted in HAP1 cells using the indicated readouts (blue, negative regulator; orange, positive regulator; gray, not significant) (Brockmann et al, ; Haahr et al, ; Jongsma et al, ; Logtenberg et al, ; Mazouzi et al, ; Mezzadra et al, ; Nieuwenhuis et al, 2017). (B) NELF depletion by CRISPRi in HAP1. Top panel: mRNA levels (measured by RT-qPCR) for NELFE and NELFB following CRISPRi depletion using NELFE and NELFB specific guide RNAs, 144 h after transduction. Data were first normalized on GAPDH mRNA and then on NELFE/B mRNA levels in control cells. The error bar represents standard deviation. Results were from three replicates. Bottom panel: detection of NELFE protein levels following CRISPRi depletion using NELFE and NELFB specific guide RNAs at different timepoints after transduction. DNA topoisomerase 1 (Top1) antibody was used as loading control. (C) Correlation between changes in gene expression following NELFB and NELFE knockdowns, for all (black) and significantly de-regulated genes (red). Results were from three replicates for NELFE depletion and two replicates for NELFB depletion. The black line is the diagonal. (D) Gene expression levels for expression-matched LAD and iLAD genes in the NELF depletion experiment. (E) NELFE levels at promoters of genes in LADs and expression-matched genes in iLADs in HeLa cells. ChIP-seq data are from (Beckedorff et al, 2020). Results are from two biological replicates. P value is according to Wilcoxon’s test. For (D, E), the central line in the boxplots represents the median. The lower and upper hinges correspond to the first and third quartiles (the 25th and 75th percentiles). The upper and lower whiskers extends from the hinge to the largest or smallest values respectively no further than 1.5 * inter-quartile range. Outliers were removed only for visualization purposes. Source data are available online for this figure.
Figure EV4
Figure EV4. NELF depletion in K562 TRIP pools.
(AC) Multiplexed detection of the effect of depletion of NELFB and NELFE on the expression levels of reporter genes randomly integrated throughout the genome in K562 cell pools. Barcoded reporters were driven by promoters from the ARHGEF9, BRINP1, and MED30 genes as indicated. Cell pools are from (Leemans et al, 2019). (A) Western blot of NELFE showing partial knockdown after siRNA-mediated depletion of NELFB or NELFE. (B) Changes in expression of the reporters for the three promoters throughout the genome correlate between NELFB and NELFE knockdowns. Reporters integrated in LADs are shown in green, reporters in iLADs are shown in gray. The gray and green lines represent a fitted linear model for iLAD and LAD integrations, respectively; Pearson correlation and P values are shown in the plots. (C) Changes in expression of each reporter (log2 scale) after siRNA-mediated knock-down of NELFB (top panel) and NELFE (bottom panel), divided by location in either LADs or iLADs. Results are from three replicates for PBRINP1 and two replicates for PMED30 and PARHGEF9. P-values comparing the distributions in LADs and iLADs are according to Wilcoxon test. Source data are available online for this figure.
Figure EV5
Figure EV5. Characterization of Mediator complex in LADs.
(A) Top panels: MED26 binding at promoters and enhancers in HCT116 cells. Promoters were matched for TT-seq level to compare LAD and iLAD genes with similar transcriptional activity. Enhancers were matched for H3K27ac or H3K4me1 levels to compare LAD and iLAD regulatory elements with similar enhancer activity. P values in are according to Wilcoxon’s test. Bottom panels: plot showing the similar distributions of H3K27ac (left) or H3K4me1 (middle) for matched sets of enhancers; and TT-seq levels for matched sets of promoters (right) in LADs and iLADs.Data are from two biological replicates. (B) Gene expression levels for expression-matched LAD and iLAD genes in the MED12 depletion experiments. Data are from (Haarhuis et al, 2022) and results are from 6 biological replicates. (C) Log2(fold change) in gene expression (GE) following acute depletion of Mediator subunits for expression-matched LAD and iLAD genes. Statistical significance was calculated with Wilcoxon test for comparison of median and significant P values are highlighted in red. Results are from three biological replicates (D) IGV genomic tracks for 89 Mb of Chromosome 1 showing LMNB1 DamID profile for HAP1 WT (blue) and H3K9me3 ChIP-seq scores for HAP1 WT and MED12 KO (yellow). The genomic tracks show increased compartmentalization of heterochromatin in LADs following MED12 knockout. (E) Correlation between H3K9me3 levels for genes in WT and MED12 knockout cell lines. Datapoints are colored by LMNB1 DamID score. (F) Correlation between genic LMNB1 DamID score in WT and H3K9me3 levels in WT cells. The blue line (E, F) represents a fitted linear model; Pearson correlation and P values are shown in the plots. Results (E, F) are from three biological replicates. Data are from (El Khattabi et al, ; Leemans et al, ; Lidschreiber et al, ; Schick et al, ; Haarhuis et al, , 35136067). For (AC), the central line in the boxplots represents the median. The lower and upper hinges correspond to the first and third quartiles (the 25th and 75th percentiles). The upper and lower whiskers extends from the hinge to the largest or smallest values respectively no further than 1.5 * inter-quartile range. Outliers were removed only for visualization purposes.

References

    1. Ahanger SH, Delgado RN, Gil E, Cole MA, Zhao J, Hong SJ, Kriegstein AR, Nowakowski TJ, Pollen AA, Lim DA (2021) Distinct nuclear compartment-associated genome architecture in the developing mammalian brain. Nat Neurosci 24:1235–1242 - PMC - PubMed
    1. Akhtar W, de Jong J, Pindyurin AV, Pagie L, Meuleman W, de Ridder J, Berns A, Wessels LF, van Lohuizen M, van Steensel B (2013) Chromatin position effects assayed by thousands of reporters integrated in parallel. Cell 154:914–927 - PubMed
    1. Alagna NS, Thomas TI, Wilson KL, Reddy KL (2023) Choreography of lamina-associated domains: structure meets dynamics. FEBS Lett 597:2806–2822 - PMC - PubMed
    1. Alfert A, Moreno N, Kerl K (2019) The BAF complex in development and disease. Epigenetics Chromatin 12:19 - PMC - PubMed
    1. Amendola M, van Steensel B (2015) Nuclear lamins are not required for lamina-associated domain organization in mouse embryonic stem cells. EMBO Rep 16:610–617 - PMC - PubMed

MeSH terms

LinkOut - more resources