. 2024 Dec;16(12):2017-2024.
doi: 10.1038/s41557-024-01620-y. Epub 2024 Sep 25.

Few-femtosecond electron transfer dynamics in photoionized donor-π-acceptor molecules

Affiliations

Few-femtosecond electron transfer dynamics in photoionized donor-π-acceptor molecules

Federico Vismarra et al. Nat Chem. 2024 Dec.

Abstract

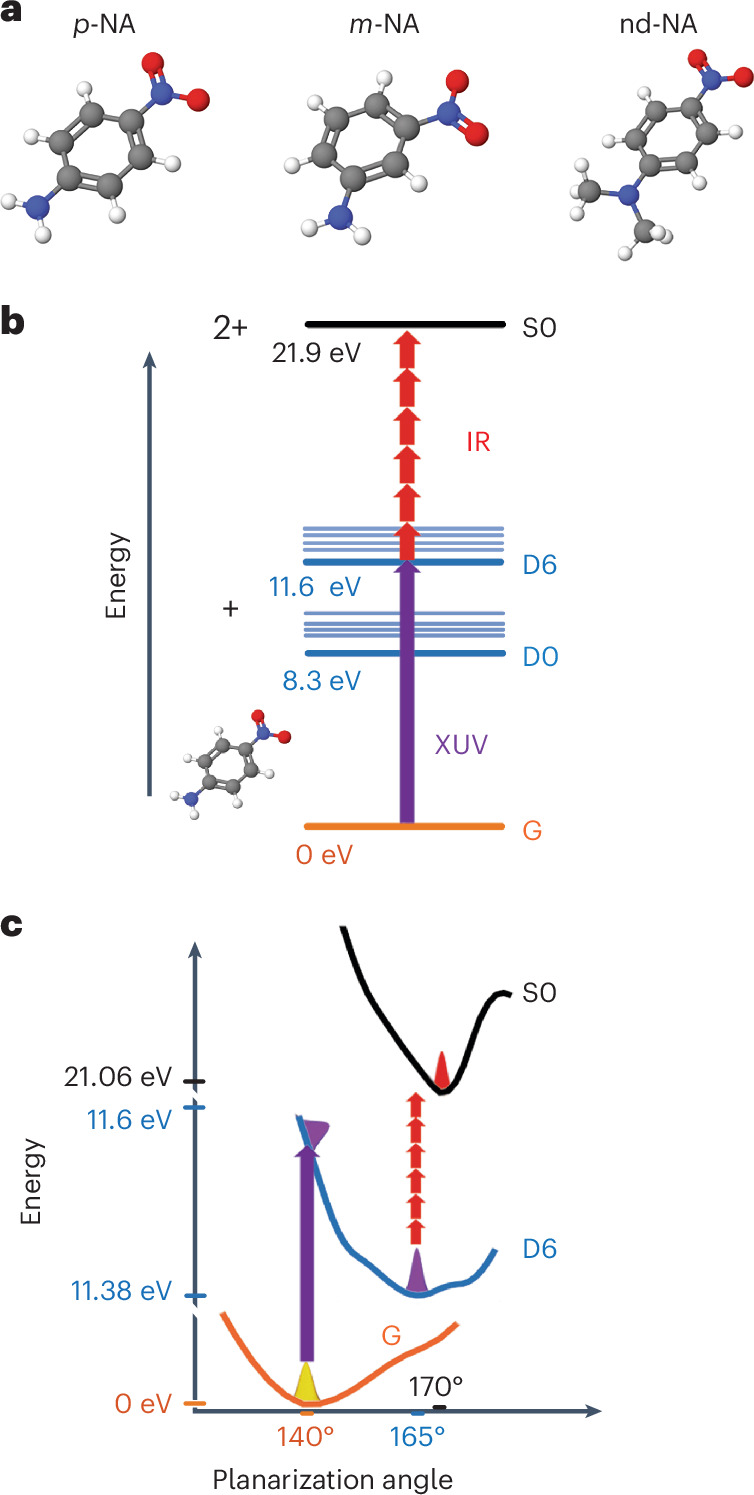
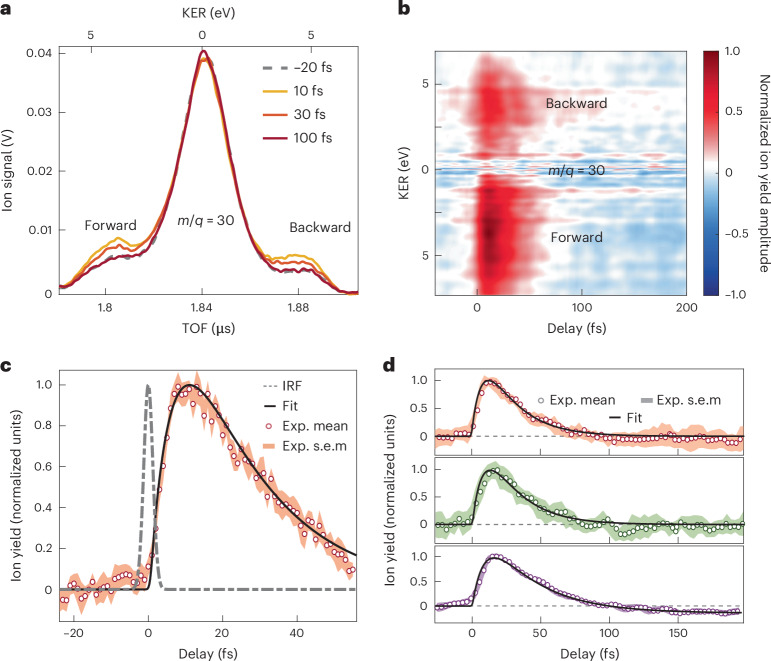
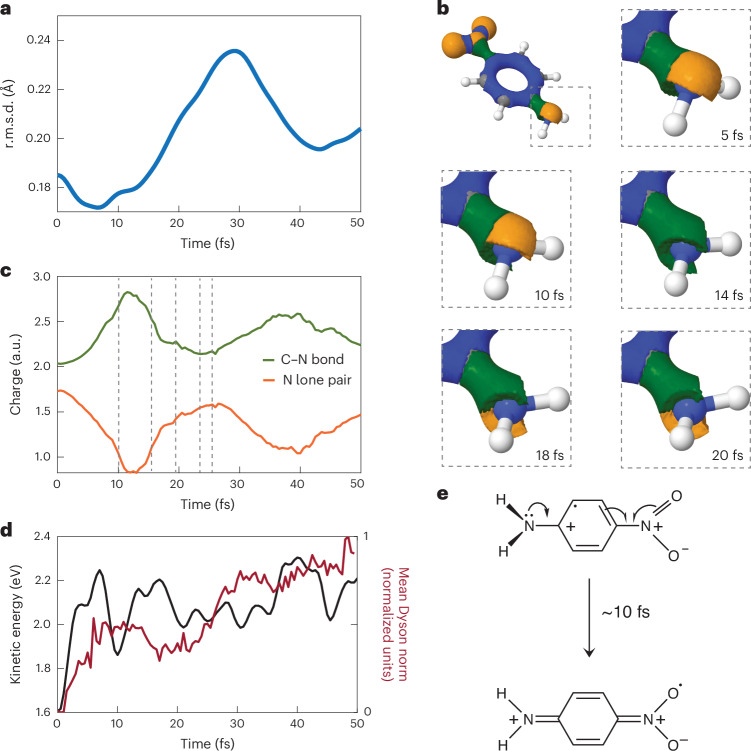
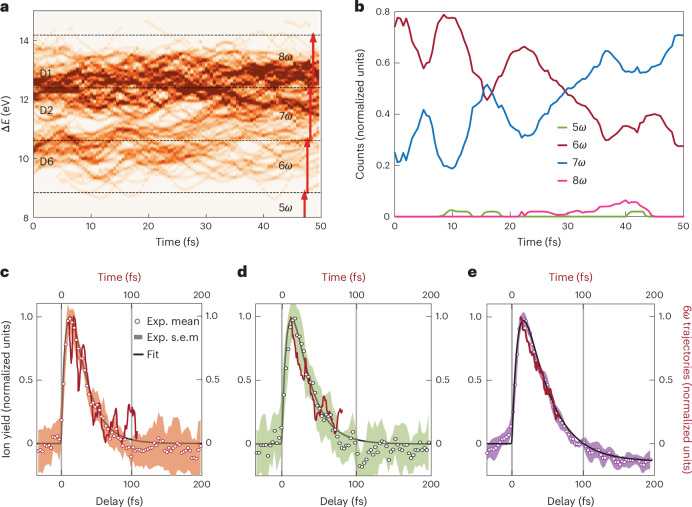
The exposure of molecules to attosecond extreme-ultraviolet (XUV) pulses offers a unique opportunity to study the early stages of coupled electron-nuclear dynamics in which the role played by the different degrees of freedom is beyond standard chemical intuition. We investigate, both experimentally and theoretically, the first steps of charge-transfer processes initiated by prompt ionization in prototype donor-π-acceptor molecules, namely nitroanilines. Time-resolved measurement of this process is performed by combining attosecond XUV-pump/few-femtosecond infrared-probe spectroscopy with advanced many-body quantum chemistry calculations. We show that a concerted nuclear and electronic motion drives electron transfer from the donor group on a sub-10-fs timescale. This is followed by a sub-30-fs relaxation process due to the probing of the continuously spreading nuclear wave packet in the excited electronic states of the molecular cation. These findings shed light on the role played by electron-nuclear coupling in donor-π-acceptor systems in response to photoionization.


Conflict of interest statement

Competing interests: The authors declare no competing interests.

Figures

Fig. 1
Fig. 1. Molecular structures and experimental strategy.
a, Molecular structures of p-NA, m-NA and nd-NA. Red, oxygen; blue, nitrogen; black, carbon; white, hydrogen. b, Scheme of the pump–probe experiment. The XUV attosecond pulse ionizes the molecule from the ground state G, thus creating a superposition of cationic states (D0, D1, …). A delayed VIS-NIR field favours a second ionization by multiphoton absorption, creating a dication. c, Calculated potential energy curves versus the planarization angle of the amino group with respect to the benzene ring of the ground state, G, of the neutral p-NA molecule, the excited state D6 of the cation and the ground state S0 of the dication. After an initial localization into a minimum of potential in D6, the wave packet spreads over several degrees of freedom.
Fig. 2
Fig. 2. Time-resolved measurements.
a, Experimental TOF spectra of NO+ (m/q = 30) for different time delays between pump and probe pulses in the case of p-NA. The upper x axis displays the kinetic energy release (KER) for both forward and backward emitted ions. b, Normalized differential mass spectra of NO+ for p-NA versus pump–probe time delay obtained by determining the difference between the spectra acquired with and without the probe pulse. c, NO+ yield in the case of p-NA obtained by integrating the TOF spectra of the high-energy NO+ ion emitted in the forward direction in a 3 eV kinetic energy window centred on the maximum of the corresponding shoulder. Data are presented as mean values over six acquisitions ± s.e.m, here represented as a shaded area. The black line is a fitting curve with an exponential rise time of 9.3 fs and an exponential relaxation time of 22.4 fs; the dash-dotted grey line is the impulsive response function (IRF). d, NO+ yield in the case of p-NA (orange, same as c), m-NA (green) and nd-NA (purple) obtained by integrating the TOF spectra of the high-energy NO+ ion emitted in the forward direction. Data are presented as mean values ± s.e.m.
Fig. 3
Fig. 3. Sub-10-fs planarization process.
a, Calculated temporal evolution of the average r.m.s.d. of all the trajectories initialized in electronic state D6 of p-NA with respect to the planar minimum geometry. The lower the values of the r.m.s.d, the closer to the planar geometry. b, Snapshots of the evolution of the electronic density. The colours indicate the basins where the density is assigned. In the NH2 region, orange indicates the lone pair of the nitrogen; green indicates the C–N bond. c, Temporal evolution of the average charge in the ELF basins for the lone pair of the nitrogen N in the NH2 group (orange) and the C–N bond connecting it to the ring (green). d, Temporal evolution of the average kinetic energy of the nuclear wave packet (black curve) and the average Dyson norm (red curve) corresponding to the orbital that results from the projection of the whole wave packet in the monocation at each time-step of the surface hopping trajectory onto the dication. e, Lewis structures representing the CT from the lone pair of the nitrogen to the adjacent C–N bond and from the NO2 group to the other C–N bond.
Fig. 4
Fig. 4. Sub-30-fs relaxation dynamics.
a, Temporal evolution of the energy difference between the D1, D2 and D6 states of the cation and ground state of the dication for all the p-NA trajectories. The dotted horizontal black lines mark energy gaps for absorption of a VIS-NIR photon (represented by a red arrow). b, Normalized number of trajectories requiring five, six, seven and eight VIS-NIR photons (ω) to reach the ground state S0 of the dication in p-NA, for the trajectories initiated in the highest electronic states (D6). ce, Normalized number of trajectories requiring the absorption of six VIS-NIR photons to reach S0 (dark red line) compared with the measured yields (circles and shaded area) for p-NA (c), m-NA (d) and nd-NA (e), obtained by integrating the TOF spectra of the high-energy NO+ ion emitted in the forward direction (same as in Fig. 2d). To guide the eye, the fits to the experimental spectra are also indicated by thin continuous lines. Data are presented as mean values ± s.e.m.
Extended Data Fig. 1
Extended Data Fig. 1. PEPICO measurements.
3D plot of the PEPICO matrix for p-NA. The x-axis represents the binding energy (BE), the y-axis the mass to charge ratio (m/q) and the z-axis the number of events collected at the detector normalized to the maximum number of events. The solid orange line is the photoelectron spectrum while the pink solid line is the ion mass spectrum.
Extended Data Fig. 2
Extended Data Fig. 2. C–N and C–C bond lengths for p-NA.
Variation of the C–N (top panels) and C–C (lower panels) bond lengths for p-NA (panels a, d), m-NA (panels b, e) and nd-NA (panels c, f). The dynamics was started from the D6 state of p-NA, D8 state of m-NA and D5 state from nd-NA.
Extended Data Fig. 3
Extended Data Fig. 3. Evolution of the electronic density in the NO2 region.
(a) Snapshots of the evolution of the electronic density. The colours indicate the basins where the density is assigned. In the NO2 region, blue indicates the N–O bonds while green indicates C–N bond. (b) Temporal evolution of the average charge in the ELF basins for the N–O bonds group (blue) and the C–N bond connecting it to the ring (green).
Extended Data Fig. 4
Extended Data Fig. 4. Evolution of the population of adiabatic states of p-NA.
Time evolution of the population of all adiabatic states included in the SH calculations initiated in the D6 state of p-NA.
Extended Data Fig. 5
Extended Data Fig. 5. Coulomb Explosion.
Zoom of PEPICO measurements around m/q = 30 (NO+) for the three investigated molecules, whose chemical structures are reported in the right column. The yellow dashed line shows the dication appearance energy.
Extended Data Fig. 6
Extended Data Fig. 6. Mass spectra produced by attosecond excitation.
Mass spectra around fragment NO+ (m/q = 30) of p-NA (orange), m-NA (green) and nd-NA (purple) measured by using the attosecond beamline after XUV excitation.
Extended Data Fig. 7
Extended Data Fig. 7. PEPIPICO measurements in p-NA.
Ion-ion coincidence map of p-NA within the time-of-flight range where correlations between ion pairs with m/q = 30 and m/q = 108 (a) and between ion pairs with m/q = 46 and m/q = 92 (b) are expected.

References

    1. Borrego-Varillas, R., Lucchini, M. & Nisoli, M. Attosecond spectroscopy for the investigation of ultrafast dynamics in atomic, molecular and solid-state physics. Rep. Prog. Phys.85, 066401 (2022). - PubMed
    1. Nisoli, M., Decleva, P., Calegari, F., Palacios, A. & Martín, F. Attosecond electron dynamics in molecules. Chem. Rev.117, 10760–10825 (2017). - PubMed
    1. Wörner, H. J. et al. Charge migration and charge transfer in molecular systems. Struct. Dyn.4, 061508 (2017). - PMC - PubMed
    1. Barber, J. Photosynthetic energy conversion: natural and artificial. Chem. Soc. Rev.38, 185–196 (2009). - PubMed
    1. Zhou, X. et al. Probing and controlling non-Born–Oppenheimer dynamics in highly excited molecular ions. Nat. Phys.8, 232–237 (2012).

LinkOut - more resources