. 2024 Nov;16(11):3005-3025.
doi: 10.1038/s44321-024-00136-9. Epub 2024 Sep 25.

RIG-I is an intracellular checkpoint that limits CD8+ T-cell antitumour immunity

Affiliations

RIG-I is an intracellular checkpoint that limits CD8+ T-cell antitumour immunity

Xiaobing Duan et al. EMBO Mol Med. 2024 Nov.

Abstract

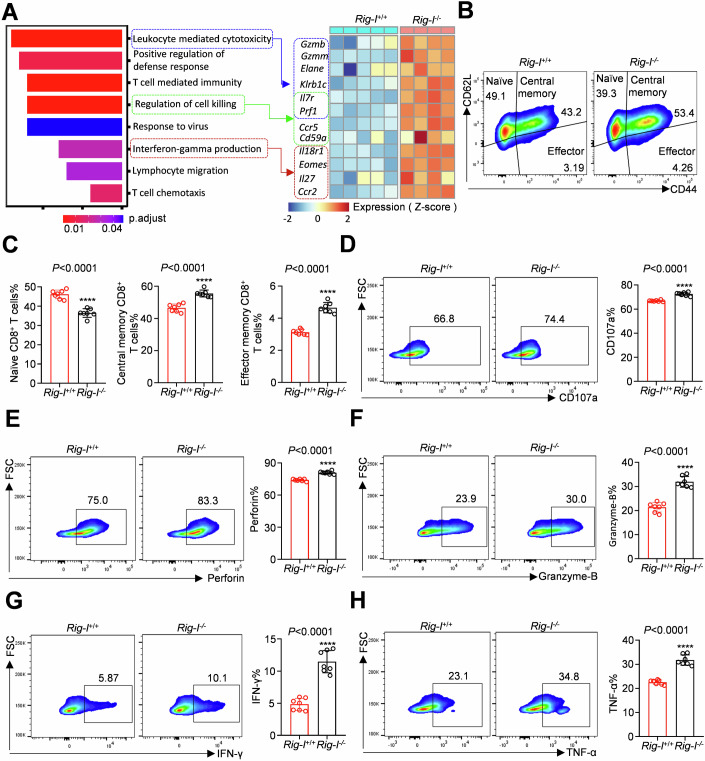
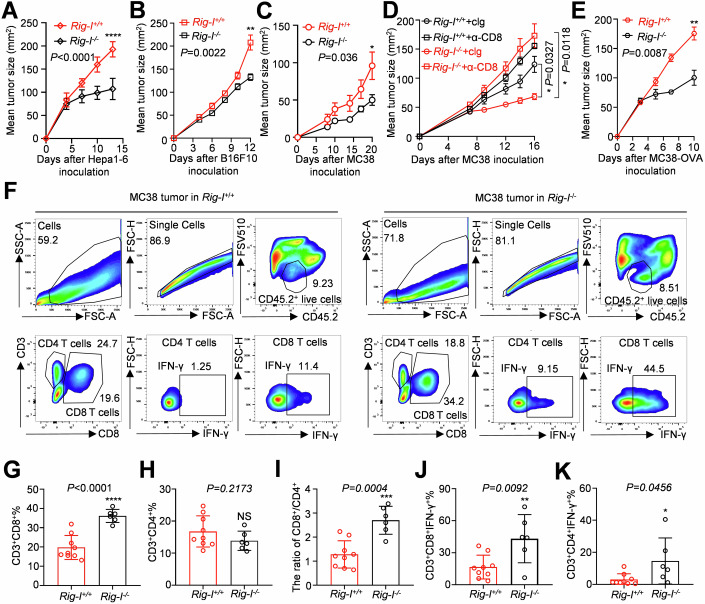
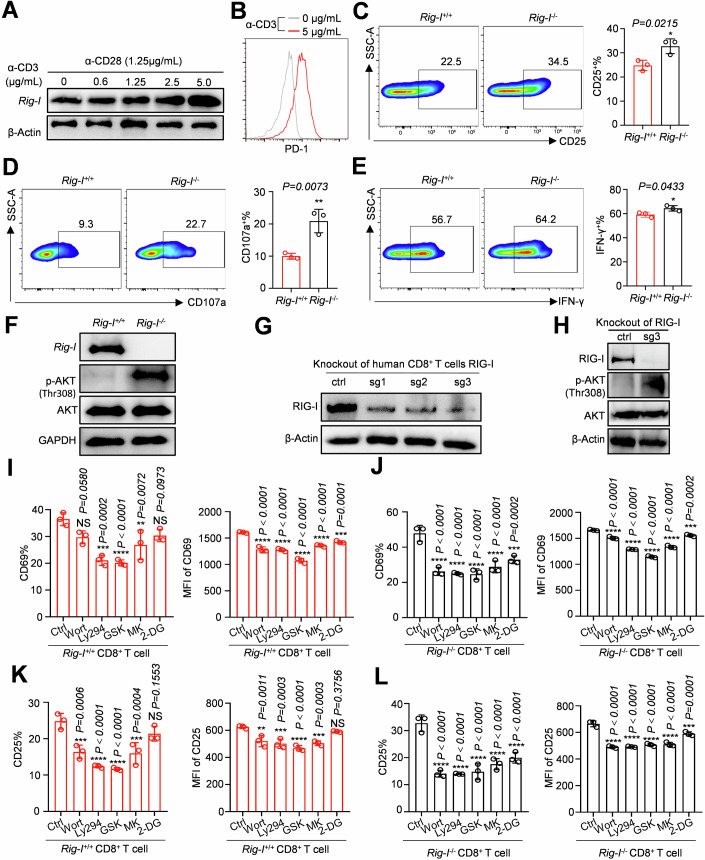
Retinoic acid-inducible gene I (RIG-I) is a pattern recognition receptor involved in innate immunity, but its role in adaptive immunity, specifically in the context of CD8+ T-cell antitumour immunity, remains unclear. Here, we demonstrate that RIG-I is upregulated in tumour-infiltrating CD8+ T cells, where it functions as an intracellular checkpoint to negatively regulate CD8+ T-cell function and limit antitumour immunity. Mechanistically, the upregulation of RIG-I in CD8+ T cells is induced by activated T cells, and directly inhibits the AKT/glycolysis signalling pathway. In addition, knocking out RIG-I enhances the efficacy of adoptively transferred T cells against solid tumours, and inhibiting RIG-I enhances the response to PD-1 blockade. Overall, our study identifies RIG-I as an intracellular checkpoint and a potential target for alleviating inhibitory constraints on T cells in cancer immunotherapy, either alone or in combination with an immune checkpoint inhibitor.

Keywords: AKT/Glycolysis Signalling Pathway; CD8+ T cells; Immune Checkpoint; Immunotherapy; RIG-I.


Conflict of interest statement

Disclosure and competing interests statement XBL is an employee of Huixin Life Science. The authors declare no competing interests.

Figures

Figure 1
Figure 1. Screening single-cell sequencing data and verification of RIG-I upregulation in CD8+ T cells infiltrating the TME.
(A, B) Cluster analysis of cell populations in HCC, ICC and metastatic melanoma. (C, D) Relative expression levels of the DDX58, PDCD1, TIGIT, CTLA-4, and TOX-associated genes in patients with HCC, ICC (C), and metastatic melanoma (D). (E, F) Relative expression levels of DDX58, IFIH1, DHX58, IPS-1, and STING in HCC, ICC (E) and metastatic melanoma (F) tissues. (GI) Multiple immunohistochemistry and statistical analyses of human HCC specimens; white scale bar = 50 μm. (J) The expression of granzyme-B secreted by infiltrating CD8+ T cells in the peritumor and tumour tissues of HCC by flow cytometry after stimulating with PMA/ionomycin and GolgiStop. Data information: The data represented different numbers (n = 5 or 4) of biological replicates and were shown as the means ± SEMs. Two-tailed unpaired Student’s t-test was used in (H) (P = 0.0419) and (I) (P = 0.0485). Two-tailed paired Student’s test was used in (J) (P = 0.0129). *P < 0.05, **P < 0.01, and ***P < 0.001 compared with peritumour tissues. Source data are available online for this figure.
Figure 2
Figure 2. Rig-I knockout enhanced the anti-tumour function of CD8+ T cells purified from the spleen ex vivo.
(A) RNA-seq and KEGG enrichment analysis of signalling pathways (left panel) and key genes associated with leucocyte-mediated cytotoxicity, regulation of cell killing and interferon-gamma production (right panel) in CD8+ T cells from Rig-I+/+/Rig-I−/ mouse spleens. (B, C) Flow cytometry analysis of the development (including naïve, central memory and effector cells) of CD8+ T cells purified from Rig-I+/+/Rig-I/ mouse spleens after α-CD3 and α-CD28 activation ex vivo. (DH) Flow cytometry analysis of CD107a, perforin, granzyme-B, IFN-γ and TNF-α levels in CD8+ T cells purified from Rig-I+/+/Rig-I−/− mouse spleens after α-CD3 and α-CD28 activation and stimulation with PMA/ionomycin and GolgiStop ex vivo. Data information: A hypergeometric test was used in (A). The data represented different numbers (n = 7) of biological replicates and were shown as the means ± SEMs in (CH). Two-tailed unpaired Student’s test was used in (CH) (P < 0.0001). ****P < 0.0001 compared with the Rig-I+/+ group. Source data are available online for this figure.
Figure 3
Figure 3. Rig-I knockout enhanced the anti-tumour function of CD8+ T cells in animal models.
(AC) Hepa1-6, MC38 and B16F10 cells were inoculated subcutaneously into Rig-I+/+ and Rig-I−/− mice, and the growth curves of Hepa1-6, MC38 and B16F10 tumours are shown. (D) After mice were treated with control immunoglobulin or a CD8 neutralising antibody, MC38 cells were inoculated subcutaneously into Rig-I+/+ and Rig-I/−mice, and tumour growth curves are shown. (E) MC38-OVA cells were inoculated subcutaneously into Rig-I+/+ and Rig-I−/− mice, and the growth curves of MC38-OVA tumours were shown. (F) Flow cytometry analysis of the IFN-γ level and proportion of CD8+ T/CD4+ T cells infiltrating tumours formed from the colon cancer cell line MC38 in Rig-I+/+ and Rig-I−/− mice after stimulation with PMA/ionomycin and GolgiStop. (GI) Statistics of the proportions of CD8+ T (G) and CD4+ T cells (H) and the ratio of CD8+ T/CD4+ T cells (I). (J, K) Statistics of IFN-γ levels in CD8+ T (J) and CD4+ T cells (K) after stimulation with PMA/ionomycin and GolgiStop for 4 h. Data information: The data represented different numbers (n = 6–9) of biological replicates and were shown as the means ± SEMs. Two-tailed unpaired Student’s t-test was used in (A) (P < 0.0001), (G) (P < 0.0001), (H) (P = 0.2173) and (J) (P = 0.0092). Two-way ANOVA was used in (D) (Exact p values were reported on graphs). A two-tailed Mann‒Whitney U-test was used in (B) (P = 0.0022), C (P = 0.036), (E) (P = 0.0087) and (K) (P = 0.0456). *P < 0.05, **P < 0.01, ***P < 0.001, ****P < 0.0001, and NS not significant compared with the Rig-I+/+ group. Source data are available online for this figure.
Figure 4
Figure 4. Knocking out Rig-I enhanced the anti-tumour function of CD8+ T cells in a transfer experiment.
(A) Coculture of Rig-I knockout CD8+ T cells from OT-1 mice with MC38-OVA cells at different ratios to determine the specific killing efficiency. (B) Flowchart of the transfer of Rig-I+/+ and Rig-I−/− mouse spleen-derived CD8+ T cells for the treatment of MC38 tumours. (CE) Analysis of tumour growth curves, tumour sizes and tumour weights. (FI) Flow cytometry analysis of the absolute number of CD8+ T cells infiltrating tumours, the secretion of granzyme-B and the mean fluorescence intensity after stimulation with PMA/ionomycin and GolgiStop. Data information: The data represented different numbers (n = 4 or 6) of biological replicates and were shown as the means ± SEMs. Two-tailed unpaired Student’s test was used in (A) (Exact p values were reported on graphs), (C) (P = 0.0001), (E) (P = 0.0006), (F) (P = 0.0043), (H) (P = 0.0257) and (I) (P = 0.0248). *P < 0.05, **P < 0.01 and ***P < 0.001 compared with the vector or Rig-I+/+ group. Source data are available online for this figure.
Figure 5
Figure 5. The activation of CD8+ T cells induced the upregulation of Rig-I, inhibiting the PI3K/AKT/glycolysis signalling pathway to counteract its anti-tumour function.
(AE) Naïve CD8+ T cells were isolated from the spleens of wild-type mice, and after 72 h of costimulation with α-CD3/α-CD28, Rig-I expression was detected using Western blotting (A), and the expression of PD-1 (B), CD25 (C), CD107a (D) and IFN-γ (E) in CD8+ T cells was detected using flow cytometry after stimulation with PMA/ionomycin and GolgiStop. (F) After 72 h of costimulation with α-CD3/α-CD28, the expression of RIG-I, p-AKT (Thr308), AKT, and GAPDH in WT or KO Rig-I CD8+ T cells from mouse spleens was detected using Western blotting. (G) Validation of the efficiency of RIG-I knockout in human CD8+ T cells. (H) After knocking out RIG-I, the expression of RIG-I, p-AKT (Thr308), AKT, and β-Actin in human CD8+ T cells was detected using Western blotting. (IL) Naïve CD8+ T cells from Rig-I+/+, Rig-I−/ mouse spleens were treated with PI3K, AKT and glycolysis inhibitors after α-CD3/α-CD28 stimulation, and the proportions and mean fluorescence intensities of CD69 (IJ) and CD25 (KL) in CD8+ T cells were detected using flow cytometry. Data information: The data represented different numbers (n = 3) of biological replicates and were shown as the means ± SEMs. Two-tailed unpaired Student’s test was used in (C) (P = 0.0215), (D) (P = 0.0073) and (E) (P = 0.0433). One-way multiple comparisons ANOVA with Tukey’s correction test was used in (IL) (Exact p values were reported on graphs). *P < 0.05, **P < 0.01, ***P < 0.001, ****P < 0.0001 and NS not significant compared with the Rig-I+/+ or Ctrl group. Ctrl control, Wort wortmannin, Ly294 Ly294002, GSK GSK690693, 2-DG 2-deoxy-d-glucose. Source data are available online for this figure.
Figure 6
Figure 6. Adoptive cell therapy targeting RIG-I in EBV-specific CTL cells enhanced its anti-tumour function in the LCL model.
(A, B) Schematic of adoptive cell therapy targeting RIG-I in an EBV-specific CTL tumour model and growth curves of LCL tumours. (C, D) The size and weight of the LCL tumours. (EG) Flow cytometry analysis of the proportions of IFN-γ, granzyme-B and perforin in the control and RIG-I knockout groups after stimulation with PMA/ionomycin and GolgiStop. Data information: The data represented different numbers (n = 6) of biological replicates and were shown as the means ± SEMs. Two-tailed unpaired Student’s t-test was used in (B) (P < 0.0001), (D) (P = 0.0028), (E) (P = 0.0025), (F) (P = 0.0009). A two-tailed Mann‒Whitney U-test was used in (G) (P = 0.0043). **P < 0.01, ***P < 0.001 and ****P < 0.0001 compared with the control group. Source data are available online for this figure.
Figure 7
Figure 7. Rig-I knockout combined with PD-1 monoclonal antibodies can be used to treat solid tumours that are insensitive to PD-1 antibodies.
(A) Rig-I+/+ and Rig-I−/− mice were inoculated subcutaneously with MC38 cells and treated with a control immunoglobulin (cIg) or PD-1 monoclonal antibody, respectively. (B) Growth curve of MC38 tumours. (C) Anatomy of MC38 tumours. (D) Rig-I+/+ and Rig-I−/− mice were inoculated subcutaneously with B16F10 cells and treated with cIg or a PD-1 monoclonal antibody, respectively. (E) Growth curve of B16F10 tumours. (F) Anatomy of B16F10 tumours. (G, H) Survival curves of immunodeficient mice with MC38 (G) and B16F10 (H) tumours in which Rig-I+/+ or Rig-I−/ naïve CD8+ T cells were transferred alone, treated with anti-PD-1 antibodies alone, or treated with their combination. Data information: The data represented different numbers (n = 5 or 6 for B and E, n = 10 or 11 for G and H) of biological replicates, and were shown as the means ± SEMs. Two-way ANOVA was used in (B, E) (Exact p values were reported on graphs). The log-rank test was used in (G, H) (Exact p values were reported on graphs). *P < 0.05, **P < 0.01, ***P < 0.001, and NS not significant compared with the other groups. Source data are available online for this figure.
Figure EV1
Figure EV1. Screening single-cell sequencing data and verification of RIG-I upregulation in CD8+ T cells infiltrating the TME.
(A, B) Cluster analysis of cell populations in HNSCC and colon cancer, and expression levels of the DDX58 gene in each subpopulation. (C, D) Relative expression levels of DDX58, PDCD1, TIGIT, CTLA-4 and TOX-associated exhaustion genes in each subpopulation in HNSCC (C) and colon cancer (D). (E, F) Relative expression levels of DDX58, IFIH1, DHX58, IPS-1 and STING in HNSCC (E) and colon cancer (F) tissues. (G) Heatmap indicating the expression of selected gene sets in CD8+ T-cell subtypes infiltrating HCC and ICC. (H) Line chart showing the relative expression patterns of DDX58 in each CD8+ T-cell subtype. Source data are available online for this figure.
Figure EV2
Figure EV2. The upregulation of RIG-I expression was validated in CD8+ T cells infiltrating the TME.
(AC) Multiple immunohistochemistry and statistical analysis of human colon cancer specimens. White scale bar = 50 μm. (DF) The expression of Rig-I in CD8+ T cells from the spleens and tumours of different tumour-bearing mice was detected using Western blotting. (G) Correlation analysis of DDX58 expression with GZMB and IFNG expression. (H) The expression of granzyme-B secreted by infiltrating CD8+ T cells in the peritumor and tumour tissues of CRC by flow cytometry after stimulating with PMA/ionomycin and GolgiStop. Data information: The data represented different numbers (n = 5) of biological replicates and were shown as the means ± SEMs. Two-tailed unpaired Student’s test was used in (B) (P = 0.03), (C) (P = 0.0332). The Pearson correlation test was used in (G) (Exact p values were reported on graphs). The values of P and R are shown in the figure. Two-tailed paired Student’s test was used in (H) (P = 0.0003). *P < 0.05, ***P < 0.001, compared with the peritumoral group. Source data are available online for this figure.
Figure EV3
Figure EV3. Rig-I knockout enhanced the anti-tumour function.
(A) Survival curves of MC38 tumour-bearing Rig-I+/+ and Rig-I−/− mice. (B) Survival curves of MC38 tumour-bearing B-NDG mice after the adoptive transfer of Rig-I+/+ or Rig-I/ CD8+ T cells. (CE) Flow cytometry was used to detect the proportion (C, D) and mean fluorescence intensity (E) of CD8+ T cells that produced IFN-γ in the spleens of tumour-bearing Rig-I+/+ and Rig-I/− mice after stimulation with PMA/ionomycin and GolgiStop. Data information: The data represent different numbers (n = 7 for (A) and n = 9 for (B) of biological replicates. The data represent different numbers (n = 6 or 9 for D and E) of biological replicates and were shown as the means ± SEMs. The log-rank test was used in (A) (P = 0.0006) and (B) (P = 0.0016). A two-tailed Mann‒Whitney U-test was used in (D) (P = 0.0360). Two-tailed unpaired Student’s test was used in (E) (P = 0.0053). *P < 0.05, **P < 0.01 and ***P < 0.001 compared with the Rig-I+/+ group. Source data are available online for this figure.
Figure EV4
Figure EV4. Rig-I inhibited the PI3K/AKT/glycolysis signalling pathway to protect against the anti-tumour effects of CD8+ T cells.
(AF). Treatment of Rig-I+/+ and Rig-I−/− CD8+ T cells with α-CD3/α-CD28 followed by stimulation with inhibitors of PI3K, AKT and glycolysis. The proportions or mean fluorescence intensities of CD107a (A, B) and IFN-γ (CF) were detected using flow cytometry after stimulation with PMA/ionomycin and GolgiStop. Data information: The data represented different numbers (n = 3) of biological replicates and were shown as the means ± SEMs. One-way ANOVA with Tukey’s correction was used for multiple comparisons in (AF) (Exact p values were reported on graphs). *P < 0.05, **P < 0.01, ***P < 0.001, ****P < 0.001, and NS not significant compared with the Ctrl group. figure. Ctrl control, Wort wortmannin, Ly294 Ly294002, GSK GSK690693, 2-DG 2-deoxy-d-glucose. Source data are available online for this figure.

References

    1. Belk JA, Daniel B, Satpathy AT (2022) Epigenetic regulation of T cell exhaustion. Nat Immunol 23:848–860 - PMC - PubMed
    1. Chen H, Duan X, Deng X, Huang Y, Zhou X, Zhang S, Zhang X, Liu P, Yang C, Liu G et al (2023) EBV-upregulated B7-H3 inhibits NK cell-mediated antitumor function and contributes to nasopharyngeal carcinoma progression. Cancer Immunol Res 11:830–846 - PubMed
    1. Chiang JJ, Sparrer KMJ, van Gent M, Lässig C, Huang T, Osterrieder N, Hopfner KP, Gack MU (2018) Viral unmasking of cellular 5S rRNA pseudogene transcripts induces RIG-I-mediated immunity. Nat Immunol 19:53–62 - PMC - PubMed
    1. Cillo AR, Kürten CHL, Tabib T, Qi Z, Onkar S, Wang T, Liu A, Duvvuri U, Kim S, Soose RJ et al (2020) Immune landscape of viral- and carcinogen-driven head and neck cancer. Immunity 52:183–199.e9 - PMC - PubMed
    1. Curigliano G, Gelderblom H, Mach N, Doi T, Tai D, Forde PM, Sarantopoulos J, Bedard PL, Lin CC, Hodi FS et al (2021) Phase I/Ib clinical trial of sabatolimab, an anti-TIM-3 antibody, alone and in combination with spartalizumab, an anti-PD-1 antibody, in advanced solid tumors. Clin Cancer Res 27:3620–3629 - PubMed

MeSH terms

LinkOut - more resources