. 2024 Sep 25;25(1):247.
doi: 10.1186/s13059-024-03390-9.

A realistic benchmark for differential abundance testing and confounder adjustment in human microbiome studies

Affiliations

A realistic benchmark for differential abundance testing and confounder adjustment in human microbiome studies

Jakob Wirbel et al. Genome Biol. .

Abstract

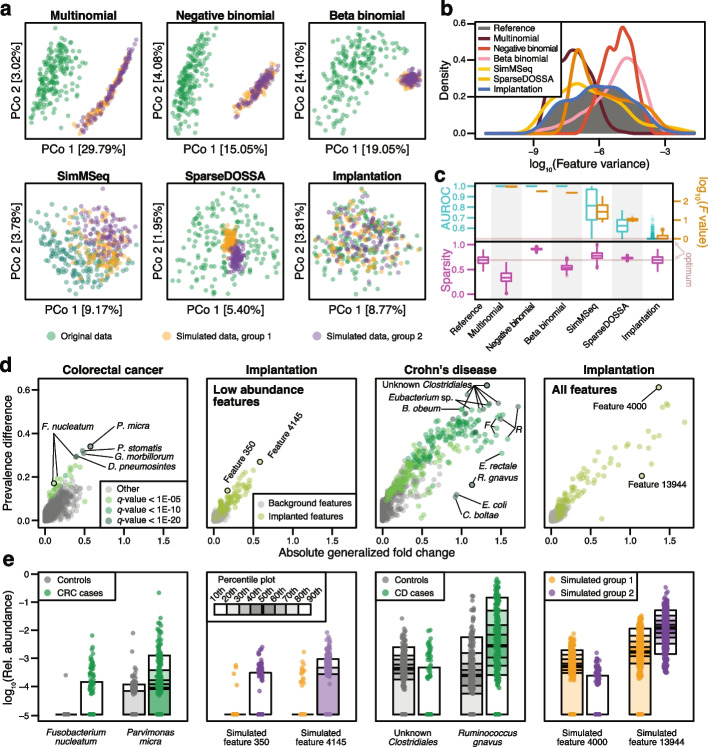
Background: In microbiome disease association studies, it is a fundamental task to test which microbes differ in their abundance between groups. Yet, consensus on suitable or optimal statistical methods for differential abundance testing is lacking, and it remains unexplored how these cope with confounding. Previous differential abundance benchmarks relying on simulated datasets did not quantitatively evaluate the similarity to real data, which undermines their recommendations.

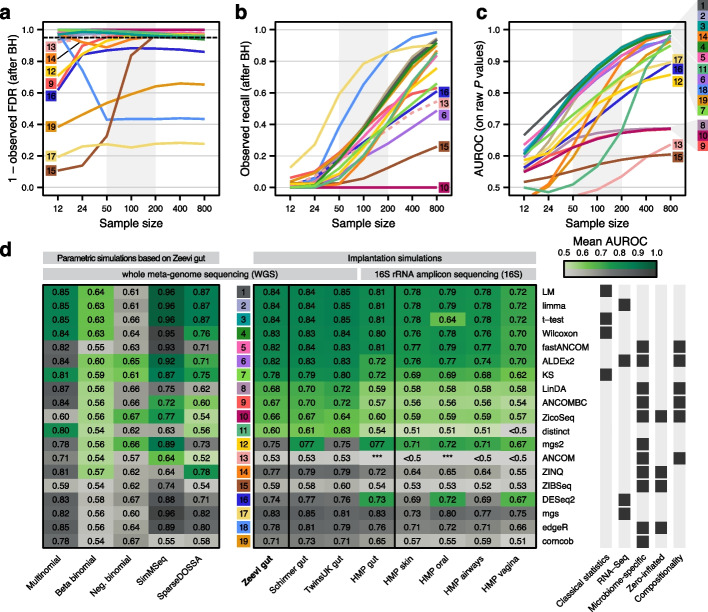
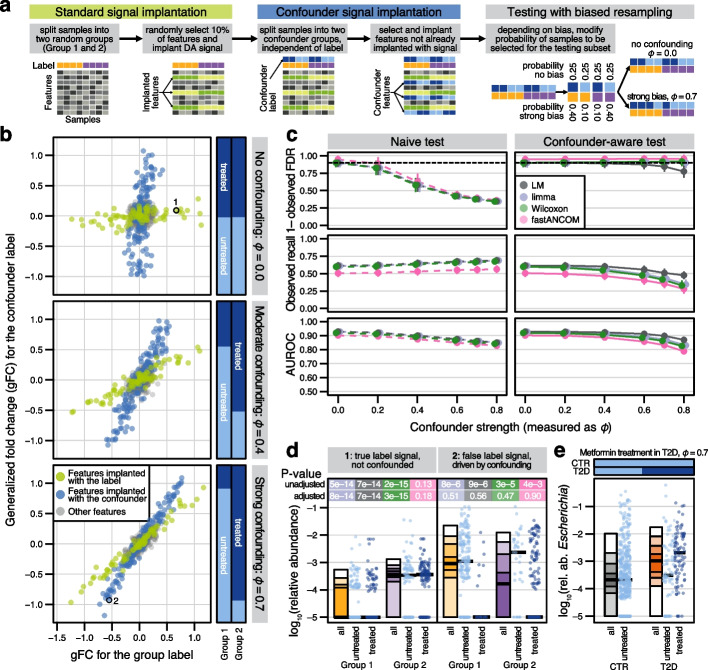
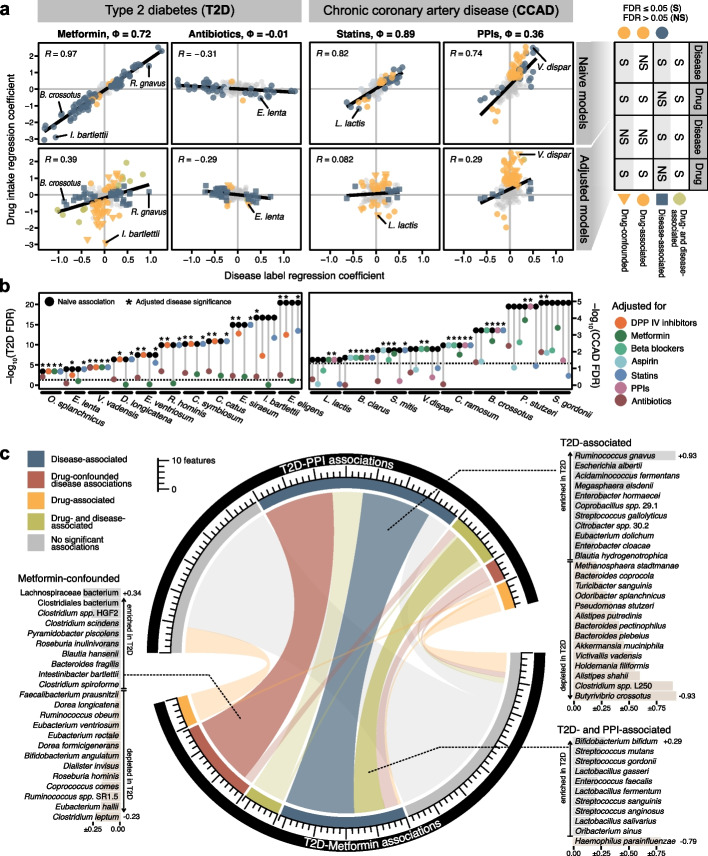
Results: Our simulation framework implants calibrated signals into real taxonomic profiles, including signals mimicking confounders. Using several whole meta-genome and 16S rRNA gene amplicon datasets, we validate that our simulated data resembles real data from disease association studies much more than in previous benchmarks. With extensively parametrized simulations, we benchmark the performance of nineteen differential abundance methods and further evaluate the best ones on confounded simulations. Only classic statistical methods (linear models, the Wilcoxon test, t-test), limma, and fastANCOM properly control false discoveries at relatively high sensitivity. When additionally considering confounders, these issues are exacerbated, but we find that adjusted differential abundance testing can effectively mitigate them. In a large cardiometabolic disease dataset, we showcase that failure to account for covariates such as medication causes spurious association in real-world applications.

Conclusions: Tight error control is critical for microbiome association studies. The unsatisfactory performance of many differential abundance methods and the persistent danger of unchecked confounding suggest these contribute to a lack of reproducibility among such studies. We have open-sourced our simulation and benchmarking software to foster a much-needed consolidation of statistical methodology for microbiome research.

Keywords: Benchmark; Confounding; Differential abundance; Metagenomics; Microbiome.


Conflict of interest statement

None of the authors declare any competing interests.

Figures

Fig. 1
Fig. 1
Signal implantation, but not parametric simulations, can reproduce key characteristics of metagenomic data and realistic disease effects. a Principal coordinate projections on log-Euclidean distances for real samples (from Zeevi et al. [33], which served as a baseline data set) and representative samples of data simulated in a case–control setting (groups 1 and 2) using different simulation frameworks or signal implantation. For each method, the results from a single repetition and a fixed effect size are shown (abundance scaling factor of 2 with an additional prevalence shift of 0.2 in our simulations, see the “Methods” section and Additional File 1: Fig. S4 for the complete parameter space). b Distributions of log-transformed feature variances shown for the real and simulated data from a. c The area under the receiver operating curve (AUROC) values from machine learning models (see the “Methods” section) to distinguish between real and simulated samples are shown across all simulated data sets in cyan. As complementary information, the log-transformed F values from PERMANOVA tests are shown in brown. Sparsity (fraction of taxa with zero abundance in a sample) is shown below in magenta. Boxes denote the interquartile range (IQR) across all values with the median as a thick black line and the whiskers extending up to the most extreme points within 1.5-fold IQR. d The absolute generalized fold change [6] and the absolute difference in prevalence across groups is shown for all features in colorectal cancer (CRC) and Crohn’s disease (CD). As a comparison, the same values are displayed for two data sets simulated using signal implantation (abundance scaling factor of 2, prevalence shift of 0.2), with implantations either into any feature or only low-abundance features (see the “Methods” section). Well-described disease-associated features are highlighted (F: Faecalibacterium, R: Ruminococcus) and selected bacterial taxa and simulated features are shown as percentile plot in e
Fig. 2
Fig. 2
Performance evaluation of differential abundance testing methods and simulation strategies. For a signal implantation simulation with a single, moderate effect size combination (abundance scaling factor of 2, prevalence shift of 0.2, all features eligible for implantation), a the mean observed FDR and b the mean observed recall (calculated after Benjamini-Hochberg (BH) correction of raw P values) are shown for all included DA test methods across different sample sizes (see the “Methods” section). Additionally, mean AUROC values for differentiating between implanted and background features (calculated from raw P values) are shown in c. The nominally expected value of a 5% FDR is indicated by a dotted black line in panel a. Since ANCOM does not return P values (see the “Methods” section), observed FDR and recall were based on the recommended cutoffs (without adjustment) and therefore highlighted by dashed lines. Marginal annotations of method ranks correspond to the ranking based on AUROC values, with methods without sufficient FDR control ranked last (see panel d). d The mean AUROC values across all effect sizes and repetitions for the sample sizes 50, 100, and 200 (shaded area in ac) are depicted in the heatmap for the different simulation strategies and baseline datasets, including non-gut human-associated microbiomes. The AUROC values of methods that exceeded a mean observed FDR of 10% in more than 10% of test settings (combination of effect and sample sizes) are shown in gray, whereas methods with sufficient FDR control are colored in shades of green. Methods with sufficient FDR control are ordered by their AUROC values on the Zeevi WGS gut dataset. For some simulations, the mean AUROC values were below 0.50 (indicated by < 0.5) or did not produce results in the allotted time (48 h for each combination of effect size, repetition, and sample size variation; indicated by stars)
Fig. 3
Fig. 3
Loss of precision and recall under confounding can be alleviated by statistical adjustment. a Using a single dataset, DA features were independently implanted into a small proportion of taxa for both a main group label (as described above) and for an independent binary (confounder) label, imitating, e.g., disease and medication status labels, respectively. Subsets for DA testing were generated using a parameterized resampling technique such that the degree of association (measured by ϕ) between these two variables could be modified (i.e., deliberately biased). b Generalized fold change (gFC) calculated for the label is contrasted to the gFC calculated for differences between confounder values across all bacterial taxa (abundance scaling factor of 2, prevalence shift of 0.2, all features eligible for implantation, a single representative repeat shown). Bars at the right visualize the confounder strength by showing the proportion of confounder-positive samples in each group (with ϕ = 0 serving as unconfounded control). Main implanted features are highlighted in green and features implanted for the confounder label are in blue. c Mean observed FDR, observed recall (both calculated after BH-correction), and AUROC (on raw P values) for sample size 200 and the same effect sizes as shown in a) were computed for tested DA methods, using unadjusted and confounder-adjusted test configurations. Error bars indicate standard deviation around the mean for all repeats. d Simulated (log10 relative) abundances plotted by main and confounder labels (see Fig. 1 for definition of abundance quantiles), with both unadjusted and confounder-adjusted significance shown at the top, colored as in c. Escherichia abundance appears naively associated with type 2 diabetes, yet is driven by metformin intake in a subset of diabetics (reproduced from Forslund et al.8)
Fig. 4
Fig. 4
Linear models are capable of disentangling drug- and disease-associated microbial features. a Regression coefficients from a subset of disease-drug combinations comparing naive linear models to adjusted mixed-effect models for all bacterial taxa. Adjusted models included a second term (either drug intake or disease status for the x- and y-axes, respectively) as a random effect, which diminished the strong linear dependence between naive model coefficients (shown). When the significance of each term was compared between the naive and adjusted models (see the “Methods” section) drug-specific or confounded effects were revealed in some features. b Exemplary subset of features displaying either the largest number of significant disease associations across different drug-adjusted models or the largest reductions in disease coefficient significance upon adjustment (i.e., most confounded). c Comparison of feature classifications (see the “Methods” section) from the metformin- and PPI-adjusted disease association models across all bacterial taxa. Integrating information across models restricts disease associations to a more robust subset and reveals drug-confounded associations. Adjusted T2D regression coefficients are shown in light gray or light brown bars behind species names (indicating enrichment in T2D or control group, respectively)

Similar articles

Cited by

References

    1. Human Microbiome Project Consortium. Structure, function and diversity of the healthy human microbiome. Nature. 2012;486:207–14. - PMC - PubMed
    1. Voigt AY, et al. Temporal and technical variability of human gut metagenomes. Genome Biol. 2015;16:73. - PMC - PubMed
    1. Gevers D, et al. The treatment-naive microbiome in new-onset Crohn’s disease. Cell Host Microbe. 2014;15:382–92. - PMC - PubMed
    1. Franzosa EA, et al. Gut microbiome structure and metabolic activity in inflammatory bowel disease. Nat Microbiol. 2019;4:293–305. - PMC - PubMed
    1. Thomas AM, et al. Metagenomic analysis of colorectal cancer datasets identifies cross-cohort microbial diagnostic signatures and a link with choline degradation. Nat Med. 2019;25:667–78. - PMC - PubMed

Substances

LinkOut - more resources