Comparative Study
. 2025 Jan 9;6(1):100355.
doi: 10.1016/j.xhgg.2024.100355. Epub 2024 Sep 25.

Comparison of methods for building polygenic scores for diverse populations

Affiliations
Comparative Study

Comparison of methods for building polygenic scores for diverse populations

Sophia Gunn et al. HGG Adv. .

Abstract

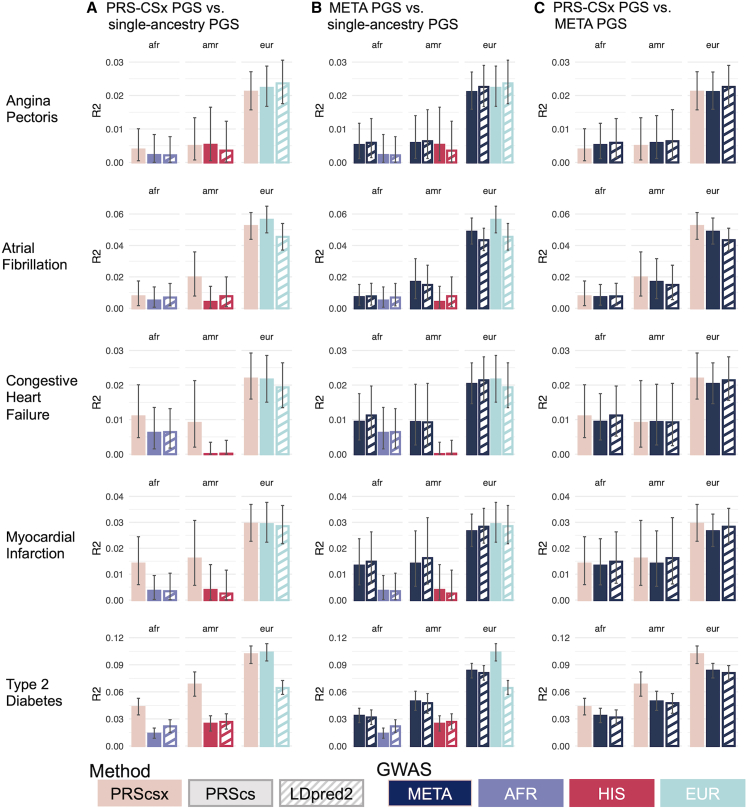
Polygenic scores (PGSs) are a promising tool for estimating individual-level genetic risk of disease based on the results of genome-wide association studies (GWASs). However, their promise has yet to be fully realized because most currently available PGSs were built with genetic data from predominantly European-ancestry populations, and PGS performance declines when scores are applied to target populations different from the populations from which they were derived. Thus, there is a great need to improve PGS performance in currently under-studied populations. In this work we leverage data from two large and diverse cohorts the Million Veterans Program (MVP) and All of Us (AoU), providing us the unique opportunity to compare methods for building PGSs for multi-ancestry populations across multiple traits. We build PGSs for five continuous traits and five binary traits using both multi-ancestry and single-ancestry approaches with popular Bayesian PGS methods and both MVP META GWAS results and population-specific GWAS results from the respective African, European, and Hispanic MVP populations. We evaluate these scores in three AoU populations genetically similar to the respective African, Admixed American, and European 1000 Genomes Project superpopulations. Using correlation-based tests, we make formal comparisons of the PGS performance across the multiple AoU populations. We conclude that approaches that combine GWAS data from multiple populations produce PGSs that perform better than approaches that utilize smaller single-population GWAS results matched to the target population, and specifically that multi-ancestry scores built with PRS-CSx outperform the other approaches in the three AoU populations.

Keywords: diverse populations; polygenic scores; underrepresented populations.


Conflict of interest statement

Declaration of interests The authors declare no competing interests.

Figures

Figure 1
Figure 1
Schematic of PGS development For each trait, we developed multi-ancestry scores and ancestry-specific scores. We built multi-ancestry scores with (1) the multi-GWAS method PRS-CSx and ancestry-specific GWAS results and matched LD reference panels and (2) the single-GWAS methods LDpred2 and PRS-CS with combined multi-ancestry META GWAS results and each of the three LD reference panels matching the populations within the META GWAS results. Among traits for which ASN GWAS HARE results were available, ASN GWAS results were also included in the PRS-CSx score generation (and were included in the MVP META GWAS). We built the ancestry-specific scores using the single-GWAS methods LDpred2 and PRS-CS with ancestry-specific GWASs and matched LD reference panels. We then computed all 13 scores in 3 populations in the AoU cohort similar to the HGDP-1KG African reference panel (afr), HGDP-1KG admixed American reference panel (amr), and HGDP-1KG European reference panel (eur).
Figure 2
Figure 2
Comparison of PGS methods for continuous traits Scores were evaluated in AoU 1KG genetic-similarity groups, using R2 adjusting for first 20 population-specific PCs, age and sex. Error bars reflect 95% confidence intervals. (A) Comparison of PRS-CSx PGSs and single-ancestry PGSs, where pink bars represent performance of PRS-CSx PGSs and purple, red, and light blue bars represent performance of single-ancestry PGSs, derived using African, Hispanic, and European GWASs, respectively. Solid bars indicate PGSs built with PRS-CS and dashed bars indicate PGSs built with LDpred2. (B) Comparison of META PGSs and single-ancestry PGSs by trait and 1KG similarity group where the navy bars are the average of the META PGSs across LD panels built with either PRS-CS (solid bar) or LDpred2 (dashed bar) and the single-ancestry PGSs are as described previously. (C) Comparison of PRS-CSx PGSs and META PGSs where pink bars represent performance of PRS-CSx PGSs and navy bars represent the average performance of the META PGSs across LD panels using either PRS-CS (solid bar) or LDpred2 (dashed bar).
Figure 3
Figure 3
Comparison of PGS methods for binary traits Scores for binary traits were evaluated in AoU 1KG genetic-similarity groups, using R2 transformed to the liability scale adjusted for the first 20 population-specific PCs, age and sex. Error bars reflect 95% confidence intervals. (A) Comparison of PRS-CSx PGSs and single-ancestry PGSs, where pink bars represent performance of PRS-CSx PGSs and purple, red, and light blue bars represent performance of single-ancestry PGSs, derived using African, Hispanic, and European GWASs, respectively. Solid bars indicate PGSs built with PRS-CS and dashed bars indicate PGSs built with LDpred2. (B) Comparison of META PGSs and single-ancestry PGSs by trait and 1KG similarity group where the navy bars are the average of the META PGSs across LD panels built with either PRS-CS (solid bar) or LDpred2 (dashed bar) and the single-ancestry PGSs are as described previously. (C) Comparison of PRS-CSx PGSs and META PGSs where pink bars represent performance of PRS-CSx PGSs and navy bars represent the average performance of the META PGSs across LD panels using either PRS-CS (solid bar) or LDpred2 (dashed bar).

References

    1. Khera A.V., Chaffin M., Aragam K.G., Haas M.E., Roselli C., Choi S.H., Natarajan P., Lander E.S., Lubitz S.A., Ellinor P.T., Kathiresan S. Genome-wide polygenic scores for common diseases identify individuals with risk equivalent to monogenic mutations. Nat. Genet. 2018;50:1219–1224. doi: 10.1038/s41588-018-0183-z. - DOI - PMC - PubMed
    1. Choi S.W., Mak T.S.H., O’Reilly P.F. Tutorial: a guide to performing polygenic risk score analyses. Nat. Protoc. 2020;15:2759–2772. doi: 10.1038/s41596-020-0353-1. - DOI - PMC - PubMed
    1. Martin A.R., Gignoux C.R., Walters R.K., Wojcik G.L., Neale B.M., Gravel S., Daly M.J., Bustamante C.D., Kenny E.E. Human Demographic History Impacts Genetic Risk Prediction across Diverse Populations. Am. J. Hum. Genet. 2017;100:635–649. doi: 10.1016/j.ajhg.2017.03.004. - DOI - PMC - PubMed
    1. Lawson D.J., Davies N.M., Haworth S., Ashraf B., Howe L., Crawford A., Hemani G., Davey Smith G., Timpson N.J. Is population structure in the genetic biobank era irrelevant, a challenge, or an opportunity? Hum. Genet. 2020;139:23–41. doi: 10.1007/s00439-019-02014-8. - DOI - PMC - PubMed
    1. Martin A.R., Kanai M., Kamatani Y., Okada Y., Neale B.M., Daly M.J. Clinical use of current polygenic risk scores may exacerbate health disparities. Nat. Genet. 2019;51:584–591. doi: 10.1038/s41588-019-0379-x. - DOI - PMC - PubMed

Publication types

MeSH terms

LinkOut - more resources