. 2024 Nov;23(11):e14299.
doi: 10.1111/acel.14299. Epub 2024 Sep 25.

Tissue-specific functions of MSCs are linked to homeostatic muscle maintenance and alter with aging

Affiliations

Tissue-specific functions of MSCs are linked to homeostatic muscle maintenance and alter with aging

Tamaki Kurosawa et al. Aging Cell. 2024 Nov.

Abstract

Mesenchymal stromal cells (MSCs), also known as fibro-adipogenic progenitors, play a critical role in muscle maintenance and sarcopenia development. Although analogous MSCs are present in various tissues, recent single-cell RNA-seq studies have revealed the inter-tissue heterogeneity of MSCs. However, the functional significance of MSC heterogeneity and its role in aging remain unclear. Here, we investigated the properties of MSCs and their age-related changes in seven mouse tissues through histological, cell culture, and genetic examinations. The tissue of origin had a greater impact on the MSC transcriptome than aging. By first analyzing age-related changes, we found that Kera is exclusively expressed in muscle MSCs and significantly down-regulated by aging. Kera knockout mice recapitulated some sarcopenic phenotypes including reduced muscle mass and specific force, revealing the functional importance of Kera in the maintenance of muscle youth. These results suggest that MSCs have tissue-specific supportive functions and that deterioration in these functions may trigger tissue aging.

Keywords: heterogeneity; keratocan; mesenchymal stromal cells; platelet‐derived growth factor receptor‐alpha; sarcopenia.


Conflict of interest statement

The authors declare no competing financial interests.

Figures
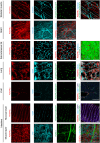
FIGURE 1
FIGURE 1
In vivo visualization of MSCs in various tissues of young mice. Fluorescence immunostaining images for PDGFRα+ cells in seven tissues of 3‐month‐old WT or PDGFRαH2BeGFP mice. Skeletal muscles (EDL: extensor digitorum longus), the heart, and subcutaneous fat were stained for PDGFRα (red) and Isolectin IB4 (light blue). Subcutaneous fat was stained with Lipidye II (green). The lungs, liver, and intestinal mucosal layer were stained for PDGFRα (red) and CD31 (light blue). The liver and intestinal mucosal layer were stained with DAPI (bule). The intestinal muscle layer was stained for PDGFRα (red), c‐kit (light blue), and PGP9.5 (green). Samples from PDGFRαH2BeGFP mice have nuclei of PDGFRα+ cells labeled with GFP (green). 3D images were obtained for whole‐mount staining of the skeletal muscles, heart, subcutaneous fat, lungs, and intestinal muscle layers. 2D images of frozen sections of the liver and intestinal mucosal layers were taken. Scale bar = 100 μm.
FIGURE 2
FIGURE 2
In vivo visualization of MSCs in various tissues of aged mice. Fluorescence immunostaining images for PDGFRα+ cells in seven tissue types of 28‐month‐old mice. The skeletal muscles, heart, and subcutaneous fat were stained for PDGFRα (red) and Isolectin IB4 (light blue). The subcutaneous fat was stained with BODIPY (green). The lungs, liver, and intestinal mucosal layer were stained for PDGFRα (red) and CD31 (light blue). The skeletal muscle, heart, lung, liver, and intestinal mucosal layers were stained with DAPI (blue). The intestinal muscle layer was stained for PDGFRα (red), c‐kit (light blue), and PGP9.5 (green). 3D images were obtained for whole‐mount staining of the skeletal muscle (EDL: Extensor digitorum longus), heart, subcutaneous fat, lungs, and intestinal muscle layers. 2D images of frozen sections of the liver and intestinal mucosal layers were taken. Yellow arrows point to areas with low densities of PDGFRα+ MSCs. White arrows point to areas with high densities of PDGFRα+ MSCs. Scale bar = 100 μm. [Correction added on 30 September 2024 after first online publication: Figure 1 had been inadvertently duplicated as Figure 2, and thus, Figure 2 has been corrected]
FIGURE 3
FIGURE 3
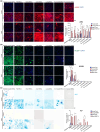
MSCs show varying differentiation potential depending on their tissue of origin. MSCs were sorted from seven tissues of young (3‐month‐old) and aged (28‐month‐old) mice to differentiate into fibrogenic cells, adipocytes, and osteoblasts in vitro. (a) Immunostaining images of MSCs for αSMA (red) and stained with DAPI (blue). MSCs were cultured with or without TGF‐β1. (b) BODIPY (green) and DAPI (blue) staining images of MSCs. (c) Alkaline phosphatase (ALP) (blue) staining images of MSCs. Data represent individual data points and the means; n = 5 areas were quantified for each group. Differences between the two groups were analyzed using a two‐sided unpaired t test. Differences between more than two groups were analyzed using one‐way analysis of variance (ANOVA) or Welch ANOVA tests when variances between the groups were not equal. **p < 0.01, *p < 0.05. Scale bar = 100 μm.
FIGURE 4
FIGURE 4
Transcriptome analysis of MSCs reveals the tissue‐specific gene signature. MSCs were sorted from seven tissues of young (3‐month‐old) and aged (28‐month‐old) mice and analyzed by bulk RNA‐seq. (a) PCA analysis for RNA‐seq of MSCs from seven tissue types of young and aged mice. n = 5 mice for young skeletal muscle MSCs; n = 5 for aged skeletal muscle MSCs; n = 3 for young heart MSCs; n = 3 for aged heart MSCs; n = 3 for fat MSCs; n = 3 for aged fat MSCs; n = 3 for young liver MSCs; n = 5 for aged liver MSCs; n = 3 for young lung MSCs; n = 5 for aged lung MSCs; n = 3 for young intestinal muscle layer MSCs; n = 3 for aged intestinal muscle layer MSCs; n = 5 for young intestinal mucosal layer MSCs; and n = 5 for aged intestinal mucosal layer MSCs. The dashed circles represent parental clusters (upper column) and subclusters separated by tissue of origin (lower column). (b) This heat map compares gene expression levels relative to each tissue MSC of the young (Y) and aged (A) groups to visualize tissue specificity of MSCs. Genes with TPM values >150 and expression ratios >1 in log2FC to those in MSCs from other tissues' MSCs were selected as genes that refract MSC tissue specificity. The color scale value is based on Z‐score. (c) GO terms enriched in the differentially expressed genes (DEGs) in MSCs from seven tissue types of young and aged mice. The genes with a variation of BaseMean >100, log2FC >1, and adj. p < 0.05 were selected as DEGs.
FIGURE 5
FIGURE 5
Kera is exclusively expressed in muscle MSCs and is significantly reduced by aging. (a) A volcano plot of DEGs in young and aged muscle MSCs. n = 5 mice for both young and aged groups. The genes with variations of BaseMean >100, log2FC >1, and adj. p < 0.05 were selected as DEGs. The red and blue dots represent the genes whose expression is significantly downregulated and upregulated, respectively, with aging. (b) This heat map shows the expression levels of the 10 genes with the highest TPM in young muscle MSCs among genes that significantly decreased with the aging of muscle MSCs in each tissue MSC of the young (Y) and aged (A) groups. The genes with variations of log2FC >2.5 and adj. p < 0.05 were selected as DEGs. The samples shown in Figure 4 were used for this analysis. (c) The quantified expression levels of Kera in sorted cells. MSCs: PDGFRα‐positive MSCs, CD31+ CD45+: CD31, or CD45‐positive cells, SC: Satellite cells. Myotubes were differentiated from sorted satellite cells. n = 4 mice. (d) The quantified expression levels of Kera in the tibialis anterior (TA) muscles of young or aged mice. n = 9 mice for both young and aged groups. The data represent individual data points and the means. Data were analyzed using a two‐sided unpaired t test (c, d). (e) In situ hybridization on muscle sections from 10 weeks of PDGFRαH2BeGFP mice (young) and 24‐month‐old WT mice (aged) with Kera probe (red) followed with immunostaining to THBS4 (white) and GFP (green) and stained with DAPI (blue). Images of serial sections stained with PDGFRα antibody (magenta) followed with H&E staining are shown in the same row to the right side of the dashed lines. Yellow arrows indicate Kera+/PDGFRαH2BeGFP+ nuclei. White arrows indicate PDGFRα+ cells. QF: Quadriceps femoris, EDL: Extensor digitorum longus. Scale bar = 100 μm.
FIGURE 6
FIGURE 6
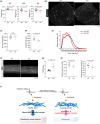
Kera KO mice show the loss of muscle mass and strength even at a young age. (a). The muscle weight of the male Kera KO or wildtype (WT) littermates was measured at 10 weeks of age. GC: Gastrocnemius, QF: Quadriceps femoris, SOL: Soleus. n = 10 (Kera KO) and n = 11 (WT). (b). QF cross sections stained for laminin α2. (c–e). The number of myofibers (c), the myofiber cross‐sectional area (CSA) (d), and myofiber CSA distribution (e) in QF muscles; n = 5 (Kera KO) and n = 6 (WT). (f). Second harmonic generation (SHG) images for extensor digitorum longus tendons of the Kera KO or WT littermates. (g). Analysis of the full width at half maximum (FWHM) of the SHG angular spectrum; n = 12 mice per group. (h). Measurement of the maximum and specific tetanic force of the EDLs; n = 5 (Kera KO) and n = 6 (WT). The data represent individual data points and the means. Data were analyzed using a two‐sided unpaired t test (a, c, d, g, h). Scale bar = 300 μm for B and 50 μm for F. (i). A model in which muscle MSCs maintain youthfulness of skeletal muscles by specifically producing keratocan. PDGFRα+ MSCs in young muscle specifically produce keratocan and contribute to the maintenance of muscle integrity by forming a healthy ECM. Aging alters the properties specific to muscle MSCs, thereby reducing keratocan production to disrupt the ECM structure. Age‐related alterations in muscle MSC‐specific functions can lead to sarcopenia.

References

    1. Azizi, E. , Deslauriers, A. R. , Holt, N. C. , & Eaton, C. E. (2017). Resistance to radial expansion limits muscle strain and work. Biomechanics and Modeling in Mechanobiology, 16(5), 1633–1643. 10.1007/s10237-017-0909-3 - DOI - PMC - PubMed
    1. Babicki, S. , Arndt, D. , Marcu, A. , Liang, Y. , Grant, J. R. , Maciejewski, A. , & Wishart, D. S. (2016). Heatmapper: Web‐enabled heat mapping for all. Nucleic Acids Research, 44(W1), W147–W153. 10.1093/nar/gkw419 - DOI - PMC - PubMed
    1. Benabid, A. , & Peduto, L. (2020). Mesenchymal perivascular cells in immunity and disease. Current Opinion in Immunology, 64, 50–55. 10.1016/j.coi.2020.03.009 - DOI - PMC - PubMed
    1. Buechler, M. B. , Pradhan, R. N. , Krishnamurty, A. T. , Cox, C. , Calviello, A. K. , Wang, A. W. , Yang, Y. A. , Tam, L. , Caothien, R. , Roose‐Girma, M. , Modrusan, Z. , Arron, J. R. , Bourgon, R. , Müller, S. , & Turley, S. J. (2021). Cross‐tissue organization of the fibroblast lineage. Nature, 593(7860), 575–579. 10.1038/s41586-021-03549-5 - DOI - PubMed
    1. Caplan, A. I. (2017). Mesenchymal stem cells: Time to change the name! Stem Cells Translational Medicine, 6(6), 1445–1451. 10.1002/sctm.17-0051 - DOI - PMC - PubMed

LinkOut - more resources