

High-dimensional proteomic analysis for pathophysiological classification of traumatic brain injury
- PMID: 39323289
- PMCID: PMC11884744
- DOI: 10.1093/brain/awae305
High-dimensional proteomic analysis for pathophysiological classification of traumatic brain injury
Abstract
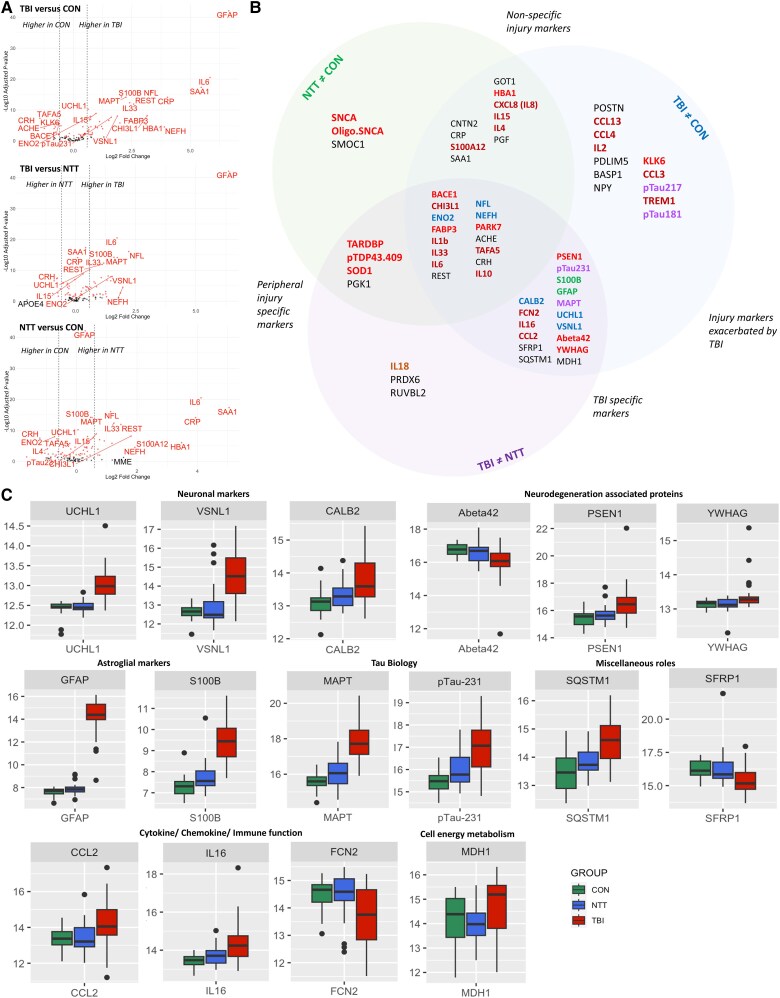
Pathophysiology and outcomes after traumatic brain injury (TBI) are complex and heterogeneous. Current classifications are uninformative about pathophysiology. Proteomic approaches with fluid-based biomarkers are ideal for exploring complex disease mechanisms, because they enable sensitive assessment of an expansive range of processes potentially relevant to TBI pathophysiology. We used novel high-dimensional, multiplex proteomic assays to assess altered plasma protein expression in acute TBI. We analysed samples from 88 participants from the BIO-AX-TBI cohort [n = 38 moderate-severe TBI (Mayo Criteria), n = 22 non-TBI trauma and n = 28 non-injured controls] on two platforms: Alamar NULISA™ CNS Diseases and OLINK® Target 96 Inflammation. Patient participants were enrolled after hospital admission, and samples were taken at a single time point ≤10 days post-injury. Participants also had neurofilament light, GFAP, total tau, UCH-L1 (all Simoa®) and S100B (Millipore) data. The Alamar panel assesses 120 proteins, most of which were previously unexplored in TBI, plus proteins with known TBI specificity, such as GFAP. A subset (n = 29 TBI and n = 24 non-injured controls) also had subacute (10 days to 6 weeks post-injury) 3 T MRI measures of lesion volume and white matter injury (fractional anisotropy). Differential expression analysis identified 16 proteins with TBI-specific significantly different plasma expression. These were neuronal markers (calbindin 2, UCH-L1 and visinin-like protein 1), astroglial markers (S100B and GFAP), neurodegenerative disease proteins (total tau, pTau231, PSEN1, amyloid-beta-42 and 14-3-3γ), inflammatory cytokines (IL16, CCL2 and ficolin 2) and cell signalling- (SFRP1), cell metabolism- (MDH1) and autophagy-related (sequestome 1) proteins. Acute plasma levels of UCH-L1, PSEN1, total tau and pTau231 were correlated with subacute lesion volume. Sequestome 1 was positively correlated with white matter fractional anisotropy, whereas CCL2 was inversely correlated. Neuronal, astroglial, tau and neurodegenerative proteins were correlated with each other, IL16, MDH1 and sequestome 1. Exploratory clustering (k means) by acute protein expression identified three TBI subgroups that differed in injury patterns, but not in age or outcome. One TBI cluster had significantly lower white matter fractional anisotropy than control-predominant clusters but had significantly lower lesion subacute lesion volumes than another TBI cluster. Proteins that overlapped on two platforms had excellent (r > 0.8) correlations between values. We identified TBI-specific changes in acute plasma levels of proteins involved in neurodegenerative disease, inflammatory and cellular processes. These changes were related to patterns of injury, thus demonstrating that processes previously studied only in animal models are also relevant in human TBI pathophysiology. Our study highlights how proteomic approaches might improve classification and understanding of TBI pathophysiology, with implications for prognostication and treatment development.
Keywords: biomarker; inflammation; neurodegeneration; neuroimaging.
© The Author(s) 2024. Published by Oxford University Press on behalf of the Guarantors of Brain.
Conflict of interest statement
Alamar Biosciences provided complimentary testing of samples but were not involved in the analysis or interpretation of results or write-up of the manuscript. H.Z. has served on scientific advisory boards and/or as a consultant for Abbvie, Acumen, Alector, Alzinova, ALZPath, Amylyx, Annexon, Apellis, Artery Therapeutics, AZTherapies, Cognito Therapeutics, CogRx, Denali, Eisai, Merry Life, Nervgen, Novo Nordisk, Optoceutics, Passage Bio, Pinteon Therapeutics, Prothena, Red Abbey Labs, reMYND, Roche, Samumed, Siemens Healthineers, Triplet Therapeutics and Wave, has given lectures in symposia sponsored by Alzecure, Biogen, Cellectricon, Fujirebio, Lilly, Novo Nordisk and Roche, and is a co-founder of Brain Biomarker Solutions in Gothenburg AB (BBS), which is a part of the GU Ventures Incubator Program (outside submitted work). D.J.S. has received an honorarium from the Rugby Football Union for participation in an expert concussion panel. D.J.S. receives payment by Rugby Football Union, The Football Association and Premiership Rugby for private clinical services at the Institute of Sports Exercise and Health. There are no other conflicts of interest.
Figures


References
-
- Graham NSN, Zimmerman KA, Moro F, et al. Axonal marker neurofilament light predicts long-term outcomes and progressive neurodegeneration after traumatic brain injury. Sci Transl Med. 2021;13:eabg9922. - PubMed
-
- Kumar RG, Boles JA, Wagner AK. Chronic inflammation after severe traumatic brain injury: Characterization and associations with outcome at 6 and 12 months postinjury. J Head Trauma Rehabil. 2015;30:369–381. - PubMed
-
- Peters AJ, Schnell E, Saugstad JA, Treggiari MM. Longitudinal course of traumatic brain injury biomarkers for the prediction of clinical outcomes: A review. J Neurotrauma. 2021;38:2490–2501. - PubMed
MeSH terms
Substances
Grants and funding
- ERA-NET NEURON Cofund
- The UK Dementia Research Institute
- NIHR
- AMS_/Academy of Medical Sciences/United Kingdom
- 2023-00356/Swedish Research Council
- European Union's Horizon Europe research and innovation programme
- 201809-2016862/Alzheimer Drug Discovery Foundation
- AD Strategic Fund
- ADSF-21-831376-C/ALZ/Alzheimer's Association/United States
- Cure Alzheimer's Fund
- Olav Thon Foundation
- Erling-Persson Family Foundation
- FO2022-0270/Stiftelsen för Gamla Tjänarinnor, Hjärnfonden, Sweden
- National Institute for Health and Care Research University College London Hospitals Biomedical Research Centre
- SFI17/FRL/4860/SFI_/Science Foundation Ireland/Ireland
LinkOut - more resources
Full Text Sources
Medical
Research Materials
Miscellaneous
