. 2024 Oct 3;15(39):10039-10045.
doi: 10.1021/acs.jpclett.4c02296. Epub 2024 Sep 26.

Structure and Dynamics of ATP and the ATP-Zn2+ Complex in Solution

Affiliations

Structure and Dynamics of ATP and the ATP-Zn2+ Complex in Solution

Emma Rossi et al. J Phys Chem Lett. .

Abstract

Despite the crucial role of ATP in life and artificial life-like applications, fundamental aspects relevant to its function, such as its conformational properties and its interaction with water and ions, remain unclear. Here, by integrating linear and two-dimensional infrared spectroscopy with ab initio molecular dynamics, we provide a detailed characterization of the vibrational spectra of the phosphate groups in ATP and in its complex with Zn2+ in water. Our study highlights the role of conformational disorder and solvation dynamics, beyond the harmonic normal-mode analysis, and reveals a complex scenario in which electronic and environmental effects tune the coupling between phosphate vibrations. We identify βγ-bidentate and αβγ-tridentate modes as the preferential coordination modes of Zn2+, as was proposed in the literature for Mg2+, although this conclusion is reached by a different spectral interpretation.


Conflict of interest statement

The authors declare no competing financial interest.

Figures
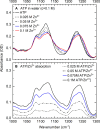
Figure 1
Figure 1
(A) Linear infrared absorption spectra of the ATP–Zn2+ complex for 0.1 M ATP and Zn2+ concentrations ranging from 0.025 to 0.1 M (sample thickness of 25 μm). (B) Weighted differential absorption, obtained by subtracting the weighted spectrum of hydrated ATP from the total absorption spectrum. Assuming that all Zn2+ ions are bound to ATP, the different curves represent the absorption of ATP–Zn2+ complexes at various Zn2+ concentrations of ≤0.1 M (black line).
Figure 2
Figure 2
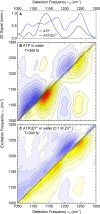
(A) Cuts of the 2D-IR spectra of ATP (black line) and the ATP–Zn2+ complex (blue line) in water along the frequency diagonal ν1 = ν3. The normalized absorptive 2D-IR signal is plotted as a function of detection frequency ν3. (B and C) Two-dimensional infrared (2D-IR) spectra of ATP and the ATP–Zn2+ complex in water. The absorptive 2D-IR signal is plotted as a function of excitation frequency ν1 and detection frequency ν3. Positive signals are shown as yellow–red contours, and negative signals as blue contours. The signal change between neighboring contour lines is 6.5%. The spectra were recorded at a waiting time T of 300 fs.
Figure 3
Figure 3
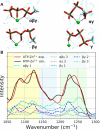
(A) Snapshot of conformers 1, 2, 4, and 5 of MTP (red for oxygen, brown for phosphorus, light blue for carbon, and white for hydrogen) in water (blue lines in the background) from the AIMD simulation. Labels of phosphate groups shown for MTP 1. (B) Experimental IR spectrum of a 0.1 M water solution of ATP (red) and simulated spectrum of MTP (black), as a function of frequency. Spectra of single MTP conformers (dashed), with intensities weighted by their specific contribution to the calculated spectrum (1, green, 12.97%; 2, violet, 13.75%; 4, light blue, 39.83%; 5, ocra, 33.45%; root-mean-square deviation of 0.0007). The shaded areas correspond to formula image and formula image (yellow), formula image (light blue), and formula image (green).
Figure 4
Figure 4
VDOS of (PO2)α (red), (PO2)β (blue), and (PO3)γ (green) for conformers (A) 1 and (B) 4 of MTP (see the Supporting Information for details about the calculation of the splittings).
Figure 5
Figure 5
(A) Snapshot of αβγ, αγ, βγ, and γ coordination modes of the MTP–Zn2+ complex in water from MD simulations (MTP and water as in Figure 3A, Zn2+ in green). (B) Experimental IR spectrum of a 0.1 M water solution of the ATP–Zn2+ complex (red) and calculated spectrum of the MTP–Zn2+ complex (black). Spectra of single conformers of MTP–Zn2+ complexes in different coordination modes (dashed), weighted according to their contribution to the calculated spectrum (αβγ1, lime, 28.88%; αβγ3, olive green, 10.00%; αγ3, pink, 11.35%; βγ1, light blue, 20.71%; βγ2, blue, 19.95%; βγ3, cyan, 9.11%; root-mean-square deviation of 0.0003). Shaded areas colored as in Figure 3B.

Similar articles

References

    1. Patel A.; Malinovska L.; Saha S.; Wang J.; Alberti S.; Krishnan Y.; Hyman A. A. ATP as a Biological Hydrotrope. Science 2017, 356, 753–756. 10.1126/science.aaf6846. - DOI - PubMed
    1. Kang J.; Lim L.; Song J. ATP Enhances at Low Concentrations but Dissolves at High Concentrations Liquid-Liquid Phase Separation (LLPS) of ALS/FTD-Causing FUS. Biochem. Biophys. Res. Commun. 2018, 504, 545–551. 10.1016/j.bbrc.2018.09.014. - DOI - PubMed
    1. Dec R.; Jaworek M.; Dzwolak W.; Winter R. Liquid-Droplet-Mediated ATP-Triggered Amyloidogenic Pathway of Insulin-Derived Chimeric Peptides: Unraveling the Microscopic and Molecular Processes. J. Am. Chem. Soc. 2023, 145, 4177–4186. 10.1021/jacs.2c12611. - DOI - PubMed
    1. Maiti S.; Fortunati I.; Ferrante C.; Scrimin P.; Prins L. J. Dissipative Self-Assembly of Vesicular Nanoreactors. Nat. Chem. 2016, 8, 725–731. 10.1038/nchem.2511. - DOI - PubMed
    1. Deng J.; Walther A. ATP-Responsive and ATP-Fueled Self-Assembling Systems and Materials. Adv. Mater. 2020, 32, 2002629.10.1002/adma.202002629. - DOI - PubMed

LinkOut - more resources