

The energy metabolism-promoting effect of aconite is associated with gut microbiota and bile acid receptor TGR5-UCP1 signaling
- PMID: 39323631
- PMCID: PMC11422068
- DOI: 10.3389/fphar.2024.1392385
The energy metabolism-promoting effect of aconite is associated with gut microbiota and bile acid receptor TGR5-UCP1 signaling
Abstract
Introduction: As a widely used traditional Chinese medicine with hot property, aconite can significantly promote energy metabolism. However, it is unclear whether the gut microbiota and bile acids contribute to the energy metabolism-promoting properties of aconite. The aim of this experiment was to verify whether the energy metabolism-promoting effect of aconite aqueous extract (AA) is related to gut microbiota and bile acid (BA) metabolism.
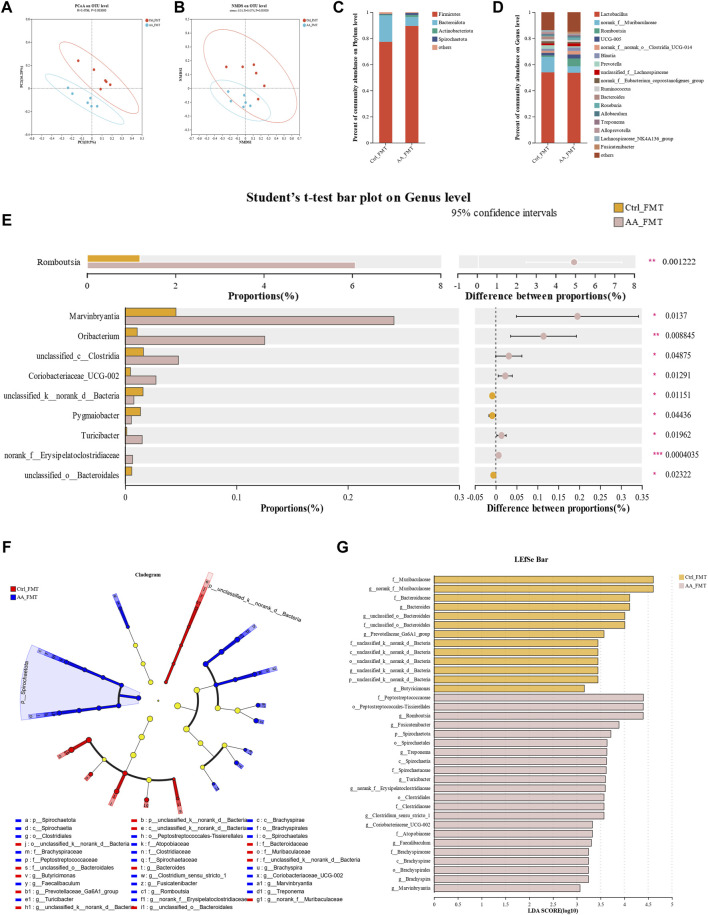
Methods: The effect of AA on energy metabolism in rats was detected based on body weight, body temperature, and adipose tissue by HE staining and immunohistochemistry. In addition, 16S rRNA high-throughput sequencing and targeted metabolomics were used to detect changes in gut microbiota and BA concentrations, respectively. Antibiotic treatment and fecal microbiota transplantation (FMT) were also performed to demonstrate the importance of gut microbiota.
Results: Rats given AA experienced an increase in body temperature, a decrease in body weight, and an increase in BAT (brown adipose tissue) activity and browning of WAT (white adipose tissue). Sequencing analysis and targeted metabolomics indicated that AA modulated gut microbiota and BA metabolism. The energy metabolism promotion of AA was found to be mediated by gut microbiota, as demonstrated through antibiotic treatment and FMT. Moreover, the energy metabolism-promoting effect of aconite is associated with the bile acid receptor TGR5 (Takeda G-protein-coupled receptor 5)-UCP1 (uncoupling protein 1) signaling pathway.
Conclusion: The energy metabolism-promoting effect of aconite is associated with gut microbiota and bile acid receptor TGR5-UCP1 signaling.
Keywords: aconite; antibiotic; bile acids; energy metabolism; fecal microbiota transplantation; gut microbiota.
Copyright © 2024 Zhang, Cheng, Wu, Zhou, Tang, Liu, Feng and Peng.
Conflict of interest statement
The authors declare that the research was conducted in the absence of any commercial or financial relationships that could be construed as a potential conflict of interest.
Figures


Similar articles
-
Aqueous extracts of Aconite promote thermogenesis in rats with hypothermia via regulating gut microbiota and bile acid metabolism.Chin Med. 2021 Mar 19;16(1):29. doi: 10.1186/s13020-021-00437-y. Chin Med. 2021. PMID: 33741035 Free PMC article.
-
Ameliorative effect of Aconite aqueous extract on diarrhea is associated with modulation of the gut microbiota and bile acid metabolism.Front Pharmacol. 2023 May 17;14:1189971. doi: 10.3389/fphar.2023.1189971. eCollection 2023. Front Pharmacol. 2023. PMID: 37266146 Free PMC article.
-
Resveratrol enhances brown adipose tissue activity and white adipose tissue browning in part by regulating bile acid metabolism via gut microbiota remodeling.Int J Obes (Lond). 2020 Aug;44(8):1678-1690. doi: 10.1038/s41366-020-0566-y. Epub 2020 Mar 17. Int J Obes (Lond). 2020. PMID: 32203111
-
The gut microbiota modulates both browning of white adipose tissue and the activity of brown adipose tissue.Rev Endocr Metab Disord. 2019 Dec;20(4):387-397. doi: 10.1007/s11154-019-09523-x. Rev Endocr Metab Disord. 2019. PMID: 31776853 Review.
-
Gut Microbiota-Bile Acid Crosstalk in Diarrhea-Irritable Bowel Syndrome.Biomed Res Int. 2020 Nov 12;2020:3828249. doi: 10.1155/2020/3828249. eCollection 2020. Biomed Res Int. 2020. PMID: 33274207 Free PMC article. Review.
Cited by
-
Fuzi alleviates cold-related rheumatoid arthritis via regulating gut microbiota and microbial bile acid metabolism.Chin Med. 2025 May 15;20(1):64. doi: 10.1186/s13020-025-01123-z. Chin Med. 2025. PMID: 40375326 Free PMC article.
-
Crosstalk Between Bile Acids and Intestinal Epithelium: Multidimensional Roles of Farnesoid X Receptor and Takeda G Protein Receptor 5.Int J Mol Sci. 2025 Apr 29;26(9):4240. doi: 10.3390/ijms26094240. Int J Mol Sci. 2025. PMID: 40362481 Free PMC article. Review.
References
LinkOut - more resources
Full Text Sources
Research Materials