

Hyperspectral reflectance imaging for visualizing reducing sugar content, moisture, and hollow rate in red ginseng
- PMID: 39323853
- PMCID: PMC11422046
- DOI: 10.1016/j.heliyon.2024.e37919
Hyperspectral reflectance imaging for visualizing reducing sugar content, moisture, and hollow rate in red ginseng
Abstract
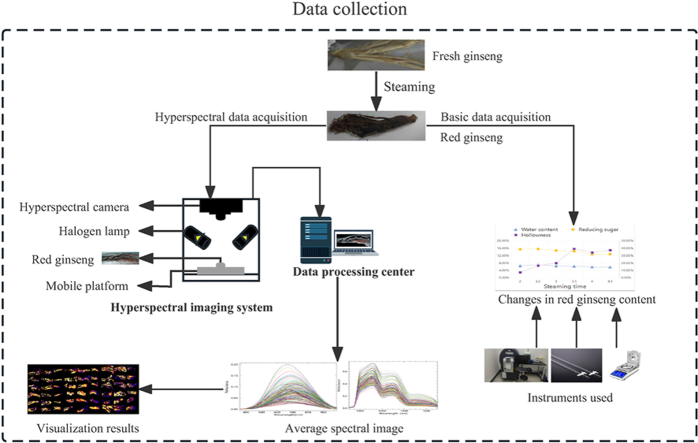
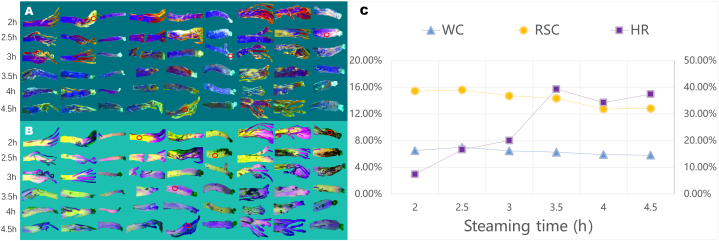
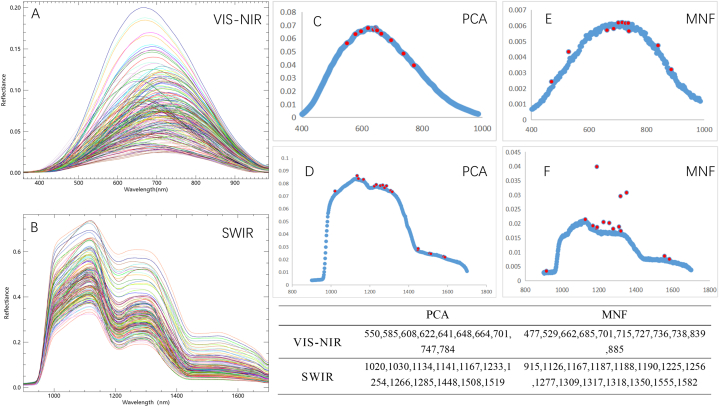
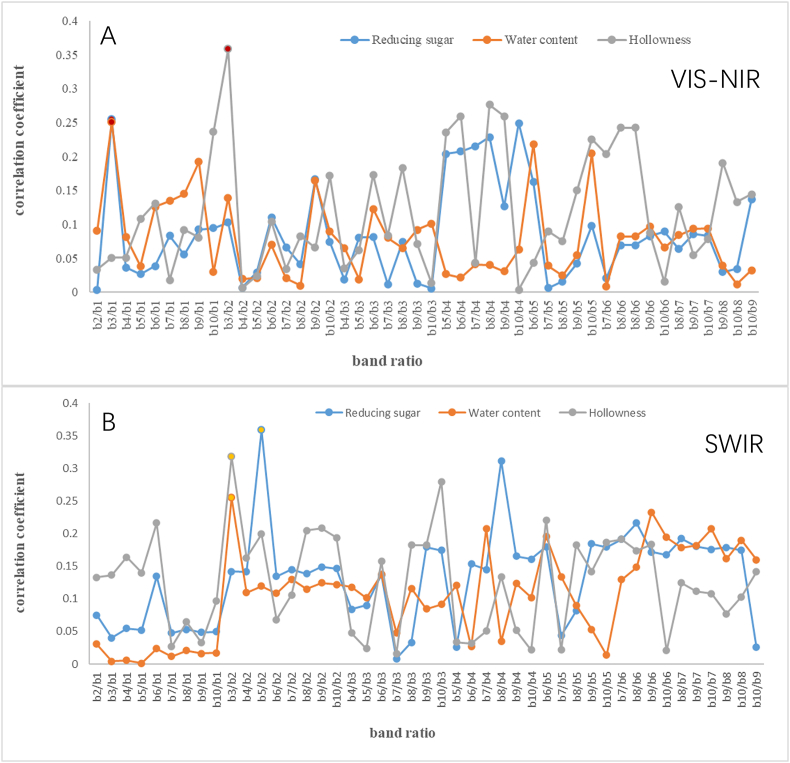
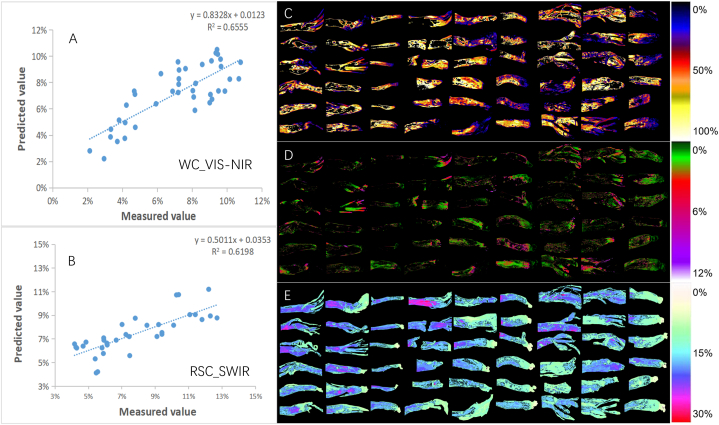
Red ginseng (RG) has been traditionally valued in Northeast Asia for its health-enhancing properties. Recent advancements in hyperspectral imaging (HSI) offer a non-destructive, efficient, and reliable method to assess critical quality indicators of RG, such as reducing sugar content (RSC), water content (WC), and hollow rate (HR). This study developed predictive models using HSI technology to monitor these quality indicators over the spectral range of 400-1700 nm. Image features were enhanced using Principal Component Analysis (PCA) and Minimum Noise Fraction (MNF), followed by classification through Spectral Angle Mapping (SAM). The best-performing model for RSC achieved an R2 value of 0.6198 and a root mean square error (RMSE) of 0.013. For WC, the optimal model obtained an R2 value of 0.6555 and an RMSE of 0.014. The spatial distribution of RSC, WC, and HR was effectively visualized, demonstrating the potential of HSI for on-site quality control of RG. This study provides a foundation for real-time, non-invasive monitoring of RG quality, addressing industry needs for rapid and reliable assessment methods.
Keywords: Hyperspectral imaging; Non-destructive analysis; Principal component analysis; Quality assessment; Red ginseng; Spectral angle mapping; Traditional Chinese medicine; Visualization.
© 2024 The Authors.
Conflict of interest statement
The authors declare that they have no known competing financial interests or personal relationships that could have appeared to influence the work reported in this paper.
Figures
Similar articles
-
Non-Destructive Testing Based on Hyperspectral Imaging for Determination of Available Silicon and Moisture Contents in Ginseng Soils of Different Origins.J Food Sci. 2025 May;90(5):e70285. doi: 10.1111/1750-3841.70285. J Food Sci. 2025. PMID: 40433951
-
Hyperspectral discrimination of ginseng variety and age from Changbai Mountain area.Spectrochim Acta A Mol Biomol Spectrosc. 2024 Feb 15;307:123613. doi: 10.1016/j.saa.2023.123613. Epub 2023 Nov 10. Spectrochim Acta A Mol Biomol Spectrosc. 2024. PMID: 37976570
-
Hyperspectral imaging for in situ visual assessment of Industrial-Scale ginseng.Spectrochim Acta A Mol Biomol Spectrosc. 2024 Nov 15;321:124700. doi: 10.1016/j.saa.2024.124700. Epub 2024 Jun 20. Spectrochim Acta A Mol Biomol Spectrosc. 2024. PMID: 38925038
-
Hyperspectral imaging as a non-destructive technique for estimating the nutritional value of food.Curr Res Food Sci. 2024 Jun 25;9:100799. doi: 10.1016/j.crfs.2024.100799. eCollection 2024. Curr Res Food Sci. 2024. PMID: 39040225 Free PMC article. Review.
-
[Research advances in imaging technology for food safety and quality control].Se Pu. 2020 Jul 8;38(7):741-749. doi: 10.3724/SP.J.1123.2020.03015. Se Pu. 2020. PMID: 34213280 Review. Chinese.
References
-
- In G., Ahn N.G., Bae B.S., Lee M.W., Park H.W., Jang K.H., Cho B.G., Han C.K., Park C.K., Kwak Y.S. In situ analysis of chemical components induced by steaming between fresh ginseng, steamed ginseng, and red ginseng. J. Ginseng Res. 2017;41(3):361–369. doi: 10.1016/j.jgr.2016.07.004. - DOI - PMC - PubMed
-
- Wu D., Sun D.W. Advanced applications of hyperspectral imaging technology for food quality and safety analysis and assessment: a review - Part I: fundamentals. Innov. Food Sci. Emerg. Technol. 2013;19:1–14. doi: 10.1016/j.ifset.2013.04.014. - DOI
-
- Bai S.H., Tahmasbian I., Zhou J., Nevenimo T., Hannet G., Walton D., Randall B., Gama T., Wallace H.M. A non-destructive determination of peroxide values, total nitrogen, and mineral nutrients in an edible tree nut using hyperspectral imaging. Comput. Electron. Agric. 2018;151:492–500. doi: 10.1016/j.compag.2018.06.029. - DOI
-
- Xu L.J., Chen Y.J., Wang X.H., Chen H., Tang Z.L., Shi X.S., Chen X.Y., Wang Y.C., Kang Z.L., Zou Z.Y., Huang P., He Y., Yang N., Zhao Y.P. Non-destructive detection of kiwifruit soluble solid content based on hyperspectral and fluorescence spectral imaging. Front. Plant Sci. 2023;13:1054. doi: 10.3389/fpls.2022.1075929. - DOI - PMC - PubMed
LinkOut - more resources
Full Text Sources
