

Phase-Amplitude Coupling in Theta and Beta Bands: A Potential Electrophysiological Marker for Obstructive Sleep Apnea
- PMID: 39323903
- PMCID: PMC11423842
- DOI: 10.2147/NSS.S470617
Phase-Amplitude Coupling in Theta and Beta Bands: A Potential Electrophysiological Marker for Obstructive Sleep Apnea
Abstract
Background: Phase-amplitude coupling (PAC) between the phase of low-frequency signals and the amplitude of high-frequency activities plays many physiological roles and is involved in the pathological processed of various neurological disorders. However, how low-frequency and high-frequency neural oscillations or information synchronization activities change under chronic central hypoxia in OSA patients and whether these changes are closely associated with OSA remains largely unexplored. This study arm to elucidate the long-term consequences of OSA-related oxygen deprivation on central nervous system function.
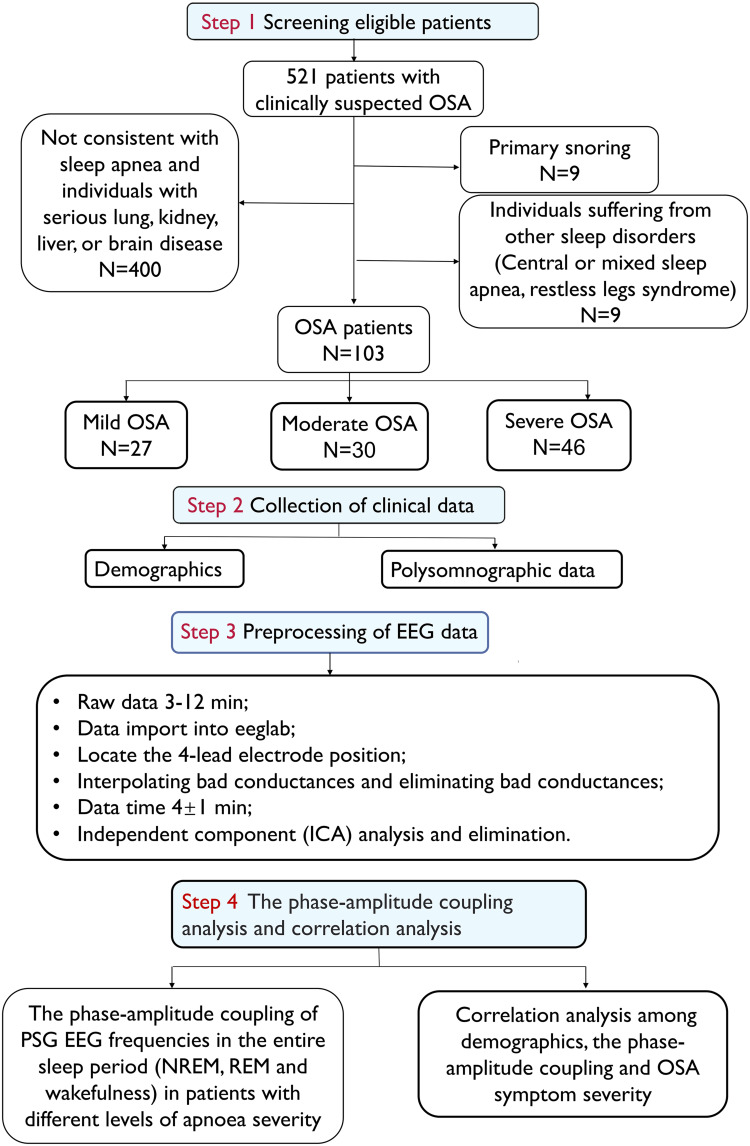
Methods: : We screened 521 patients who were clinically suspected of having OSA at our neurology and sleep centers. Through polysomnography (PSG) and other clinical examinations, 103 patients were ultimately included in the study and classified into mild, moderate, and severe OSA groups based on the severity of hypoxia determined by PSG. We utilized the phase-amplitude coupling (PAC) method to analyze the modulation index (MI) trends between different frequency bands during NREM (N1/N2/N3), REM, and wakefulness stages in OSA patients with varying severity levels. We also examined the correlation between the MI index and OSA hypoxia indices.
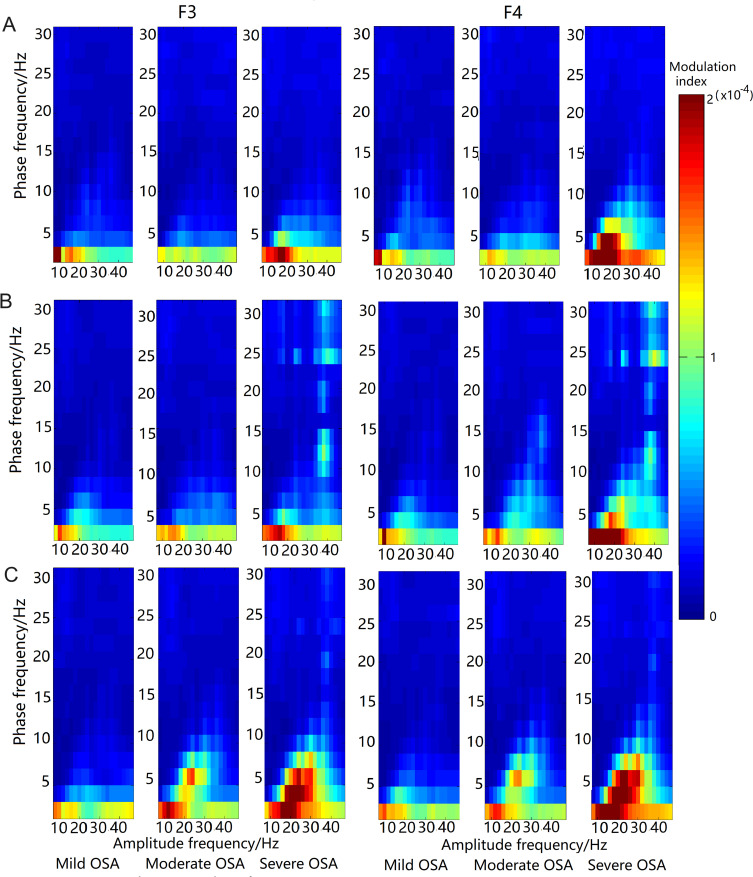
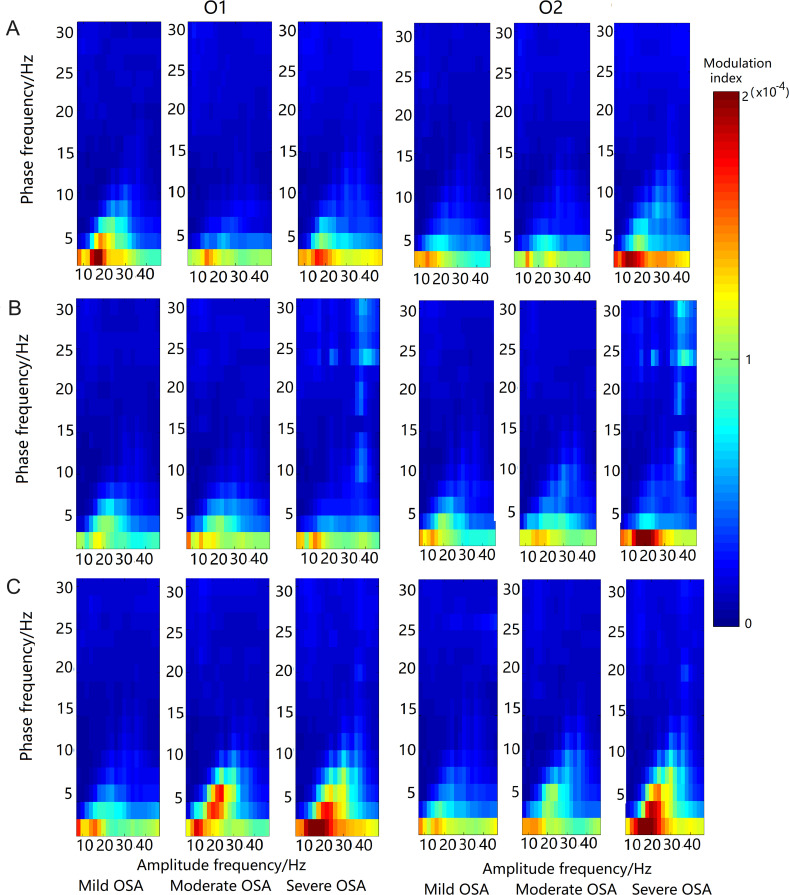
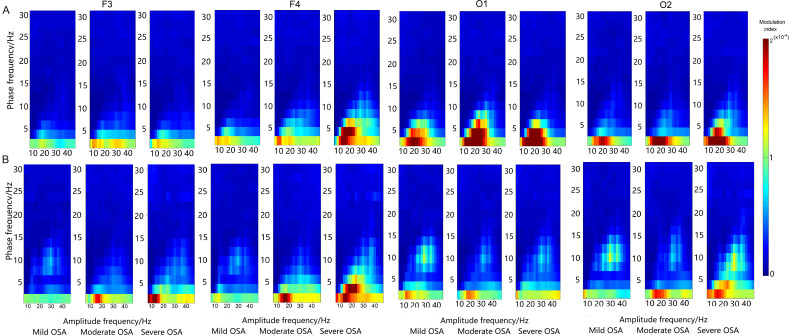
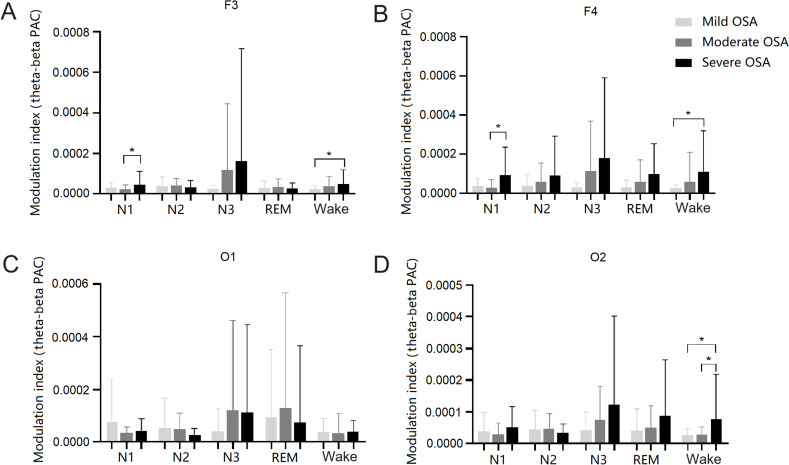
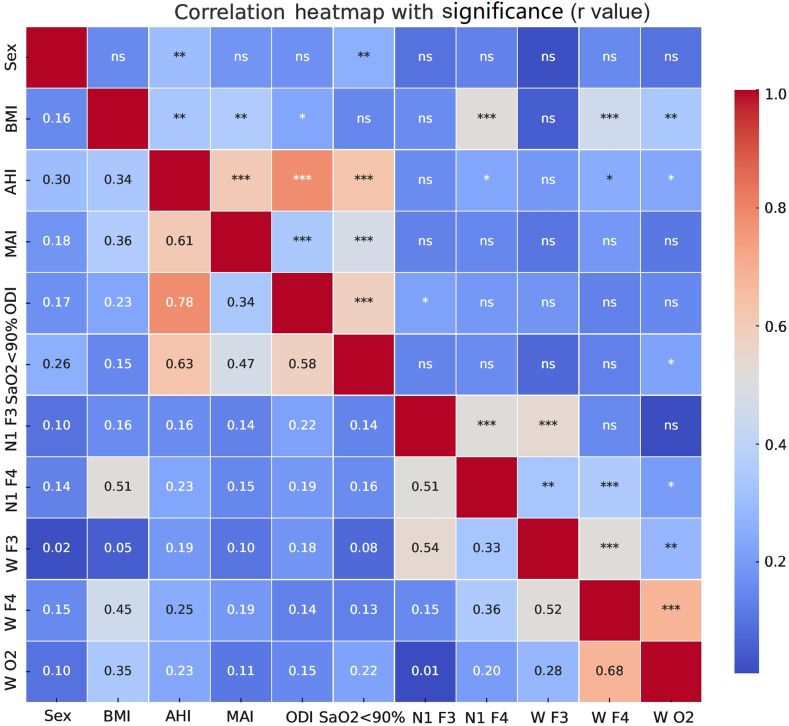
Results: Apart from reduced N2 sleep duration and increased microarousal index, the sleep architecture remained largely unchanged among OSA patients with varying severity levels. Compared to the mild OSA group, patients with moderate and severe OSA exhibited higher MI values of PAC in the low-frequency theta phase and high-frequency beta amplitude in the frontal and occipital regions during N1 sleep and wakefulness. No significant differences in the MI of phase-amplitude coupling were observed during N2/3 and REM sleep. Moreover, the MI of phase-amplitude coupling in theta and beta bands positively correlated with hypoxia-related indices, including the apnea-hypopnea index (AHI) and oxygenation desaturation index (ODI), and the percentage of oxygen saturation below 90% (SaO2<90%).
Conclusion: OSA patients demonstrated increased MI values of theta phase and beta amplitude in the frontal and occipital regions during N1 sleep and wakefulness. This suggests that cortical coupling is prevalent and exhibits sleep-stage-specific patterns in OSA. Theta-beta PAC during N1 and wakefulness was positively correlated with hypoxia-related indices, suggesting a potential relationship between these neural oscillations and OSA severity. The present study provides new insights into the relationship between neural oscillations and respiratory hypoxia in OSA patients.
Keywords: EEG; MI; PAC; modulation index; obstructive sleep apnea; phase-amplitude coupling; polysomnography.
© 2024 Zhang et al.
Conflict of interest statement
The authors report no conflicts of interest for this work. The data on which this manuscript is based are open to researchers upon appropriate request.
Figures
References
-
- Wan XY, Zhao WR, Wu XR, Chen XY, Lei X. The brain imaging studies of obstructive sleep apnea: Evidence from resting-state EEG and fMRI. Sheng Li Xue Bao. 2019;71(5):760–768. - PubMed
LinkOut - more resources
Full Text Sources
