Variable screening and model construction for prognosis of elderly patients with lower-grade gliomas based on LASSO-Cox regression: a population-based cohort study
- PMID: 39324140
- PMCID: PMC11422072
- DOI: 10.3389/fimmu.2024.1447879
Variable screening and model construction for prognosis of elderly patients with lower-grade gliomas based on LASSO-Cox regression: a population-based cohort study
Abstract
Background: This study aimed to identify prognostic factors for survival and develop a prognostic nomogram to predict the survival probability of elderly patients with lower-grade gliomas (LGGs).
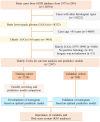
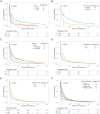
Methods: Elderly patients with histologically confirmed LGG were recruited from the Surveillance, Epidemiology, and End Results (SEER) database. These individuals were randomly allocated to the training and validation cohorts at a 2:1 ratio. First, Kaplan-Meier survival analysis and subgroup analysis were performed. Second, variable screening of all 13 variables and a comparison of predictive models based on full Cox regression and LASSO-Cox regression analyses were performed, and the key variables in the optimal model were selected to construct prognostic nomograms for OS and CSS. Finally, a risk stratification system and a web-based dynamic nomogram were constructed.
Results: A total of 2307 elderly patients included 1220 males and 1087 females, with a median age of 72 years and a mean age of 73.30 ± 6.22 years. Among them, 520 patients (22.5%) had Grade 2 gliomas, and 1787 (77.5%) had Grade 3 gliomas. Multivariate Cox regression analysis revealed four independent prognostic factors (age, WHO grade, surgery, and chemotherapy) that were used to construct the full Cox model. In addition, LASSO-Cox regression analysis revealed five prognostic factors (age, WHO grade, surgery, radiotherapy, and chemotherapy), and a LASSO model was constructed. A comparison of the two models revealed that the LASSO model with five variables had better predictive performance than the full Cox model with four variables. Ultimately, five key variables based on LASSO-Cox regression were utilized to develop prognostic nomograms for predicting the 1-, 2-, and 5-year OS and CSS rates. The nomograms exhibited relatively good predictive ability and clinical utility. Moreover, the risk stratification system based on the nomograms effectively divided patients into low-risk and high-risk subgroups.
Conclusion: Variable screening based on LASSO-Cox regression was used to determine the optimal prediction model in this study. Prognostic nomograms could serve as practical tools for predicting survival probabilities, categorizing these patients into different mortality risk subgroups, and developing personalized decision-making strategies for elderly patients with LGGs. Moreover, the web-based dynamic nomogram could facilitate its use in the clinic.
Keywords: SEER; cancer-specific survival; elderly; lower-grade glioma; nomogram; overall survival.
Copyright © 2024 Niu, Chang, Zhang, Liu, Yang and Mao.
Conflict of interest statement
The authors declare that the research was conducted in the absence of any commercial or financial relationships that could be construed as a potential conflict of interest.
Figures


Similar articles
-
[Development and Evaluation of Prognostic Nomogram Model for Adult Ventricle Glioma Patients].Sichuan Da Xue Xue Bao Yi Xue Ban. 2022 Jul;53(4):588-596. doi: 10.12182/20220760203. Sichuan Da Xue Xue Bao Yi Xue Ban. 2022. PMID: 35871728 Free PMC article. Clinical Trial. Chinese.
-
Risk Factors and Predictive Nomogram for Survival in Elderly Patients with Brain Glioma.Curr Med Sci. 2024 Aug;44(4):759-770. doi: 10.1007/s11596-024-2880-4. Epub 2024 Jul 11. Curr Med Sci. 2024. PMID: 38990448
-
Prognostic Nomograms for Primary High-Grade Glioma Patients in Adult: A Retrospective Study Based on the SEER Database.Biomed Res Int. 2020 Jul 23;2020:1346340. doi: 10.1155/2020/1346340. eCollection 2020. Biomed Res Int. 2020. PMID: 32775408 Free PMC article.
-
Prognostic nomograms for young breast cancer: A retrospective study based on the SEER and METABRIC databases.Cancer Innov. 2024 Oct 25;3(6):e152. doi: 10.1002/cai2.152. eCollection 2024 Dec. Cancer Innov. 2024. PMID: 39464427 Free PMC article. Review.
-
Nomograms for prognosis prediction in esophageal adenocarcinoma: realities and challenges.Clin Transl Oncol. 2025 Feb;27(2):449-457. doi: 10.1007/s12094-024-03589-z. Epub 2024 Jul 31. Clin Transl Oncol. 2025. PMID: 39083141 Review.
Cited by
-
PTK6 mediated immune signatures revealed by single cell transcriptomic and multi omics big data analysis in cervical cancer.Discov Oncol. 2025 Aug 16;16(1):1566. doi: 10.1007/s12672-025-03365-7. Discov Oncol. 2025. PMID: 40818002 Free PMC article.
-
Germline mutation analysis and postoperative recurrence risk prediction in breast cancer patients from western China.Transl Oncol. 2025 Oct;60:102477. doi: 10.1016/j.tranon.2025.102477. Epub 2025 Jul 29. Transl Oncol. 2025. PMID: 40738016 Free PMC article.
References
-
- Schiff D, Van Den Bent M, Vogelbaum MA, Wick W, Miller CR, Taphoorn M, et al. . Recent developments and future directions in adult lower-grade gliomas: Society for Neuro-Oncology (SNO) and European Association of Neuro-Oncology (EANO) consensus. Neuro Oncol. (2019) 21:838–54. doi: 10.1093/neuonc/noz033 - DOI - PMC - PubMed
MeSH terms
LinkOut - more resources
Full Text Sources
Medical

