. 2024 Sep 11:15:1448780.
doi: 10.3389/fimmu.2024.1448780. eCollection 2024.

Alterations in the plasma proteome persist ten months after recovery from mild to moderate SARS-CoV-2 infection

Affiliations

Alterations in the plasma proteome persist ten months after recovery from mild to moderate SARS-CoV-2 infection

Julio A Huapaya et al. Front Immunol. .

Abstract

Background: Limited data are available describing the effects of SARS-CoV-2 breakthrough infections on the plasma proteome.

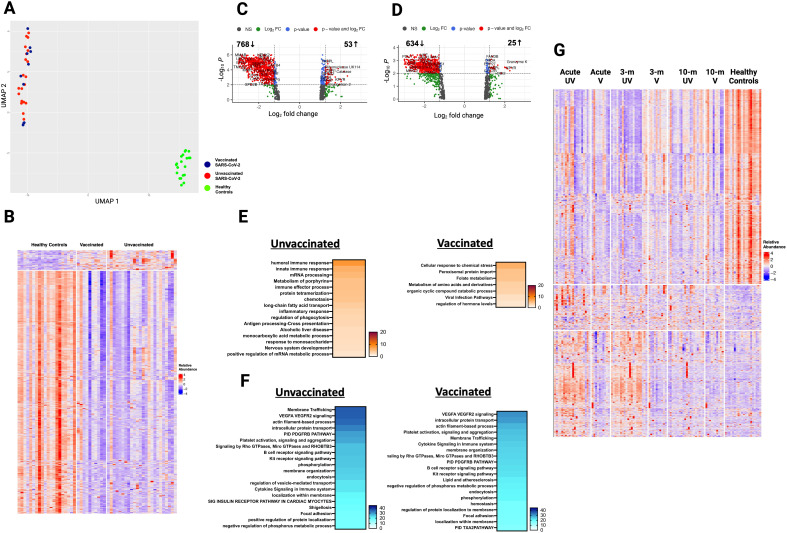
Methods: PCR-positive SARS-CoV-2 patients, enrolled in a natural history study, underwent analysis of the plasma proteome. A prospective cohort of 66 unvaccinated and 24 vaccinated persons with different degrees of infection severity were evaluated acutely (within 40 days of symptom onset), and at three and ten months. Comparisons based on vaccination status alone and unsupervised hierarchical clustering were performed. A second cohort of vaccinated Omicron patients were evaluated acutely and at ten months.

Results: Acutely, unvaccinated patients manifested overexpression of proteins involved in immune and inflammatory responses, while vaccinated patients exhibited adaptive immune responses without significant inflammation. At three and ten months, only unvaccinated patients had diminished but sustained inflammatory (C3b, CCL15, IL17RE) and immune responses (DEFA5,TREM1). Both groups had underexpression of pathways essential for cellular function, signaling, and angiogenesis (AKT1, MAPK14, HSPB1) across phases. Unsupervised clustering, based on protein expression, identified four groups of patients with variable vaccination rates demonstrating that additional clinical factors influence the plasma proteome. The proteome of vaccinated Omicron patients did not differ from vaccinated pre-Omicron patients.

Conclusions: Vaccination attenuates the inflammatory response to SARS-CoV-2 infection across phases. However, at ten months after symptom onset, changes in the plasma proteome persist in both vaccinated and unvaccinated individuals, which may be relevant to post-acute sequelae of SARS-CoV-2 and other viral infections associated with post-acute infection syndromes.

Keywords: SARS-CoV-2; breakthrough infections; inflammation; post-acute sequelae; proteomics; vaccination.


Conflict of interest statement

The authors declare that the research was conducted in the absence of any commercial or financial relationships that could be construed as a potential conflict of interest.

Figures

Figure 1
Figure 1
Alterations in the plasma proteome in vaccinated and unvaccinated SARS-CoV-2 patients during the acute phase of infection. (A) Uniform manifold approximation and projection (UMAP) of acute changes in the plasma proteome from 90 SARS-CoV-2 patients and 20 healthy controls. Blue circles – vaccinated, red circles – unvaccinated, and green triangles – healthy controls. (B) Heatmap of differentially expressed proteins (DEP) in vaccinated and unvaccinated SARS-CoV-2 patients compared to healthy controls. Each row represents a single protein; each column represents a patient. Volcano plots of DEP in plasma comparing (C) unvaccinated SARS-CoV-2 patients vs healthy controls and (D) vaccinated SARS-CoV-2 patients vs healthy controls. In (C, D), the horizontal dashed line denotes a cutoff of 0.01 for the FDR corrected p value after age, sex, and race adjustments. Vertical dashed line denotes a cutoff of 1.25 for the fold change. Pathway enrichment analysis of overexpressed proteins in (E) SARS-CoV-2 patients (according to vaccination status) vs healthy controls and of (F) underexpressed proteins in SARS-CoV-2 patients (according to vaccination) vs healthy controls. Gradation of colors in (E, F) reflect the -log 10 (p) value which indicates the statistically enriched terms using Metascape. An on-line summary of each protein across the different conditions analyzed is available at https://dir.nhlbi.nih.gov/lab/suffredini/proteomics/.
Figure 2
Figure 2
Selected protein levels related to core biological processes differ according to vaccination status during acute infection. Beeswarm plots displaying biological processes related to (A) NABA matrisome associated, innate immune response, viral infection, and positive regulation of cytokine production, (B) humoral immune response, cellular response to chemical stress, and negative regulation of the innate immune response, and (C) VEGFA-VEGFR2 signaling and intracellular protein transport. Protein levels are measured in relative fluorescence units (RFU). For the comparison between unvaccinated and vaccinated SARS-CoV-2 patients, an analysis of covariance model over the rank-based inverse normal transformed biomarkers was used after adjusting for age, sex, race, and days from symptom onset. For the comparison between vaccinated or unvaccinated patients and healthy controls, adjustments were made for age, sex, and race. FDR p value (adjusted over 7288 proteins) is shown for each pairwise comparison. An on-line summary of each protein across the different conditions analyzed is available at https://dir.nhlbi.nih.gov/lab/suffredini/proteomics/.
Figure 3
Figure 3
Persistent differences in the plasma proteome of unvaccinated and vaccinated SARS-CoV-2 patients detected at three months post-infection. (A) UMAP of the plasma proteome from 32 SARS-CoV-2 patients and 20 healthy controls at three months post-infection. Blue circles - vaccinated patients, red circles -unvaccinated patients, and green circles - healthy controls. (B) Heatmap showing DEP between SARS-CoV-2 patients (according to vaccination) and healthy controls at three months post-infection. Each row represents a single protein; each column represents a patient. Volcano plot of DEP in the plasma proteome between (C) unvaccinated SARS-CoV-2 patients vs healthy controls at three months post-infection and (D) vaccinated SARS-CoV-2 patients vs healthy controls at three months post-infection. Horizontal dashed line denotes a cutoff of 0.01 for the FDR corrected p value after age, sex, and race adjustments. Vertical dashed line denotes a cutoff of 1.25 for the fold change. Pathway enrichment analysis of (E) overexpressed proteins and (F) underexpressed proteins in SARS-CoV-2 patients (according to vaccination status) vs healthy controls at three months post-infection. Gradation of colors reflect the -log10 (p) value which indicates the statistically enriched terms using Metascape. An on-line summary of each protein across the different conditions analyzed is available at https://dir.nhlbi.nih.gov/lab/suffredini/proteomics/.
Figure 4
Figure 4
Changes in core biological processes proteins detected in unvaccinated and vaccinated patients between acute infection and three months post-infection. Paired line plots displaying changes in selected DEP from acute infection to three months post-infection in unvaccinated and vaccinated SARS-CoV-2 patients compared with healthy controls. Biological processes related to (A) skeletal system development and inflammatory responses, (B) cell secretion, and (C) actin cytoskeleton organization and endocytosis. Protein levels are measured in relative fluorescence units (RFU). For the comparison between unvaccinated and vaccinated SARS-CoV-2 patients, an analysis of covariance model over the rank-based inverse normal transformed biomarkers was used after adjusting for age, sex, race, and days from symptom onset. For the comparison between vaccinated or unvaccinated patients and healthy controls, adjustments were made for age, sex, and race. FDR p value (adjusted over 7288 proteins) is shown for each pairwise comparison. An on-line summary of each protein across the different conditions analyzed is available at https://dir.nhlbi.nih.gov/lab/suffredini/proteomics/.
Figure 5
Figure 5
Plasma proteome in vaccinated and unvaccinated SARS-CoV-2 patients at ten- month post-infection. (A) UMAP of plasma proteome from 32 SARS-CoV-2 patients and 20 healthy controls using a focused aptamer-assay based on 1500 proteins previously identified DEP in acute phases of SARS-CoV-2 infection. Blue circles - vaccinated patients, red circles - unvaccinated patients, and green triangles - healthy controls. (B) Heatmap showing DEP between SARS-CoV-2 patients (according to vaccination) and healthy controls at ten months post-infection. Each row represents a single protein; each column represents a patient. Volcano plot of DEP in plasma between (C) unvaccinated SARS-CoV-2 patients vs healthy controls and (D) vaccinated SARS-CoV-2 patients vs healthy controls. Horizontal dashed line denotes a cutoff of 0.01 for the FDR corrected p value after age, sex, and race adjustments. Vertical dashed line denotes a cutoff of 1.25 for the fold change. Pathway enrichment analysis of (E) overexpressed and (F) underexpressed proteins in SARS-CoV-2 patients (according to vaccination) vs healthy controls. Colors reflect the -log 10 (p) value which indicates the statistically enriched terms using Metascape. (G) Heatmap showing all 1500 proteins over the 3 phases of illness and healthy controls. UV - unvaccinated patients and V - vaccinated patients. Each row represents a single protein; each column represents a patient. An on-line summary of each protein across the different conditions analyzed is available at https://dir.nhlbi.nih.gov/lab/suffredini/proteomics/.
Figure 6
Figure 6
Plasma DEP in four clusters of SARS-CoV-2 patients identified by hierarchical clustering during the acute phase of infection. (A) UMAP of the plasma proteome from hierarchical clustering of 90 SARS-CoV-2 patients and 20 healthy controls in the acute phase of infection (circles - unvaccinated patients, triangles - vaccinated patients, and different colors denote the 4 SARS-CoV-2 groups and healthy controls. (B) Heatmap showing DEP among four SARS-CoV-2 clusters) and healthy controls. Each row represents a single protein; each column represents a patient. Pathway enrichment analysis of (C) overexpressed proteins and (D) underexpressed proteins in four SARS-CoV-2 clusters compared to all vaccinated and all unvaccinated from prior supervised clustering. An on-line summary of each protein across the different conditions analyzed is available at https://dir.nhlbi.nih.gov/lab/suffredini/proteomics/.
Figure 7
Figure 7
Random forest analysis at ten months post-infection identified several relevant proteins associated with relevant outcomes. Variable importance was measured using the mean decrease in Gini index. Variables with larger mean decreases in Gini index had greater variable importance for (A) persistent radiological abnormalities in SARS-CoV-2 patients at ten months post-infection. (B) any long SARS-CoV-2 symptoms ten months post-infection.
Figure 8
Figure 8
Longitudinal Analysis of the plasma proteome of SARS-CoV-2 patients identified relevant trends over time, particularly in unvaccinated patients. (A) Heatmap displaying the 602 proteins that changed significantly over time in unvaccinated SARS-CoV-2 patients. (B) Heatmap displaying the five proteins that changed significantly over time in vaccinated SARS-CoV-2 patients. Each row represents a single protein; each column represents a patient. The same patient is represented at each time point.

References

    1. Bollyky TJ, Castro E, Aravkin AY, Bhangdia K, Dalos J, Hulland EN, et al. . Assessing COVID-19 pandemic policies and behaviours and their economic and educational trade-offs across US states from Jan 1, 2020, to July 31, 2022: an observational analysis. Lancet. (2023) 401(10385):1341–60. doi: 10.1016/S0140-6736(23)00461-0 - DOI - PMC - PubMed
    1. Messner CB, Demichev V, Wendisch D, Michalick L, White M, Freiwald A, et al. . Ultra-high-throughput clinical proteomics reveals classifiers of COVID-19 infection. Cell Syst. (2020) 11:11–24.e4. doi: 10.1016/j.cels.2020.05.012 - DOI - PMC - PubMed
    1. Cui M, Cheng C, Zhang L. High-throughput proteomics: a methodological mini-review. Lab Invest. (2022) 102:1170–81. doi: 10.1038/s41374-022-00830-7 - DOI - PMC - PubMed
    1. Filbin MR, Mehta A, Schneider AM, Kays KR, Guess JR, Gentili M, et al. . Longitudinal proteomic analysis of severe COVID-19 reveals survival-associated signatures, tissue-specific cell death, and cell-cell interactions. Cell Rep Med. (2021) 2:100287. doi: 10.1016/j.xcrm.2021.100287 - DOI - PMC - PubMed
    1. Li H, Li X, Wu Q, Wang X, Qin Z, Wang Y, et al. . Plasma proteomic and metabolomic characterization of COVID-19 survivors 6 months after discharge. Cell Death Dis. (2022) 13:235. doi: 10.1038/s41419-022-04674-3 - DOI - PMC - PubMed