

Integrated Identification and Immunotherapy Response Analysis of the Prognostic Signature Associated With m6A, Cuproptosis-Related, Ferroptosis-Related lncRNA in Endometrial Cancer
- PMID: 39324703
- PMCID: PMC11425647
- DOI: 10.1002/cnr2.70009
Integrated Identification and Immunotherapy Response Analysis of the Prognostic Signature Associated With m6A, Cuproptosis-Related, Ferroptosis-Related lncRNA in Endometrial Cancer
Abstract
Background: Endometrial cancer (EC) stands as the predominant gynecological malignancy impacting the female reproductive system on a global scale. N6-methyladenosine, cuproptosis- and ferroptosis-related biomarker is beneficial to the prognostic of tumor patients. Nevertheless, the correlation between m6A-modified lncRNAs and ferroptosis, copper-induced apoptosis in the initiation and progression of EC remains unexplored in existing literature.
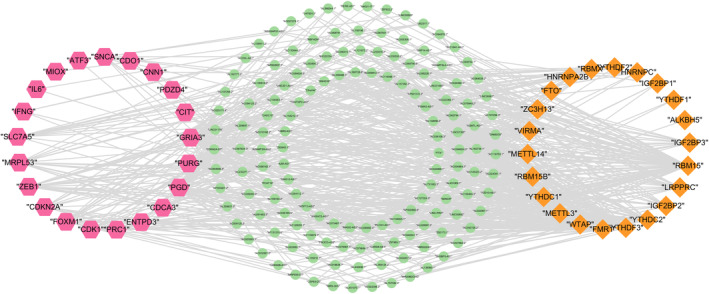
Aims: In this study, based on bioinformatics approach, we identified lncRNAs co-expressing with cuproptosis-, ferroptosis-, m6A- related lncRNAs from expression data of EC. By constructing the prognosis model in EC, we screened hub lncRNA signatures affecting prognosis of EC patients. Furthermore, the guiding value of m6A-modified ferroptosis-related lncRNA (mfrlncRNA) features was assessed in terms of prognosis, immune microenvironment, and drug sensitivity.
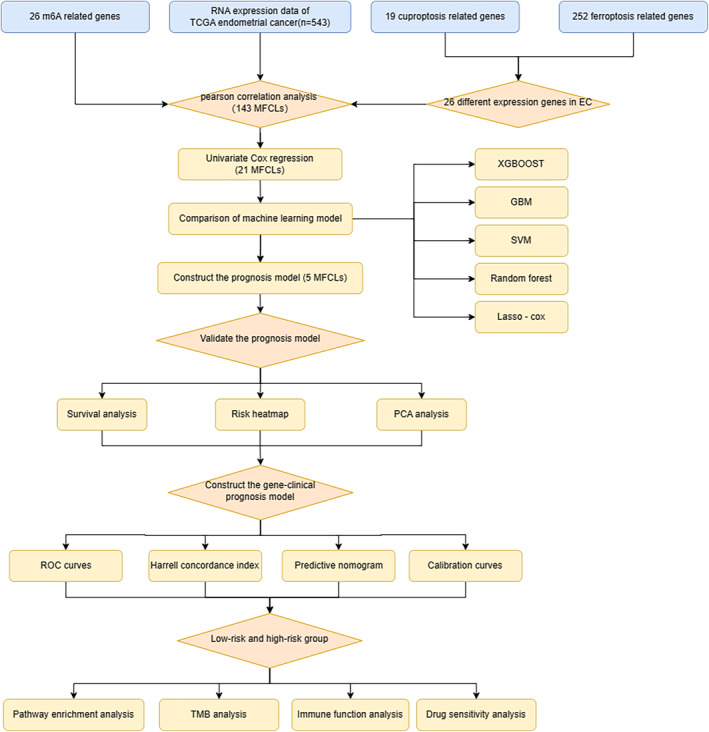
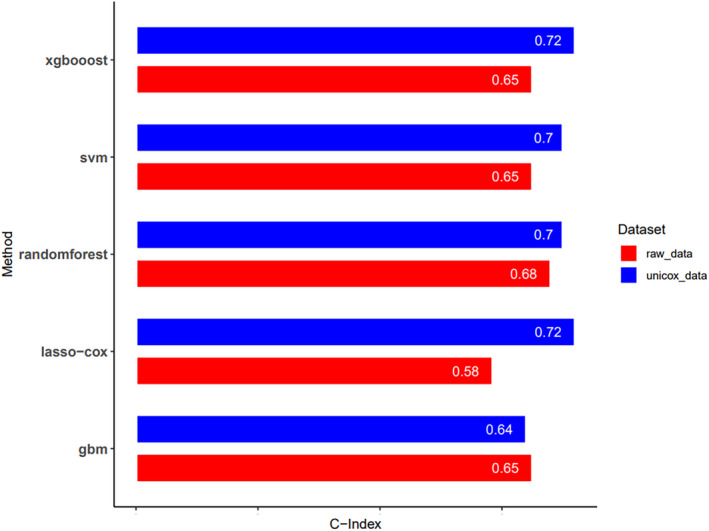
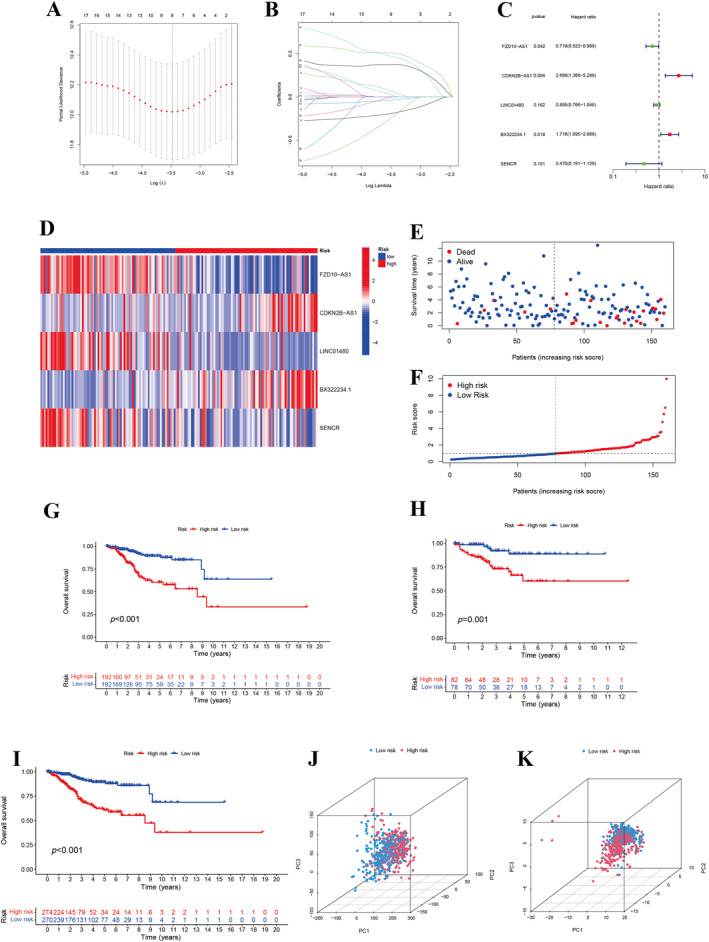
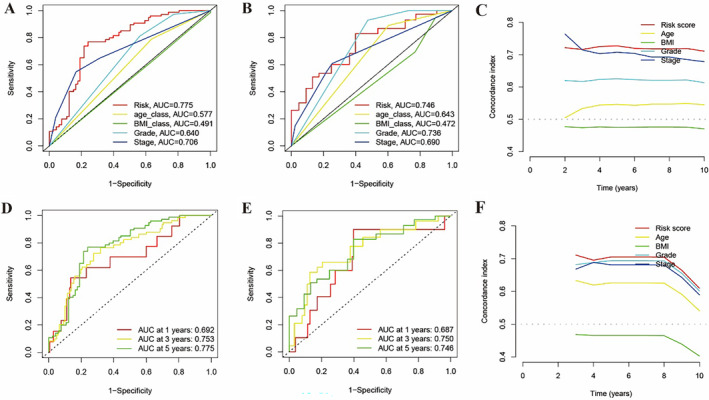
Method: Our research harnessed gene expression data coupled with clinical insights derived from The Cancer Genome Atlas (TCGA) collection. To forge prognostic models, we adopted five machine learning approaches, assessing their efficacy through C-index and time-independent ROC analysis. We pinpointed prognostic indicators using the LASSO Cox regression approach. Moreover, we delved into the biological and immunological implications of the discovered lncRNA prognostic signatures.
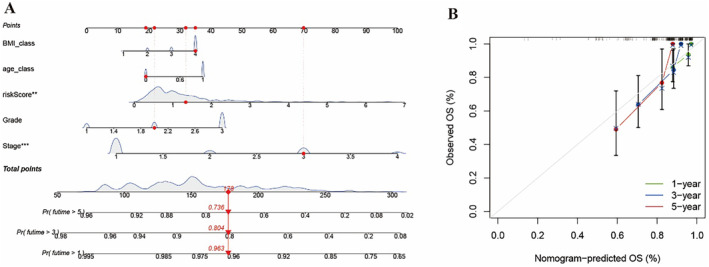
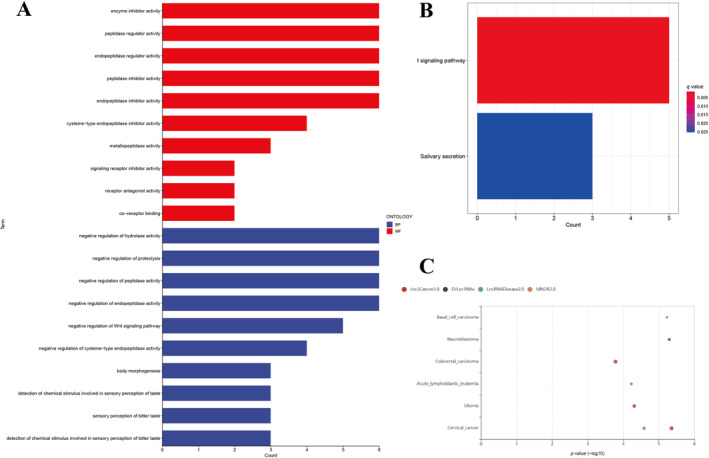
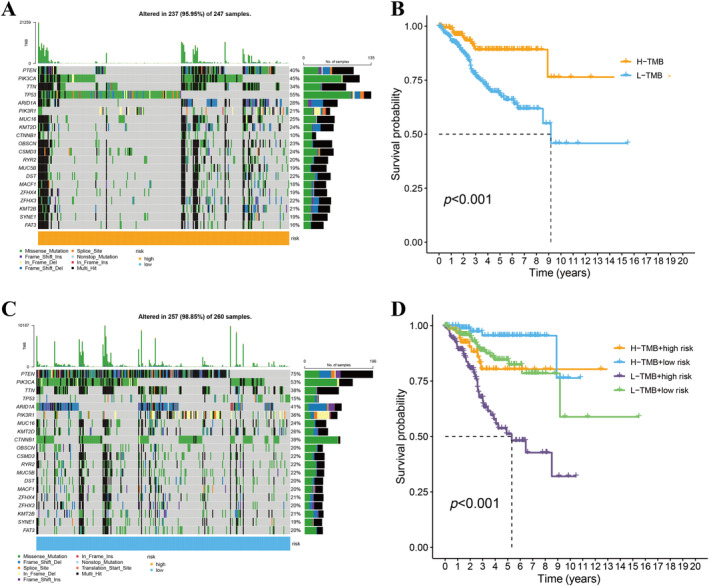
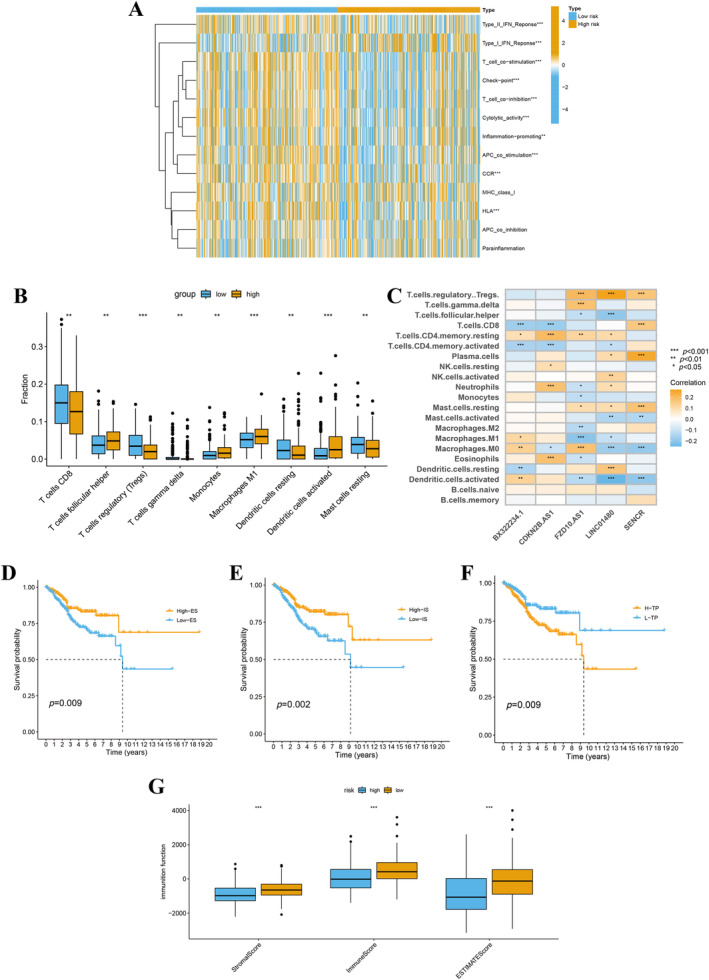
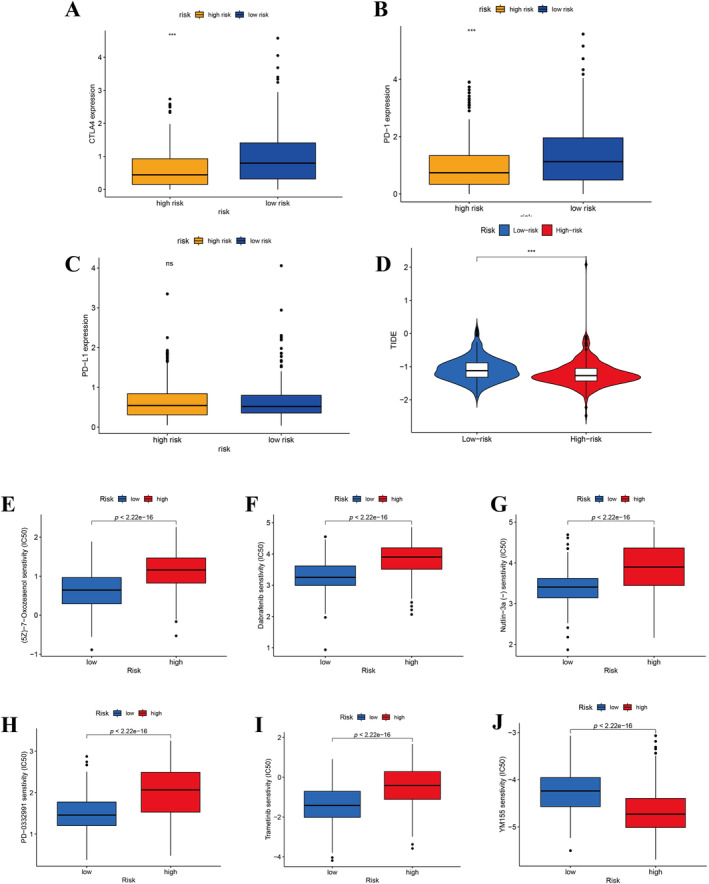
Results: The survival rate for the low-risk group was markedly higher than that for the high-risk group, as evidenced by a significant log-rank test (p < 0.001). The LASSO Cox regression model yielded concordance indices of 0.76 for the training set and 0.77 for the validation set, indicating reliable prognostic accuracy. Enrichment analysis of gene functions linked the identified signature predominantly to endopeptidase inhibitor activity, highlighting the signature's potential implications. Additionally, immune function and drug density emphasized the importance of early diagnosis in EC.
Conclusion: Five hub lncRNAs in EC were identified through constructing the prognosis model. Those genes might be potential biomarkers to provide valuable reference for targeted therapy and prognostic assessment of EC.
Keywords: cuproptosis; lncRNA; machine learning; survival risk model; women's cancer.
© 2024 The Author(s). Cancer Reports published by Wiley Periodicals LLC.
Conflict of interest statement
The authors declare no conflicts of interest.
Figures
Similar articles
-
Subtype cluster analysis unveiled the correlation between m6A- and cuproptosis-related lncRNAs and the prognosis, immune microenvironment, and treatment sensitivity of esophageal cancer.Front Immunol. 2025 Feb 17;16:1539630. doi: 10.3389/fimmu.2025.1539630. eCollection 2025. Front Immunol. 2025. PMID: 40034693 Free PMC article.
-
Cuproptosis-Associated lncRNA Gene Signature Establishes New Prognostic Profile and Predicts Immunotherapy Response in Endometrial Carcinoma.Biochem Genet. 2024 Oct;62(5):3439-3466. doi: 10.1007/s10528-023-10574-8. Epub 2023 Dec 18. Biochem Genet. 2024. PMID: 38108937 Free PMC article.
-
A Cuproptosis-Related LncRNA Risk Model for Predicting Prognosis and Immunotherapeutic Efficacy in Patients with Hepatocellular Carcinoma.Biochem Genet. 2024 Jun;62(3):2332-2351. doi: 10.1007/s10528-023-10539-x. Epub 2023 Oct 29. Biochem Genet. 2024. PMID: 37898914
-
Cuproptosis regulation by long noncoding RNAs: Mechanistic insights and clinical implications in cancer.Arch Biochem Biophys. 2025 Mar;765:110324. doi: 10.1016/j.abb.2025.110324. Epub 2025 Feb 1. Arch Biochem Biophys. 2025. PMID: 39900259 Review.
-
lncRNAs as prognostic markers and therapeutic targets in cuproptosis-mediated cancer.Clin Exp Med. 2024 Sep 26;24(1):226. doi: 10.1007/s10238-024-01491-0. Clin Exp Med. 2024. PMID: 39325172 Free PMC article. Review.
Cited by
-
SCENE: Signature Collection for Endometrial Cancer Prognosis.J Cell Mol Med. 2025 Aug;29(15):e70762. doi: 10.1111/jcmm.70762. J Cell Mol Med. 2025. PMID: 40754672 Free PMC article. Review.
References
-
- Khazaei Z., Namayandeh S. M., Beiranvand R., Naemi H., Bechashk S. M., and Goodarzi E., “Worldwide Incidence and Mortality of Ovarian Cancer and Human Development Index (HDI): GLOBOCAN Sources and Methods 2018,” Journal of Preventive Medicine and Hygiene 62 (2021): E174–E184, 10.15167/2421-4248/jpmh2021.62.1.1606. - DOI - PMC - PubMed
MeSH terms
Substances
LinkOut - more resources
Full Text Sources
