. 2024 Oct 1;4(10):2734-2755.
doi: 10.1158/2767-9764.CRC-24-0268.

ATF6 Promotes Colorectal Cancer Growth and Stemness by Regulating the Wnt Pathway

Affiliations

ATF6 Promotes Colorectal Cancer Growth and Stemness by Regulating the Wnt Pathway

Jeffrey J Rodvold et al. Cancer Res Commun. .

Abstract

ATF6 intervention reduces colorectal cancer cell and organoid viability by interrupting dysregulated Wnt signaling, identifying a novel facilitator and potential therapeutic target in colorectal cancer.


Conflict of interest statement

J.J. Rodvold reported being a full-time employee of Genentech Inc. at the time of this work. S.A. Marsters reports being a full-time employee of Genentech. I. Oikonomidi reports personal fees from Genentech Inc. during the conduct of the study. Z.D. Modrusan reports other support from Roche outside the submitted work. T.D. Wu reports other support from Genentech, Inc. during the conduct of the study and other support from Genentech, Inc. outside the submitted work. F. de Sousa e Melo reports owning shares of Roche and Amgen. A. Ashkenazi reports being a full-time employee of and other support from Genentech, Inc. outside the submitted work. No disclosures were reported by the other authors.

Figures

Figure 1
Figure 1
Several solid malignancies display elevated mRNA expression of ATF6 target genes. A, Expression sum of 13 known ATF6 target genes (ER13 score) based on tissue specimen data from TCGA. ER13 score comparison made respective to each tissue type between cancerous relative to normal tissue. B, ER13 score of patient samples from colorectal cancer subsets of mucinous or not-otherwise-stated adenocarcinoma from malignant and normal samples in TCGA. C, Average log2 expression ER13 single-cell expression of colonic epithelium cells from normal or tumor tissue from Pelka and colleagues (40). D,ATF6 expression of colonic epithelium cells from normal or tumor tissue. E, Average ER13 single-cell expression of colonic epithelium cells from normal or tumor tissue stratified by microsatellite stable or instable tumor cells. Avg, average; C, cancerous; Exp, expression; GBM, glioblastoma; MSI, microsatellite instable; MSS, microsatellite stable; N, normal; NOS, not otherwise stated.
Figure 2
Figure 2
Disruption of ATF6 attenuates growth of multiple colorectal cancer cell lines in vitro and in vivo. A, Viability of Colo201 cells expressing shNTC or shATF6 grown in the presence or absence of Dox (0.5 μg/mL) for 7 days (n = 5). B, Kinetics of growth confluence of Colo201 cells expressing shNTC or shATF6 as treated in A. C, Representative light microscopy images of cells in B after 7-day treatment at 4× magnification. D, Viability of CCK81 cells expressing shNTC or shATF6 treated as in A (n = 5). E, Confluence of CCK81 cells expressing shNTC or shATF6 treated as in A. F, Representative light microscopy images of cells in D after 7-day treatment. G–I, Viability of parental (WT) Colo201 cells or clonal derivatives harboring CRISPR-based ATF6 KO [KO clones (Cl) 4.5 and 4.8] grown on standard TC plates (G), ULA plates (H), or in Matrigel (I; n ≥ 3). J, Viability of various colorectal cancer shATF6 cell lines after 7 days of growth in the absence or presence of Dox (n ≥ 3). K, Viability of selectively inducible shATF6 colorectal cancer cell lines after 7 days of growth in the presence of Dox or Ceapin-A7 (10 μmol/L; n = 3). L, Tumor growth kinetics of Colo201 cell lines expressing inducible shNTC, shATF6.1, or shATF6.2. Following s.c. injection and tumor establishment, tumor-bearing mice were offered water supplemented with 5% sucrose without or with Dox (0.5 mg/mL; n = 10 per group). WT, wild-type. *, P < 0.05; **. P < 0.005; ***, P < 0.001; ****, P < 0.0001.
Figure 3
Figure 3
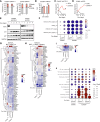
ATF6 silencing attenuates cell-cycle progression and downregulates cell-cycle drivers. A, Colo201 and CCK81 cells expressing inducible shATF6 were treated with or without Dox for 3 days and subjected to cell-cycle analysis by EdU incorporation (n = 3). B, G1 phase abundance of Colo201 shATF6.1 cells after treatment with or without Dox for specified treatment lengths as determined by cell-cycle analysis by PI staining (n = 3). C, Colo201 cells expressing inducible shATF6 were treated with Dox for 0 to 4 days and mRNA expression of ATF6 and CDKN1A/p21 was determined by qPCR (n = 2 per group). D, CCK81 cells expressing inducible shATF6 were treated and similarly analyzed as in B. E, Colo201 and CCK81 cells expressing inducible shATF6 were treated without (−) or with Dox for 0 to 4 days, and protein levels of ATF6, p21(CDKN1A), and p27 were determined by immunoblotting. Cells treated without Dox harvested on day 4. F, GSEA plots of hallmark gene sets. G, Heatmap of hallmark MYC targets v2. H, Heatmap of hallmark Wnt/β-catenin signaling. I, Heatmap of stem gene set. J, GSEA plots of stem and specific differentiated cell type gene sets. CellCyc, cell cycle; NES, Normalized Enrichment Score. ; *, P < 0.05; **, P < 0.005; ***, P < 0.001.
Figure 4
Figure 4
ATF6 disruption perturbs Myc and Wnt signaling and decreases colorectal cancer cell seeding capacity. A, Effect of ATF6 knockdown on Wnt signaling genes. Colo201 shATF6.1 cells were incubated for the indicated time with Dox (0.5 μg/mL) and analyzed by RT-qPCR for expression of ATF6 and Wnt signaling genes (AXIN2, LGR5, and TCF7) mRNA (n = 3). B, Gene expression of CCK81 shATF6 cells as treated and analyzed in A (n = 3). C, Effect of ATF6 knockdown on LGR5 surface expression. Colo201 shATF6.1 cells were treated with or without Dox (0.5 μg/mL) for 3 days and analyzed by flow cytometry for LGR5 surface expression (n = 3). D, LGR5 expression of CCK81 shATF6 cells as in C (n = 2). E, Raw luminescence units of TOP.FLASH reporter Colo201 shATF6.1 cells after 2-day treatment of Dox (0.5 μg/mL) to report Wnt signaling activity (n = 4). F, TOP.FLASH expression of CCK81 shATF6 cells as in E (n = 3). G, Effect of ATF6 knockdown on Myc signaling genes. Colo201 shATF6.1 cells were incubated for the indicated time with Dox (0.5 μg/mL) and analyzed by RT-qPCR for expression of Myc signaling genes (MYC, CDCA7) mRNA (n = 3). H, Gene expression of CCK81 shATF6 cells as in G (n = 3). I, Effect of ATF6 knockdown on Myc expression. Colo201 shNTC, shATF6.1 and shATF6.2 cells and CCK81 shNTC, shATF6 cells were incubated for the indicated time with Dox (0.5 μg/mL) and analyzed by immunoblotting. Cells treated without (−) Dox were harvested on day 4. J, Effect of ATF6 knockdown on seeding potential. Colo201 shNTC and shATF6.2 cells were seeded at decreasing concentrations of 96-well and grown in the presence or absence of Dox (0.5 μg/mL) for 7-day. Cell abundance determined by raw luminescence units detected from CellTiterGlo assay (n ≥ 3). K, Seeding potential of CCK81 shNTC and CCK81 shATF6 cells as in J (n ≥ 3). L, Viability of Colo201 shATF6.2 cells seeded at high (1.25e4 cell/well) or low (2e2 cell/well) densities, as described in J (n ≥ 3). M, Viability of CCK81 shATF6 cells seeded at high (1.25e4 cell/well) or low (2e2 cell/well) densities, as described in L (n ≥ 3). N, Fluorescent microscopy images of Colo201 shATF6.1 cells seeded at high (1.25e4 cell/well) or low (4e2 cell/well) densities in ULA wells after 7 days growth in absence or presence of Dox (0.5 μg/mL) as visualized by nuclei signal (red). O, Fluorescent microscopy images of CCK81 shATF6 cells, as described in N. MFI, Median Fluorescence Intensity; RLU, raw luminescence unit. **, P < 0.005; ***, P < 0.001; ****, P < 0.0001.
Figure 5
Figure 5
β-catenin knockdown phenocopies ATF6 silencing. A, Validation of knockdown in CCK81 cells. CCK81 shATF6 cells and CCK81 shCTNNB1 cells were incubated with Dox (0.5 μg/mL) for 2 and 4 days and analyzed by immunoblotting. Cells treated without Dox (−) were harvested after 4 days. B, CCK81 shATF6 cells and CCK81 shCTNNB1 cells were grown in the absence or presence of Dox for 2 and 4 days and were analyzed by RT-qPCR for Wnt signaling (AXIN2, LGR5, and TCF7), Myc signaling (MYC and CDCA7), and CDKN1A mRNA (n = 3). C, Validation of knockdown in Colo201 cells. Colo201 shATF6.2 cells and Colo201 shCTNNB1 cells were incubated with Dox (0.5 μg/mL) for 3 days and analyzed by immunoblotting. D, Colo201 shATF6.2 cells and Colo201 shCTNNB1 cells were grown in the presence of Dox for 3 days and were analyzed by RT-qPCR for Wnt signaling (AXIN2, LGR5, and TCF7), Myc signaling (MYC and CDCA7), and CDKN1A mRNA (n = 3). E, Viability of CCK81 shATF6 cells and CCK81 shCTNNB1 cells grown in the presence or absence of Dox (0.5 μg/mL) for 5 days (n = 3). F, Viability of Colo201 shATF6.1 cells and Colo201 shCTNNB1 cells grown in the presence or absence of Dox (0.5 μg/mL) for 7 days (n = 6). G, Quantification of cell abundance as determined by relative luminescence units of CCK81 shATF6 cells and CCK81 shCTNNB1 cells that were seeded at specified density and grown with or without Dox (0.5 μg/mL) for 7 days. H, Cell abundance of Colo201 shATF6.1 cells and Colo201 shCTNNB1 cells, as described in G. I, Cell abundance of Colo201 shATF6 cells and Colo201 shCTNNB1 cells grown in ULA plates, as described in G. J, Colo201 and CCK81 shCTNNB1 cells were treated with or without Dox for 3 days and subjected to cell-cycle analysis by EdU incorporation (n = 3). K, Viability of CCK81 shCTNNB1 cells treated separately with Dox (0.5 μg/mL), Ceapin-A7 (10 μmol/L), or concomitantly after 7 days (n = 5). RLU, relative luminescence unit. ** , P < 0.005; ***, P < 0.001; ****, P < 0.0001.
Figure 6
Figure 6
Selective ATF6 inhibition attenuates colorectal cancer organoid growth while inhibiting Wnt-pathway activity. A, Viability of normal (Col009 and DNW15) or malignant (PDM-264, PDM-5, PDM-6, PDM-96, PDM-185, and PDM-272) intestinal organoids treated with Ceapin-A7 (10 μmol/L) for 7 days (n = 3). B, Brightfield 4× visualization of PDM-185 growth in the absence (DMSO) or presence of Ceapin-A7 (10 μmol/L) for 7 days. C, Viability of PDM-272 organoid after 7 days of Ceapin-A7 treatment at the specified concentration (n = 3). D, Organoid confluence of PDM-272, as described in C, as quantified by Incucyte (n = 3). E, Cell-cycle distribution of PDM-272 organoid treated without or with Ceapin-A7 (3 μmol/L) after 2 days as determined by flow cytometric PI staining (n = 2). F, Gene expression of ATF6, Wnt signaling genes (AXIN2, LGR5, and TCF7), and Myc signaling genes (MYC and CDCA7) of PDM-272 organoid treated with Ceapin-A7 (3 μmol/L) for 2 days as determined by RT-qPCR (n = 3). G, Viability of PDM-272 after 7 days of growth in the presence of inactive Ceapin-A7 (3 μmol/L), or Ceapin-A7 (3 μmol/L; n = 3). H, Organoid confluence of PDM-272, as described in G (n = 3). I, Light microscopy images of PDM-272 organoid in G after 7-day treatment. J, PDM-272 were treated as in G for 2 days and were analyzed by RT-qPCR for Wnt signaling (AXIN2, LGR5, and TCF7) and Myc signaling (MYC and CDCA7) mRNA levels (n = 3). *, P < 0.05; **, P < 0.005; ***, P < 0.001; ****, P < 0.0001.
Figure 7
Figure 7
ATF6 inhibition in PDM-272 organoids attenuates cell-cycle progression and promotes multilineage intestinal differentiation. A, UMAPs based on principal components of all single-cell transcriptomes of PDM-272 organoid treated with DMSO (n = 2) or Ceapin-A7 (3 μmol/L; n = 2) for 2 days, as depicted by treatment condition (left) and cluster segmentation (right). B, Pathway enrichment scores of cluster 1 vs. cluster 2 described in A. C, Pathways most significantly downregulated in cluster 2 from cluster 1, as described in A. D, Pathways most significantly upregulated in cluster 2 from cluster 1, as described in A. E, UCell Signature Score of cluster 1 and cluster 2, as described in A. F, Effect of ATF6 inhibition on expression of proteins involved in Wnt signaling. PDM-272 organoid was incubated for 3 days with DMSO (n = 4), inactive Ceapin-A7 (3 μmol/L; n = 3), or ceapin-A7 (3 μmol/L; n = 4) and subjected to global proteome analysis, as described in detail in Materials and Methods. Relative signal intensity calculated based off of abundance of specified protein relative to total protein abundance per sample. G, Effect of ATF6 inhibition on expression of proteins involved in differentiation, as described in F (n ≥ 3). CellCyc, cell cycle; DN, downregulation; UP, upregulation. ****. P < 0.0001.
Figure 8
Figure 8
Wnt surrogate restores Wnt pathway activity and growth of PDM-272 organoids in context of ATF6 inhibition. A, mRNA gene expression as determined by RT-qPCR of ATF6, Wnt signaling genes (AXIN2, LGR5, and TCF7) and Myc signaling genes (MYC and CDCA7) of PDM-272 organoid treated with Wnt surrogate fusion protein (0.015 nmol/L) in the absence or presence of Ceapin-A7 (3 μmol/L) after 2 days (n = 3). B, Confluence of PDM-272 organoid treated with Wnt surrogate fusion protein (0.01 nmol/L) in the absence or presence of Ceapin-A7 (3 μmol/L) for 10 days (n = 3). C, Viability of PDM-272 organoid, as treated in B (n = 3). D, Light microscopy images of organoids in B after 10-day treatment. E, Expression of ER13 stratified οf colonic tumor epithelial cell subtypes and divided by stem subsets and differentiated subsets. F, Expression of ATF6 as stratified cell subtypes described in E. G, Co-expression of ATF6 and known Wnt signaling (AXIN2, LGR5, and TCF7) and Myc signaling (MYC and CDCA7) for various colon cancer epithelial cell subtypes. Avg, average; imm, immature; prolif, proliferation. *, P < 0.05; ***, P < 0.001.

References

    1. Xi Y, Xu P. Global colorectal cancer burden in 2020 and projections to 2040. Transl Oncol 2021;14:101174. - PMC - PubMed
    1. Siegel RL, Giaquinto AN, Jemal A. Cancer statistics, 2024. CA Cancer J Clin 2024;74:12–49. - PubMed
    1. Cardoso R, Guo F, Heisser T, De Schutter H, Van Damme N, Nilbert MC, et al. . Overall and stage-specific survival of patients with screen-detected colorectal cancer in European countries: a population-based study in 9 countries. Lancet Reg Health Eur 2022;21:100458. - PMC - PubMed
    1. Lonardi S, Pietrantonio F. New options for late-line treatment of metastatic colorectal cancer. Nat Rev Gastroenterol Hepatol 2024;21:76–7. - PubMed
    1. Cancer Genome Atlas Network . Comprehensive molecular characterization of human colon and rectal cancer. Nature 2012;487:330–7. - PMC - PubMed

Publication types

MeSH terms

Substances