. 2024 Oct 16;15(10):e0194424.
doi: 10.1128/mbio.01944-24. Epub 2024 Sep 26.

Innate cells and STAT1-dependent signals orchestrate vaccine-induced protection against invasive Cryptococcus infection

Affiliations

Innate cells and STAT1-dependent signals orchestrate vaccine-induced protection against invasive Cryptococcus infection

Keyi Wang et al. mBio. .

Abstract

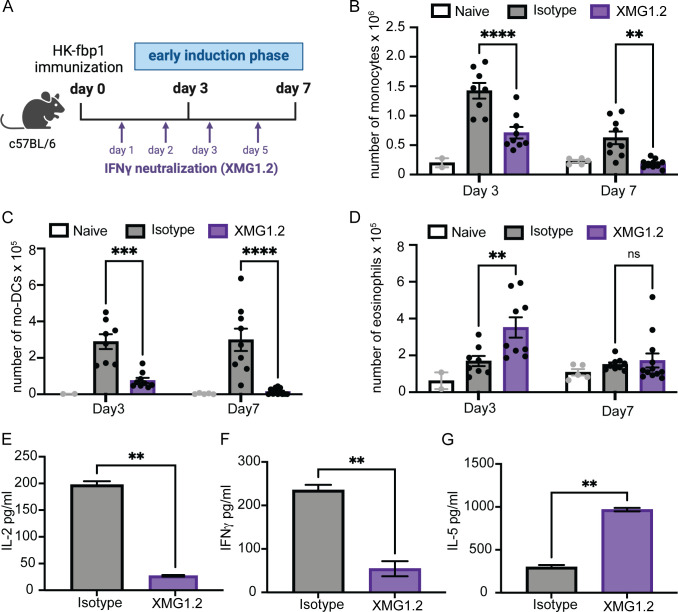
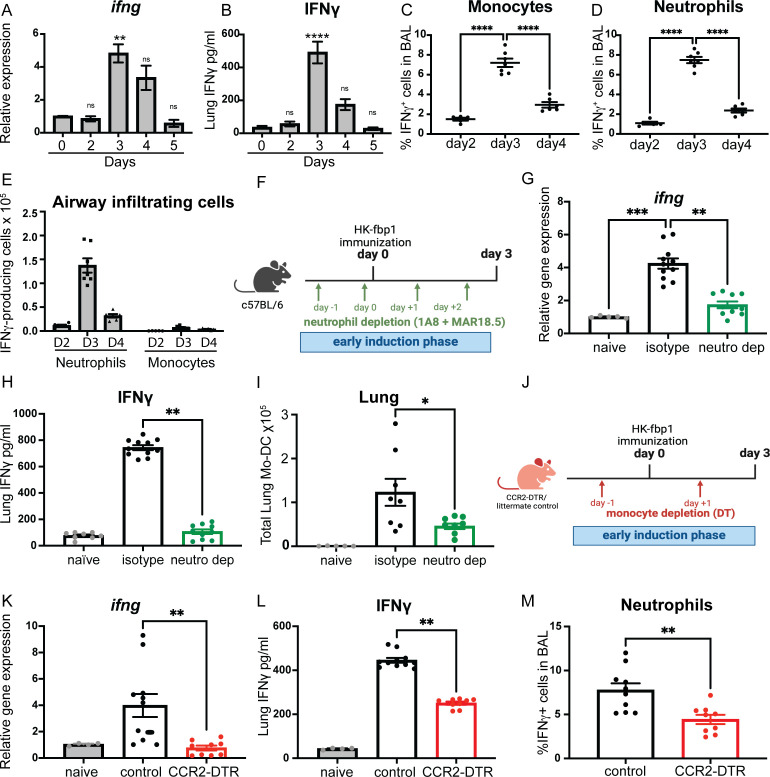
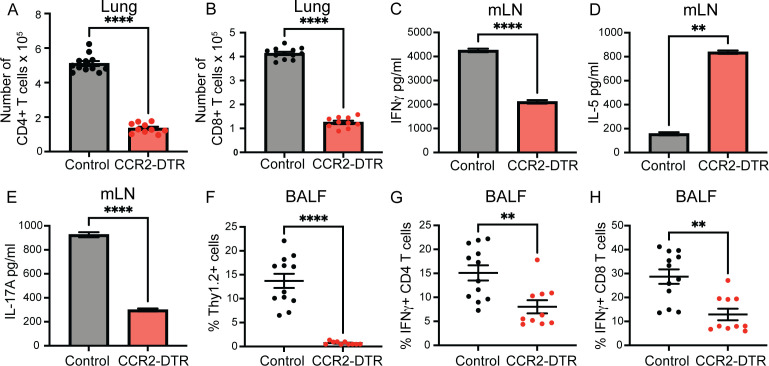
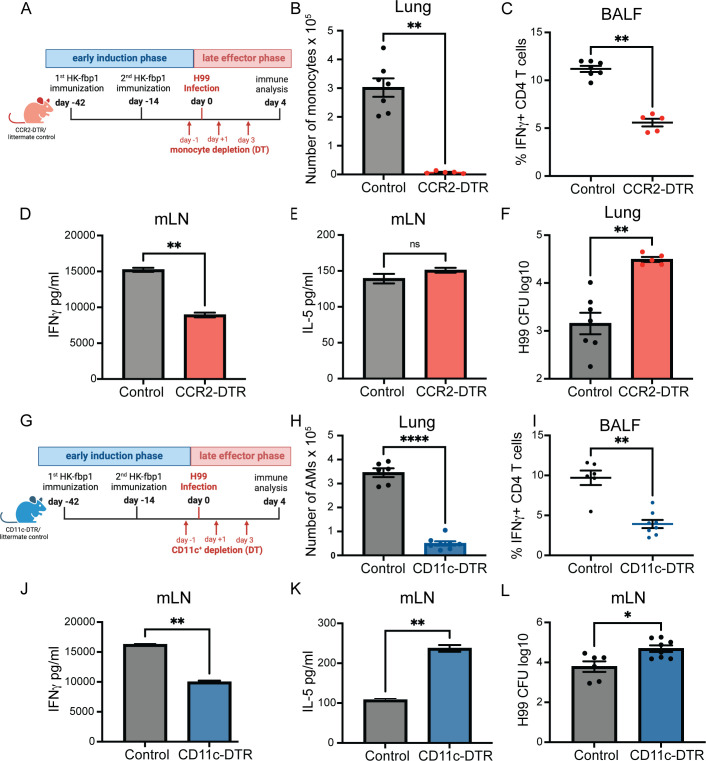
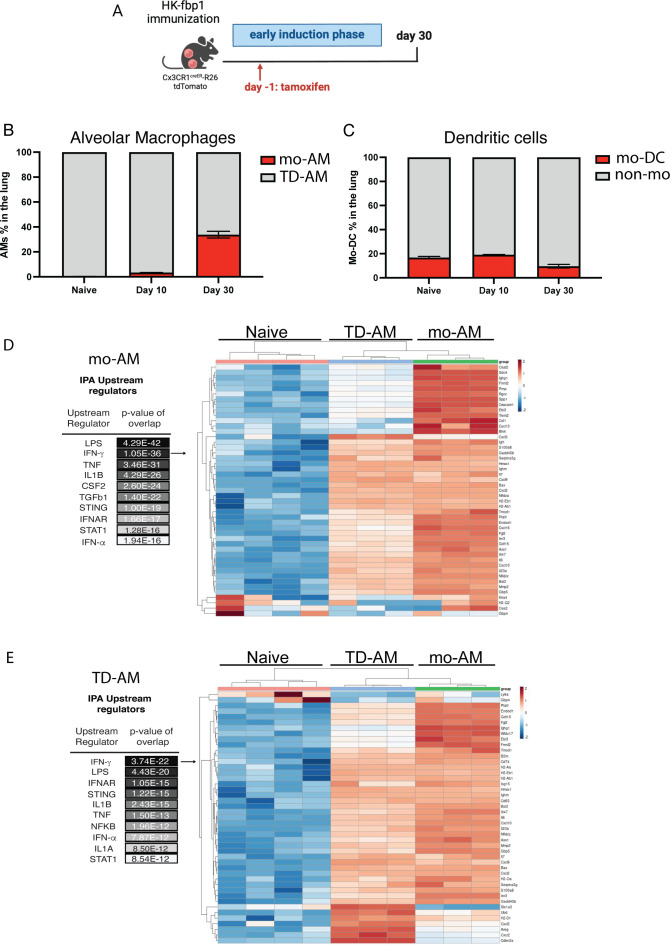
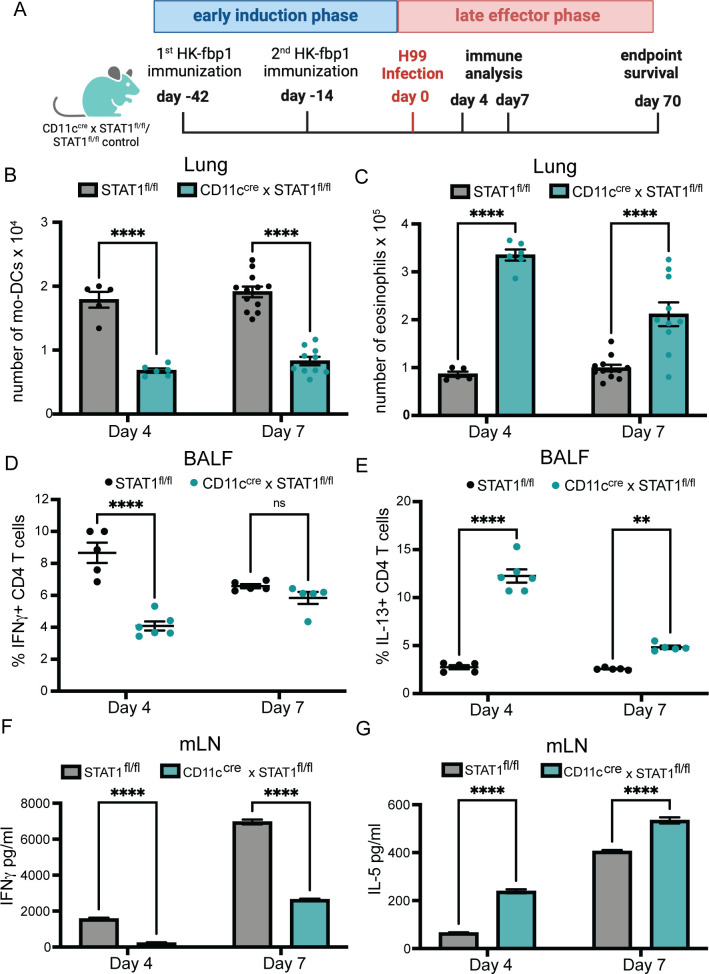
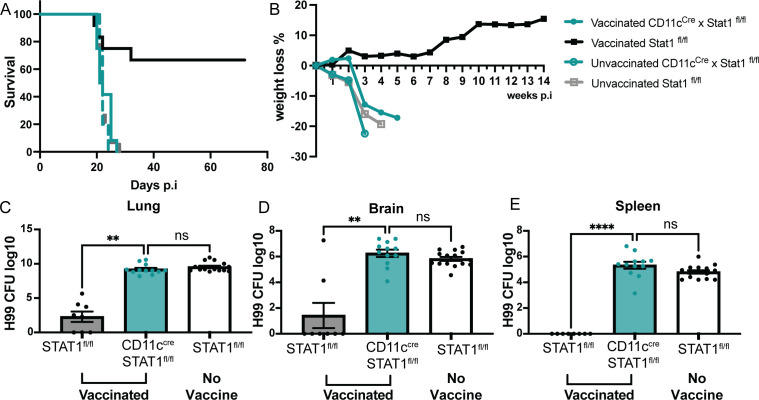
Fungal pathogens are underappreciated causes of significant morbidity and mortality worldwide. In previous studies, we determined that a heat-killed, Cryptococcus neoformans fbp1-deficient strain (HK-fbp1) is a potent vaccine candidate. We determined that vaccination with HK-fbp1 confers protective immunity against lethal Cryptococcosis in an interferon γ (IFNγ)-dependent manner. In this study, we set out to uncover cellular sources and relevant targets of the protective effects of IFNγ in response to the HK-fbp1 vaccine. We found that early IFNγ production peaks at day 3 and that monocytes and neutrophils are important sources of this cytokine after vaccination. Neutralization of IFNγ at day 3 results in impaired CCR2+ monocyte recruitment and reduced differentiation into monocyte-derived dendritic cells (Mo-DC). In turn, depletion of CCR2+ cells prior to immunization results in impaired activation of IFNγ-producing CD4 and CD8 T cells. Thus, monocytes are important targets of innate IFNγ and help promote further IFNγ production by lymphocytes. We employed monocyte-fate mapper and conditional STAT1 knockout mice to uncover that STAT1 activation in CD11c+ cells, including alveolar macrophages, Mo-DCs, and monocyte-derived macrophages (Mo-Mac) is essential for HK-fbp1 vaccine-induced protection. Altogether, our aggregate findings suggest critical roles for innate cells as orchestrators of vaccine-induced protection against Cryptococcus infection.IMPORTANCEThe number of patients susceptible to invasive fungal infections across the world continues to rise at an alarming pace yet current antifungal drugs are often inadequate. Immune-based interventions and novel antifungal vaccines hold the promise of significantly improving patient outcomes. In previous studies, we identified a Cryptococcus neoformans mutant strain (Fbp1-deficient) as a potent, heat-inactivated vaccine candidate capable of inducing homologous and heterologous antifungal protection. In this study, we used a combination of methods together with a cohort of conditional knockout mouse strains to interrogate the roles of innate cells in the orchestration of vaccine-induced antifungal protection. We uncovered novel roles for neutrophils and monocytes as coordinators of a STAT1-dependent cascade of responses that mediate vaccine-induced protection against invasive cryptococcosis. This new knowledge will help guide the future development of much-needed antifungal vaccines.

Keywords: Cryptococcus neoformans; antifungal therapy; immunization; innate immunity; monocytes; neutrophils.


Conflict of interest statement

The authors declare no conflict of interest.

Figures

Fig 1
Fig 1
IFNγ is critical for the activation of innate and adaptive responses to vaccination with HK-fbp1. (A) Graphic summary of the experimental approach. C57BL/6 (WT B6) mice were vaccinated with HK-fbp1 on day 0 and sacrificed on day 3 and day 7 post-vaccination. Mice received 200 μg of XMG1.2 or isotype control antibody for neutralization of IFNγ on days +1, +2, +3, and +5. (B to D) Immune cell populations in the lung were identified by flow cytometry as detailed in Material and Methods. (B) The total number of monocytes, Mo-DCs (C), and eosinophils (D) present in the lung at day 3 and day 7 post-vaccination. Each symbol represents one mouse. (E–G) CD4+ T cells were purified from lung-draining lymph nodes and stimulated with Cryptococcus antigens for 72 hours. Levels of IL-2, IFNγ, and IL-5 secreted after stimulation were measured in culture supernatant by ELISA. The data shown are cumulative from two independent experiments with at least five mice per group and are depicted as the mean values ± standard errors of the means. ns, not significant; **, P < 0.01; ***, P < 0.001; ****, P < 0.0001 (B to D, determined by two-way analysis of variance [ANOVA] nonparametric test for multiple comparisons; E to G, determined by nonparametric t-test using Prism software).
Fig 2
Fig 2
Monocytes and neutrophils are important sources of IFNγ during the early induction phase of HK-fbp1 vaccination. (A and B) WT B6 mice were vaccinated with HK-fbp1 5 × 10⁷ at day 0, and sacrificed on days 2, 3, 4, and 5 after vaccination. Kinetics of IFNγ RNA expression (A) and protein expression (B) in the lung of mice were analyzed at different time points after HK-fbp1 vaccination. Data shown are mean ± SEM of five mice per time point. (C and D) The frequency of IFNγ-producing innate cells after HK-fbp1 vaccination was examined by intracellular cytokine staining (ICCS). (E) The total number of IFNγ-producing innate cells recovered from BALF of mice vaccinated with HK-fbp1 2, 3, and 4 days prior to analysis. (F) Graphic summary of the experimental approach. WTB6 mice were vaccinated with HK-fbp1 on day 0 and sacrificed on day 3 post-vaccination. WT B6 mice were itraperitoneally (i.p.) injected with 100μg 1A8 antibody on day −1 and day +1. On day 0, mice were vaccinated with HK-fbp1. On day 0 and day +2, mice were i.p. injected with 100μg of MAR18.5 antibody. Control antibody 2A3 100μg was i.p. injected into mice on day −1 and day +1. (G and H) IFNγ RNA (G) and protein expression (H) were examined in the lungs of mice on day 3 after HK-fbp1 vaccination. (G) IFNγ RNA expression was determined by quantitative reverse transcription polymerase chain reaction (qRT-PCR) using TaqMan probes and normalized to GAPDH. (H) IFNγ protein level in lung homogenates was measured by ELISA. Data shown are mean ± SEM of five mice per time point. (I) Total number of Mo-DC in the lung as determined by flow cytometry. Each symbol represents one mouse. (J) Graphical summary of the experimental approach. CCR2-DTR mice and control CCR2-DTR negative littermates received 250 ng of diphtheria toxin i.p. on day −1 to vaccination and day +1 after vaccination to maintain depletion. (K and L) IFNγ RNA expression (K) and protein expression (L) in the lung of mice at day 3 after HK-fbp1 vaccination. All RNA gene expression was determined by qRT-PCR using TaqMan probes and normalized to the GAPDH housekeeping gene. Protein level was measured by ELISA. (M) Percent of IFN-γ-producing neutrophils recovered from the airways of control and CCR2-DTR mice as determined by ICCS. Each symbol represents one mouse. *, P < 0.05; **, P < 0.01; ***, P < 0.001; ****, P < 0.0001 (determined by one-way ANOVA nonparametric test for multiple comparisons using Prism software).
Fig 3
Fig 3
CCR2+ monocytes are required for CD4+ T cell differentiation and optimal entry to the airway. CCR2-DTR mice and control CCR2-DTR negative littermates mice were vaccinated with HK-fbp1 5 × 10⁷ on day 0 and sacrificed on day 7 post-vaccination. All mice received 250 ng of diphtheria toxin i.p. 1 day before vaccination and every other day post-vaccination to maintain depletion. (A and B) CD4+ and CD8+ T cell recruitment to the lungs of CCR2-depleted mice and control littermates was examined by flow cytometry. Each symbol represents one mouse. (C–E) CD4+ T cells were isolated from the lung-draining lymph node and re-stimulated with Cryptococcus antigens ex vivo for 72 hours. Secretion of IFNγ, IL-5, and IL-17A levels was examined in culture supernatant by ELISA. The data shown are mean ± SEM. (F) Percentage of total Thy1.2+ T cells recovered from BALF as analyzed by flow cytometry. Each symbol represents one mouse. (G and H) Cytokine expression was analyzed by ICCS and measured by flow cytometry. The frequencies of IFNγ-producing CD4+ T cells (G) and IFNγ-producing CD8+ T cells (H) in BALF were analyzed. Each symbol represents one mouse. Data are cumulative for three independent experiments with four mice per group. **, P < 0.01; ****, P < 0.0001 (determined by nonparametric t-test for comparison).
Fig 4
Fig 4
CCR2+ monocytes and CD11c+ cells are critical for Th1 differentiation during the late effector phase. (A) Graphical summary of the experimental approach. CCR2-DTR mice and control CCR2-DTR negative littermates were vaccinated with 5 × 10⁷ HK-fbp1 on day −42 and boosted with the same dose of vaccine on day −14. On day 0, mice were infected with live 104 H99. All mice received 250 ng of diphtheria toxin i.p. on days −1, +1, +3, and sacrificed on day 4 post-H99 infection. (B) The total number of CCR2+ monocytes in the lung was examined by flow cytometry. Each symbol represents one mouse. (C) Percentage of IFNγ-producing CD4+ T cells in the airways as measured by ICCS and flow cytometry. Each symbol represents one mouse. (D and E) CD4+ T cells were isolated from the lung-draining lymph node and re-stimulated with Cryptococcus antigens ex vivo for 72 hours. Secretion of IFNγ and IL-5 levels were examined in culture supernatant by ELISA. The data shown are mean ± SEM. (F). H99 fungal burden in the lungs of vaccinated mice infected with 104 H99 at day 4 (post-infection (p.i.). (G) Graphical summary of the experimental approach. CD11c-DTR and their WT littermate control mice were vaccinated with HK-fbp1 on day −42 and boosted with the same dose of vaccine on day −14. On day 0, mice were infected with live 104 H99. All mice received 250 ng of diphtheria toxin i.p. on day −1, +1, +3, and +5, and sacrificed on day 7 post-H99 infection. (H) The total number of Live, CD45+ SiglecF+ CD11c+ cells in the lung was examined by flow cytometry. Each symbol represents one mouse. (I) The percentage of IFNγ-producing CD4+ T cells recovered from airways was analyzed by ICCS and measured by flow cytometry. Each symbol represents one mouse. (J and K) CD4+ T cells were isolated from the lung-draining lymph node and re-stimulated with Cryptococcus antigens ex vivo for 72 hours. Secretion of IFNγ and IL-5 levels were examined in culture supernatant by ELISA. The data shown are mean ± SEM. (L) Fungal burdens in the lungs of vaccinated mice infected with 104 H99 were examined at day 7 p.i. Each symbol represents one mouse. Data are cumulative from two independent experiments with five mice per group. ns, not significant; *, P < 0.05; **, P < 0.01; ***, P < 0.001; ****, P < 0.0001 (as determined by nonparametric t-test for comparison with Prism software).
Fig 5
Fig 5
Monocyte-derived and tissue-derived AMs show evidence of sustained IFNγ gene signature. (A) CX3CR1creER × R26TdTomatofl/fl mice were vaccinated with HK-fbp1 and sacrificed on day 30 post-vaccination. (B). Percentage of AMs (CD45+ DAPI CD11c+ SiglecFhi) identified as TD-AM (TdT-) or mo-AM (TdT+) in the lung at various times after vaccination. (C) Percentage of dendritic cells (CD45+ DAPI- CD11c+ SiglecFlo) identified as mo-DCs (TdT+) or non-mo-DC (TdT-). (D) Ingenuity Pathway analysis for upstream regulators in differentially expressed genes by Mo-AM vs Naïve control. Heat map of differentially expressed, IFNγ-regulated genes between naïve AM, Mo-AM and TD-AM from HK-fbp1 vaccinated mice ranked by log2 fold change.(E). Ingenuity pathway analysis for upstream regulators in differentially expressed genes by TD-AM vs naïve control. Heat map of differentially expressed, IFNγ-regulated genes between naïve AM, Mo-AM, and TD-AM from HK-fbp1 vaccinated mice ranked by log2 fold change.
Fig 6
Fig 6
STAT1 expression on CD11c+ cells is important for maintaining Th1 responses. (A) Graphical summary of the experimental approach. CD11ccre × STAT1fl/fl and STAT1fl/fl control mice were vaccinated with HK-fbp1 on day −42 and a boost vaccine on day −14. On day 0, mice were infected with live 104 H99. Mice were sacrificed on day 4 and day 7 post-H99 infection. (B to C) The total number of Mo-DCs (B) and eosinophils (C) were examined by flow cytometry on days 4 and 7. Each symbol represents one mouse. (D to E) Cytokine expression in CD11ccre × STAT1fl/fl and STAT1fl/fl control mice was analyzed by ICCS and measured by flow cytometry at each time point. The frequencies of IFNγ- and IL-13-producing CD4+ T cells in BALF are shown. Each symbol represents one mouse. (F to G) CD4+ T cells were purified from lung-draining lymph nodes from CD11ccre × STAT1fl/fl or STAT1fl/fl control mice at each time point and stimulated with Cryptococcus antigens for 72 hours. IFN-γ and IL-5 levels were measured in culture supernatant by ELISA. The data shown are cumulative from two independent experiments with five mice per group and are depicted as the mean values ± standard errors of the means. ns, not significant; **, P < 0.01; ****, P < 0.0001 (determined by two-way ANOVA nonparametric test for multiple comparisons using Prism software).
Fig 7
Fig 7
STAT1 expression on CD11c+ cells is critical for controlling fungal dissemination and overall survival. CD11ccre × STAT1fl/fl and STAT1fl/fl control mice were vaccinated with HK-fbp1 on day −42 and a boost vaccine on day −14. On day 0, mice were infected with live 104 C. neoformans H99. (A) Survival curve of vaccinated CD11ccre × STAT1fl/fl (solid, teal line), vaccinated STAT1fl/fl (solid black line), unvaccinated CD11ccre × STAT1fl/fl (dashed teal line), and unvaccinated STAT1fl/fl (dashed gray line) after challenge with H99. (B) Changes in mouse body weight over time after H99 infection. Data for vaccinated and unvaccinated CD11ccre × STAT1fl/fl and STAT1fl/fl is shown and represented as defined in the figure legend. (C to E) H99 fungal burden was examined in lungs (C), brain (D), and spleen (E) at day 7 post-H99 infection. Each symbol represents one mouse. The data shown are cumulative from two independent experiments with five mice per group and are depicted as the mean values ± standard errors of the means. **, P < 0.01****; P < 0.0001 (C to E, as determined by one-way ANOVA nonparametric test for multiple comparisons using Prism software).

Similar articles

Cited by

References

    1. Denning DW. 2024. Global incidence and mortality of severe fungal disease. Lancet Infect Dis 24:e428–e438. doi:10.1016/S1473-3099(23)00692-8 - DOI - PubMed
    1. Arastehfar A, Gabaldón T, Garcia-Rubio R, Jenks JD, Hoenigl M, Salzer HJF, Ilkit M, Lass-Flörl C, Perlin DS. 2020. Drug-resistant fungi: an emerging challenge threatening our limited antifungal armamentarium. Antibiotics (Basel) 9:877. doi:10.3390/antibiotics9120877 - DOI - PMC - PubMed
    1. Rajasingham R, Govender NP, Jordan A, Loyse A, Shroufi A, Denning DW, Meya DB, Chiller TM, Boulware DR. 2022. The global burden of HIV-associated cryptococcal infection in adults in 2020: a modelling analysis. Lancet Infect Dis 22:1748–1755. doi:10.1016/S1473-3099(22)00499-6 - DOI - PMC - PubMed
    1. Rohatgi S, Pirofski LA. 2015. Host immunity to Cryptococcus neoformans. Future Microbiol 10:565–581. doi:10.2217/fmb.14.132 - DOI - PMC - PubMed
    1. Schop J. 2007. Protective immunity against Cryptococcus neoformans infection. McGill J Med 10:35–43. doi:10.26443/mjm.v10i1.467 - DOI - PMC - PubMed

MeSH terms