. 2024 Oct 22;98(10):e0116624.
doi: 10.1128/jvi.01166-24. Epub 2024 Sep 26.

Headless hemagglutinin-containing influenza viral particles direct immune responses toward more conserved epitopes

Affiliations

Headless hemagglutinin-containing influenza viral particles direct immune responses toward more conserved epitopes

Cait E Hamele et al. J Virol. .

Abstract

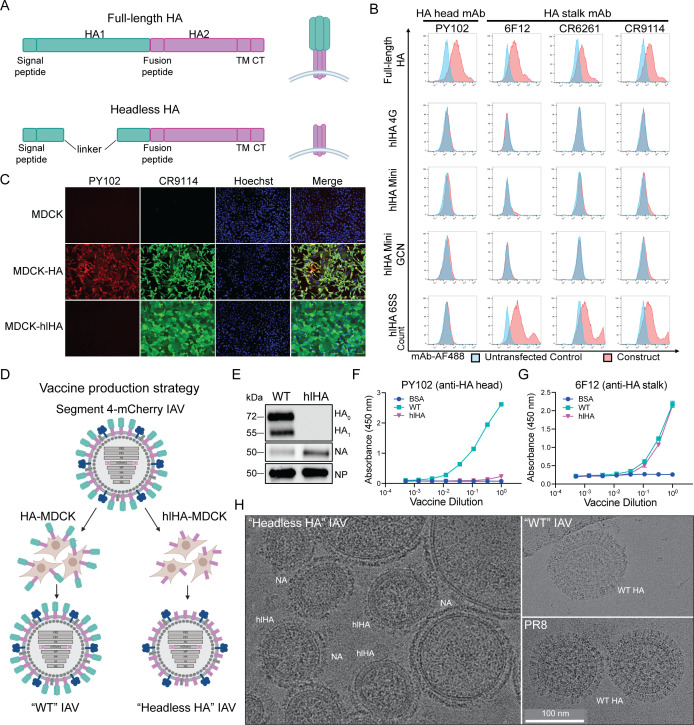
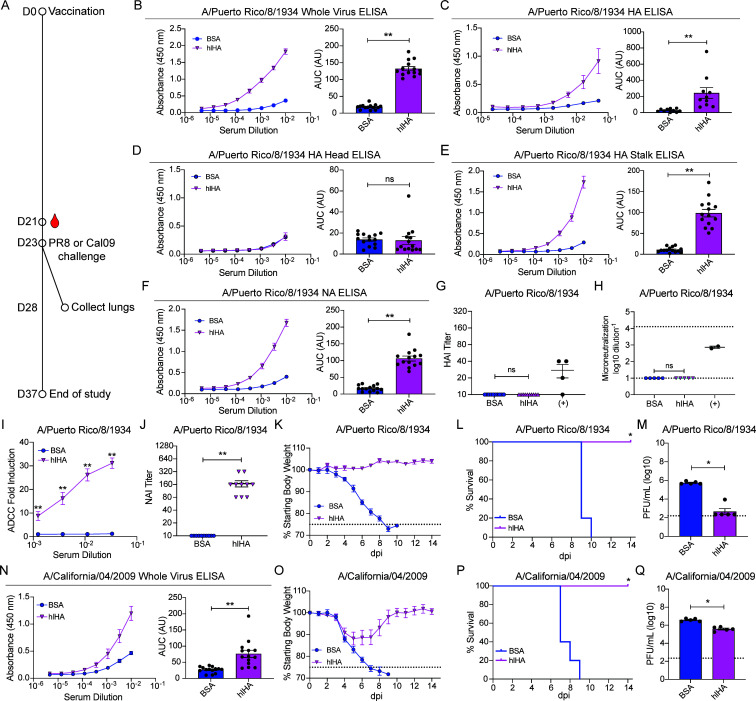
Seasonal influenza vaccines provide mostly strain-specific protection due to the elicitation of antibody responses focused on evolutionarily plastic antigenic sites in the hemagglutinin head domain. To direct the humoral response toward more conserved epitopes, we generated an influenza virus particle where the full-length hemagglutinin protein was replaced with a membrane-anchored, "headless" variant while retaining the normal complement of other viral structural proteins such as the neuraminidase as well as viral RNAs. We found that a single administration of a headless virus particle-based vaccine elicited high titers of antibodies that recognized more conserved epitopes on the major viral glycoproteins. Furthermore, the vaccine could elicit these responses even in the presence of pre-existing, hemagglutinin (HA) head-focused influenza immunity. Importantly, these antibody responses mediated protective, but non-neutralizing functions such as neuraminidase inhibition and antibody-dependent cellular cytotoxicity. Additionally, we show the vaccine can provide protection from homologous and heterologous challenges in mouse models of severe influenza without any measurable HA head-directed antibody responses. Thus, headless hemagglutinin containing viral particles may represent a tool to drive the types of antibody responses predicted to increase influenza vaccine breadth and durability.IMPORTANCECurrent seasonal influenza vaccines provide incomplete protection from disease. This is partially the result of the antibody response being directed toward parts of the virus that are tolerant of mutations. Redirecting the immune response to more conserved regions of the virus has been a central strategy of next-generation vaccine designs and approaches. Here, we develop and test a vaccine based on a modified influenza virus particle that expresses a partially deleted hemagglutinin protein along with the other viral structural proteins. We demonstrate this vaccine elicits antibodies that recognize the more conserved viral epitopes of the hemagglutinin stalk and neuraminidase protein to facilitate protection against influenza viruses despite a lack of classical viral neutralization activity.

Keywords: HA stalk; influenza A virus; neuraminidase; vaccines.


Conflict of interest statement

Duke University has filed for intellectual property protection of the vaccine production approaches and antigen designs described in this work.

Figures

Fig 1
Fig 1
Design and generation of a headless HA influenza A virus (IAV) particle. (A) Schematic of full-length HA (top) and headless HA (bottom). TM, transmembrane domain. CT, cytoplasmic tail. (B) Flow cytometry of 293T cells transfected with wild-type (WT) HA or headless HA design constructs and stained with HA head antibody PY102 or HA stalk antibodies 6F12, CR6261, and CR9114. Histograms of transfected cells overlay untransfected cells. (C) Immunofluorescence microscopy of WT Madin-Darby canine kidney (MDCK), MDCK-HA, and MDCK-hlHA cells stained with HA head antibody PY102 (red), HA stalk antibody CR9114 (green), and Hoechst (blue). Scale bar, 100 µm. (D) Schematic of production strategy for “WT” and “hlHA” influenza viruses. (E) Western blots of purified WT or hlHA virus particles probed with antibodies against HA, NA, and NP. Images are representative of three independent experiments. (F) Enzyme-linked immunosorbent assays (ELISAs) against inactivated WT or hlHA vaccine particles or bovine serum albumin (BSA) using HA head antibody PY102. Vaccine input was normalized based on NP expression. Plot is representative of four independent experiments. (G) ELISAs against inactivated WT or hlHA vaccine particles or BSA using HA stalk antibody 6F12. Vaccine input was normalized based on NP expression. Plot is representative of four independent experiments. (H) Cryogenic electron microscopy of “Headless HA” IAV particles (left), “WT”/Segment4-mCherry IAV particles (top right), and authentic WT PR8 particles (bottom right). HA and NA are segregated into distinct patches, as they are in authentic influenza particles (52). The projection through regions of stabilized stalk appears as a brush of thin spikes, potentially somewhat more closely packed than intact HA, which we expect to be about 40% longer and substantially wider at its apex than stabilized stem. The headless HA particles also display greater quantities of NA and the preparation also contains heterogeneous and large particles relative to control.
Fig 2
Fig 2
Vaccination with hlHA vaccine provides protection against homologous or heterologous H1N1 challenge. (A) Schematic of vaccination regimen and challenge. ELISAs against (B) whole A/Puerto Rico/8/1934 virions, (C) purified soluble full-length HA protein, (D) purified soluble HA head protein, (E) purified soluble HA stalk protein, (F) purified soluble NA protein using sera from BSA or hlHA vaccinated mice (left) and area under the curve analysis (right). n = 14 mice per group from three independent experiments (B, D–F), n = 10 mice per group from two independent experiments (C). AUC, area under the curve. AU, arbitrary units. (G) HAIs using sera from BSA or hlHA vaccinated mice. n = 10 mice per group from two independent experiments. Positive control, sera from A/Puerto Rico/8/1934 challenged mice (n = 4). HAI titers were calculated as the reciprocal of the last dilution of sera that inhibited hemagglutination. Values <10 were set to limit of detection (LOD) (10 HAI) for inclusion in the plot. Lines indicate mean. (H) Microneutralization assays using sera from BSA or hlHA vaccinated mice. n = 5 mice per group. Positive control, sera from A/Puerto Rico/8/1934 challenged mice (n = 2). Lines indicate mean. Dashed lines indicated dilution range. (I) Antibody-dependent cellular cytotoxicity (ADCC) bioassay using sera from BSA or hlHA vaccinated mice. ADCC induction fold change is relative to a no antibody control. n = 10 mice from two independent experiments. (J) Enzyme-linked lectin assay (ELLA) using sera from BSA or hlHA vaccinated mice. n = 10 mice per group from two independent experiments. Line shown is mean. Values <10 were set to LOD for inclusion in the plot. NAI titer is reported as the reciprocal of the lowest dilution of sera that inhibited greater than or equal to 50% NA activity. (K) Percent starting body weight of BSA or hlHA vaccinated mice challenged with A/Puerto Rico/8/1934. n = 5 mice per group. Dashed line indicates humane endpoint, loss of greater than 25% of starting body weight. (L) Kaplan-Meyer survival curve of BSA or hlHA vaccinated mice challenged with A/Puerto Rico/8/1934. n = 5 mice per group. Statistical analyses were performed using a Mantel-Cox test. (M) Quantification of A/Puerto Rico/8/1934 titers in lung homogenates of BSA or hlHA vaccinated mice. n = 5 mice per group. Dashed line indicates LOD. Samples with 0 PFU/mL were set to the LOD for inclusion in the plot. (N) ELISAs against whole A/California/04/2009 virions using sera from BSA or hlHA vaccinated mice (left) and area under the curve analysis (right). n = 14 mice per group from three independent experiments. AUC, area under the curve. AU, arbitrary units. (O) Percent starting body weight of BSA or hlHA vaccinated mice challenged with A/California/04/2009. n = 5 mice per group. Dashed line indicates humane endpoint, loss of greater than 25% of starting body weight. (P) Kaplan-Meyer survival curve of BSA or hlHA vaccinated mice challenged with A/California/04/2009. n = 5 mice per group. Statistical analyses were performed using a Mantel-Cox test. (Q) Quantification of A/California/04/2009 titers in lung homogenates of BSA or hlHA vaccinated mice. n = 5 mice per group. Dashed line indicates LOD. Statistical analyses were performed using Wilcoxon rank-sum exact tests unless otherwise indicated and false discovery rate-adjusted P-values were reported (Benjamini-Hochberg method). For all panels, *P < 0.05, **P < 0.001, ns, not significant. Error bars indicate standard error of mean (SEM).
Fig 3
Fig 3
Vaccination with hlHA boosts functional antibodies and provides protection against homologous challenge in the context of pre-immunity. (A) Schematic of establishment of pre-immunity, vaccination, and challenge. ELISAs against (B) whole A/Puerto Rico/8/1934 virions, (C) purified soluble HA head, (D) purified soluble HA stalk, (E) purified soluble NA using sera from mice ± pre-existing immunity then vaccinated with BSA or hlHA (left) and area under the curve analysis (right). n = 10 mice per group from two independent experiments. AUC, area under the curve. AU, arbitrary units. (F) HAIs using sera from mice ± pre-existing immunity then vaccinated with BSA or hlHA. n = 10 mice per group from two independent experiments. Values <10 were set to limit of detection (LOD) for inclusion in the plot. Lines indicate mean. (G) Microneutralization assays using sera from mice ± pre-existing immunity then vaccinated with BSA or hlHA. n = 5 mice per group. Lines indicate mean. Dashed lines indicate the range of dilution. (H) ADCC bioassay using sera from mice ± pre-existing immunity then vaccinated with BSA or hlHA. ADCC induction fold change is relative to a no antibody control. n = 5 mice per group. Stars indicate statistics between pre-immune/BSA and pre-immune/hlHA samples. (I) Enzyme-linked lectin assay (ELLA) using sera from mice ± pre-existing immunity then vaccinated with BSA or hlHA. n = 10 mice per group from two independent experiments. NAI titer is reported as the reciprocal of the lowest dilution of sera that inhibited greater than or equal to 50% NA activity. Line equals mean NAI titer. Values <10 were set to LOD for inclusion in the plot. (J) Percent starting body weight of mice possessing pre-existing immunity to BSA or WT then vaccinated with BSA or hlHA. Mice were challenged with A/Puerto Rico/8/1934. n = 5 mice per group. Dashed line indicates humane endpoint, loss of greater than 25% of starting body weight. (K) Kaplan-Meyer survival curve of mice possessing pre-existing immunity to BSA or WT then vaccinated with BSA or hlHA then challenged with A/Puerto Rico/8/1934. n = 5 mice per group. Statistical analyses were performed using a Mantel-Cox test. Asterisks represent statistical analyses performed between naive/BSA and pre-immune/BSA or naive/BSA and pre-immune/hlHA group. (L) Quantification of A/Puerto Rico/8/1934 titers in lung homogenates of mice possessing pre-existing immunity to BSA or WT then vaccinated with BSA or hlHA. n = 5 mice per group. Dashed line indicates LOD. Samples with 0 PFU/mL were set to the LOD for inclusion in the plot. Statistical analyses were performed using Wilcoxon rank-sum exact tests unless otherwise indicated and false discovery rate-adjusted P-values were reported (Benjamini-Hochberg method). For all panels, *P < 0.05, **P < 0.001, ns, not significant. Error bars indicate standard error of mean (SEM).
Fig 4
Fig 4
Vaccination with hlHA boosts functional antibodies and provides protection against heterologous challenge in the context of pre-immunity. (A) Schematic of vaccination and challenge regimen. (B) ELISAs against whole A/California/04/2009 virions using sera from mice possessing pre-existing immunity to BSA or WT then vaccinated with BSA or hlHA (left) and area under the curve analysis (right). n = 10 mice per group from two independent experiments. (C) HAIs using sera from mice possessing pre-existing immunity to BSA or WT then vaccinated with BSA or hlHA. n = 10 mice per group from two independent experiments. Positive control, sera from A/California/04/2009 challenged mice. Lines indicate mean. (D) Microneutralization assays using sera from mice possessing pre-existing immunity to BSA or WT then vaccinated with BSA or hlHA. n = 5 mice per group. Lines indicate mean. Dashed lines indicate range of dilution. (E) ADCC bioassay using sera from mice possessing pre-existing immunity to BSA or WT then vaccinated with BSA or hlHA. ADCC induction fold change is relative to a no antibody control. n = 5 mice per group. Stars indicate statistics performed between pre-immune/BSA and pre-immune/hlHA groups. (F) Enzyme-linked lectin assay (ELLA) using sera from mice possessing pre-existing immunity to BSA or WT then vaccinated with BSA or hlHA. n = 8–10 mice per group from two independent experiments. NAI titer is reported as the reciprocal of the lowest dilution of sera that inhibited greater than or equal to 50% NA activity. Line equals mean NAI titer. Values <10 were set to limit of detection (LOD) (10) for inclusion in the plot. (G) Percent starting body weight of mice possessing pre-existing immunity to BSA or WT then vaccinated with BSA or hlHA. Mice were challenged with A/California/04/2009. n = 5 mice per group. Dashed line indicates humane endpoint, loss of greater than 25% of starting body weight. (H) Kaplan-Meyer survival curve of mice possessing pre-existing immunity to BSA or WT then vaccinated with BSA or hlHA and challenged with A/California/04/2009. n = 5 mice per group. Statistical analyses were performed using a Mantel-Cox test. Asterisks represent statistical analyses performed between naive/BSA and indicated group. (I) Quantification of A/California/04/2009 titers in lung homogenates of mice possessing pre-existing immunity to BSA or WT then vaccinated with BSA or hlHA. n = 5 mice per group. Dashed line indicates LOD. Statistical analyses were performed using Wilcoxon rank-sum exact tests unless otherwise indicated and false discovery rate-adjusted P-values were reported (Benjamini-Hochberg method). For all panels, *P < 0.05, **P < 0.001, ns, not significant. Error bars indicate standard error of mean (SEM).

Similar articles

Cited by

References

    1. WHO . 2023. Estimating disease burden of influenza. Available from: https://www.who.int/europe/activities/estimating-disease-burden-of-influ.... Retrieved 1 Jul 2021.
    1. Krammer F, Palese P. 2015. Advances in the development of influenza virus vaccines. Nat Rev Drug Discov 14:167–182. doi:10.1038/nrd4529 - DOI - PubMed
    1. Hobson D, Curry RL, Beare AS, Ward-Gardner A. 1972. The role of serum haemagglutination-inhibiting antibody in protection against challenge infection with influenza A2 and B viruses. J Hyg (Lond) 70:767–777. doi:10.1017/s0022172400022610 - DOI - PMC - PubMed
    1. Ohmit SE, Petrie JG, Cross RT, Johnson E, Monto AS. 2011. Influenza hemagglutination-inhibition antibody titer as a correlate of vaccine-induced protection. J Infect Dis 204:1879–1885. doi:10.1093/infdis/jir661 - DOI - PubMed
    1. Heaton NS, Sachs D, Chen CJ, Hai R, Palese P. 2013. Genome-wide mutagenesis of influenza virus reveals unique plasticity of the hemagglutinin and NS1 proteins. Proc Natl Acad Sci U S A 110:20248–20253. doi:10.1073/pnas.1320524110 - DOI - PMC - PubMed

MeSH terms

LinkOut - more resources