. 2024 Nov 12;92(11):e0034524.
doi: 10.1128/iai.00345-24. Epub 2024 Sep 26.

Synergistic blockade of TIGIT and PD-L1 increases type-1 inflammation and improves parasite control during murine blood-stage Plasmodium yoelii non-lethal infection

Affiliations

Synergistic blockade of TIGIT and PD-L1 increases type-1 inflammation and improves parasite control during murine blood-stage Plasmodium yoelii non-lethal infection

Rebecca S Dookie et al. Infect Immun. .

Abstract

Pro-inflammatory immune responses are rapidly suppressed during blood-stage malaria but the molecular mechanisms driving this regulation are still incompletely understood. In this study, we show that the co-inhibitory receptors TIGIT and PD-1 are upregulated and co-expressed by antigen-specific CD4+ T cells (ovalbumin-specific OT-II cells) during non-lethal Plasmodium yoelii expressing ovalbumin (PyNL-OVA) blood-stage infection. Synergistic blockade of TIGIT and PD-L1, but not individual blockade of each receptor, during the early stages of infection significantly improved parasite control during the peak stages (days 10-15) of infection. Mechanistically, this protection was correlated with significantly increased plasma levels of IFN-γ, TNF, and IL-2, and an increase in the frequencies of IFN-γ-producing antigen-specific T-bet+ CD4+ T cells (OT-II cells), but not antigen-specific CD8+ T cells (OT-I cells), along with expansion of the splenic red pulp and monocyte-derived macrophage populations. Collectively, our study identifies a novel role for TIGIT in combination with the PD1-PD-L1 axis in regulating specific components of the pro-inflammatory immune response and restricting parasite control during the acute stages of blood-stage PyNL infection.

Keywords: CD4+ T cell; Plasmodium; checkpoint molecules; immune regulation; malaria.


Conflict of interest statement

The authors declare no conflict of interest.

Figures
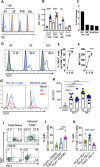
Fig 1
Fig 1
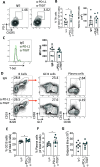
TIGIT is highly expressed in combination with PD-1 on antigen-specific CD4+ T cells during PyNL-OVA infection (A–F) C57BL/6 mice were infected (i.v.) with 1 × 10⁴ PyNL-OVA pRBC. Spleens were removed on (A–C) days 0 and 15 of infection and (D–F) days 0, 5, and 15 of infection. (A) Representative histogram showing TIGIT expression on gated splenic immune cell populations on day 15 (colored lines) compared with day 0 (shaded line) of infection. (B) Mean fluorescence intensity of TIGIT expression on splenic immune populations from naïve (open circles) and infected (D15) mice (filled circles). (C) Fold change in MFI expression of TIGIT on splenic immune cells on day 15 of infection relative to expression on immune cells in naïve mice. (D) Representative histograms showing TIGIT expression by gated CD4+ T cells on days 0, 5, and 15 (colored lines) compared with FMO (shaded line). (E) The percentages of splenic CD4+ T cells expressing TIGIT and (F) The mean fluorescence intensity of TIGIT expression by splenic CD4+ T cells on days 0, 5, and 15 of infection. (G–K) 1 × 10⁶ CD45.1+ OT-II cells were adoptively transferred into C57BL/6 mice prior to infection with PyNL -OVA pRBC. Spleens were removed on days 0, 5, and 15 of infection. (G) Representative histograms showing TIGIT expression by T-bet+ (Th1) OT-II and PD1hiCXCR5hi (Tfh) OT-II CD44+ T cells during infection, compared with OT-II cells from naïve mice. (H) Mean fluorescence intensity of TIGIT expression on Th1 and Tfh OT-II CD44+ T cells on days 5 and 15 of infection, compared with expression by naïve OT-II cells. (I) Representative dot plots and (J and K) calculated percentages of T-bet+ Th1 OT-II CD44+ T cells expressing (J) TIGIT and CD226 and (K) TIGIT and PD-1 on day 15 of infection. Results are combined from two independent experiments (n = 4 per group per experiment: total n = 8). Bars represent mean ± SEM. **P ≤ 0.01, ***P ≤ 0.001, ****P ≤ 0.001 [(B, H, J and K), two-way ANOVA with Tukey’s multiple comparison test; (E and F), one-way ANOVA with Tukey’s multiple comparison test].
Fig 2
Fig 2
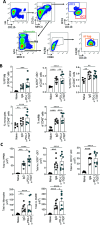
Co-blockade of TIGIT and PD-L1 significantly increases parasite control and augments IFN-γ responses during PyNL-OVA infection 1 × 10⁶ CD45.1+ OT II cells with 1 × 10⁵ CD45.1+ OT-I cells were adoptively transferred into C57BL/6 mice prior to (i.v.) infection with 1 × 10⁴ PyNL-OVA pRBC. Mice were either treated with control rat IgG (n = 4) or 250 µg α-TIGIT and 250 µg α-PD-L1 (n = 4) from day 5 p.i. (A) Peripheral parasitemia and (B) weight loss and RBC numbers were monitored over the course of the infection. (C) Quantification of plasma cytokines IFN-γ, TNF, IL-10, and IL-2 on day 15 p.i. (D–I) Spleens were removed on day 15 for analysis of (D–G) OT-II cells and (H–I) OT-I cells. (D) Representative flow cytometry plots showing T-bet expression by OT-II CD44+ T cells. (E) Frequencies (left) and total numbers (right) of splenic T-bet+ OT-II CD44+ T cells. (F–I) Splenocytes from control and α-TIGIT and α-PD-L1-treated mice were stimulated with PMA and ionomycin and stained for IFN-γ and TNFα. (F) Representative flow cytometry plots showing IFN-γ and TNFα production by T-bet+ OT-II CD44+ T cells. (G) Frequencies (left) and total numbers (right) of T-bet+ OT-II CD44+ T cells co-producing IFN-γ and TNFα. (H) Representative flow cytometry plots showing IFN-γ and TNFα production by OT-I CD44+ T cells. (I) Frequencies (left) and total numbers (right) of OT-I CD44+ T cells co-producing IFN-γ and TNFα. Results are combined from two independent experiments (n = 4 per group per experiment: total n = 8). Bars represent mean ± SEM. *P ≤ 0.05, **P ≤ 0.01, ***P ≤ 0.001, ****P ≤ 0.001 [(A, B) Unpaired t test; (C, E, G, I) two-way ANOVA with Tukey’s multiple comparison test].
Fig 3
Fig 3
Co-blockade of TIGIT and PD-L1 does not increase parasite-specific antibody production during PyNL-OVA infection 1 × 10⁶ CD45.1+ OT II cells were adoptively transferred into C57BL/6 mice prior to infection (i.v.) with 1 × 10⁴ PyNL -OVA pRBC. Mice were either treated with control rat IgG (n = 4) or 250 µg α-TIGIT and 250 µg α-PD-L1 (n = 4) from day 5 p.i. Spleens were removed on day 15 of infection. (A) Representative dot plots showing identification of PD-1+CXCR5+ (Tfh) OT-II CD44+ cells and (B) the percentages and numbers of splenic Tfh OT-II CD44+ cells on day 15 of infection. (C) Representative histogram showing the expression of T-bet by Tfh OT-II CD44+ T cells and the mean fluorescence intensity of T-bet in gated Tfh OT-II CD44+ T cells on day 15 of infection. (D) Representative dot plots showing (left column) the gating of CD19+B220+ B cells, (middle column) identification of GL7+CD38- germinal center B cells, (right column) CD138+CD38 plasma cells. (E and F) The percentages of splenic (E) GC B cells and (F) plasma cells on day 15 of infection. (G) The end point titer of anti-MSP119 IgG in the plasma on day 15 of infection. Results are combined from two independent experiments (n = 4 per group per experiment: total n = 8). Bars represent mean ± SEM. *P ≤ 0.05 [(B, C, E, F, G) two-way ANOVA with Tukey’s multiple comparison test].
Fig 4
Fig 4
Co-blockade of TIGIT and PD-L1 does not remodel the Foxp3+ regulatory T cell compartment during PyNL-OVA infection C57BL/6 mice were infected (i.v.) with 1 × 10⁴ PyNL-OVA pRBC. (A) Representative dot plots showing the identification of endogenous CD4+ T cell subsets. (B) Representative histogram showing the expression of TIGIT by splenic CD4+ T cell subsets on day 15 of infection. (C) The mean fluorescence intensity of TIGIT on splenic CD4+ T cell subsets on day 15 of infection. (D) Representative histogram showing the expression of PD-1 by TIGIT+ and TIGIT Tregs and the mean fluorescence intensity of PD-1 in gated splenic TIGIT+ and TIGIT Treg cells on day 15 of infection. (E–J) Mice were either treated with control rat IgG (n = 4) or 250 µg α-TIGIT and 250 µg α-PD-L1 (n = 4) from day 5 p.i. Spleens were removed on day 15 of infection. (E) Representative dot plots showing gating of Foxp3+CD25+ CD4+ Tregs and (F) the percentages and numbers of splenic Treg cells on day 15 of infection. (G) Representative histograms showing the expression of PD-1 and Foxp3 by gated splenic Treg cells and (H) the mean fluorescence intensity of PD-1 and Foxp3 expression by gated splenic Tregs on day 15 of infection. (I) Representative dot plots showing the expression of T-bet by gated splenic Treg cells and (J) the percentages of splenic Treg cells expressing T-bet on day 15 of infection. Results are combined from two independent experiments (n = 4 per group per experiment: total n = 8). Bars represent mean ± SEM. *P ≤ 0.05, ***P ≤ 0.001, ****P ≤ 0.001 [(C, D, F, H, J) two-way ANOVA with Tukey’s multiple comparison test].
Fig 5
Fig 5
Co-blockade of TIGIT and PD-L1 promotes expansion of splenic red pulp macrophages during PyNL-OVA infection C57BL/6 mice were infected (i.v.) with 1 × 10⁴ PyNL-OVA pRBC. Mice were either treated with control rat IgG (n = 4) or 250 µg α-TIGIT and 250 µg α-PD-L1 (n = 4) from day 5 p.i. Spleens were removed on day 15 of infection. (A) Representative dot plots showing the identification of splenic myeloid cell and dendritic cell populations. (B) The percentages and (C) total numbers of red pulp macrophages, cDC1, cDC2, monocytes, and monocyte-derived macrophages on day 15 of infection. Results are combined from two independent experiments (n = 4 per group per experiment: total n = 8). Bars represent mean ± SEM. *P ≤ 0.05, **P ≤ 0.01, ***P ≤ 0.001, ****P ≤ 0.001 [(B, C) two-way ANOVA with Tukey’s multiple comparison test].

Similar articles

References

    1. Kurup SP, Butler NS, Harty JT. 2019. T cell-mediated immunity to malaria. Nat Rev Immunol 19:457–471. doi:10.1038/s41577-019-0158-z - DOI - PMC - PubMed
    1. Perez-Mazliah D, Langhorne J. 2014. CD4 T-cell subsets in malaria: TH1/TH2 revisited. Front Immunol 5:671. doi:10.3389/fimmu.2014.00671 - DOI - PMC - PubMed
    1. Kumar R, Loughland JR, Ng SS, Boyle MJ, Engwerda CR. 2020. The regulation of CD4(+) T cells during malaria. Immunol Rev 293:70–87. doi: 10.1111/imr.12804 - DOI - PubMed
    1. Abel A, Steeg C, Aminkiah F, Addai-Mensah O, Addo M, Gagliani N, Casar C, Yar DD, Owusu-Dabo E, Jacobs T, Mackroth MS. 2018. Differential expression pattern of co-inhibitory molecules on CD4+ T cells in uncomplicated versus complicated malaria. Sci Rep 8:4789. doi:10.1038/s41598-018-22659-1 - DOI - PMC - PubMed
    1. Brandi J, Lehmann C, Kaminski LC, Schulze Zur Wiesch J, Addo M, Ramharter M, Mackroth M, Jacobs T, Riehn M. 2022. T cells expressing multiple co-inhibitory molecules in acute malaria are not exhausted but exert a suppressive function in mice. Eur J Immunol 52:312–327. doi:10.1002/eji.202149424 - DOI - PubMed

Publication types

LinkOut - more resources