. 2024 Nov 12;92(11):e0028424.
doi: 10.1128/iai.00284-24. Epub 2024 Sep 26.

Orientia tsutsugamushi infection reduces host gluconeogenic but not glycolytic substrates

Affiliations

Orientia tsutsugamushi infection reduces host gluconeogenic but not glycolytic substrates

Savannah E Sanchez et al. Infect Immun. .

Abstract

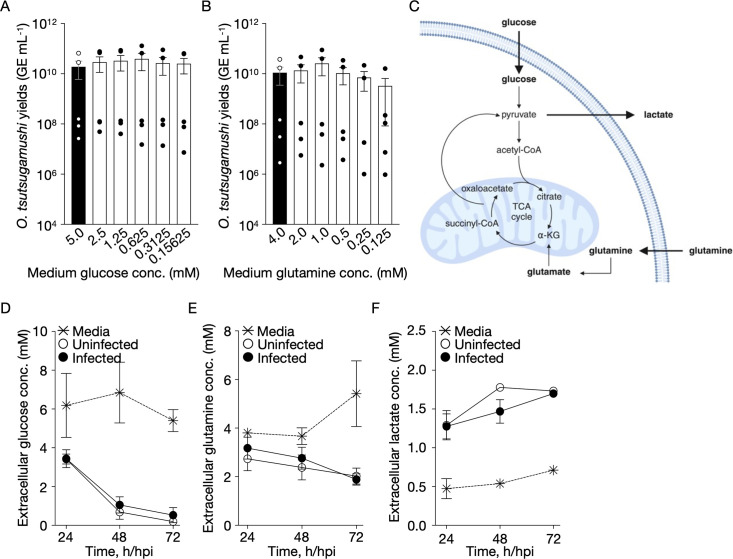
Orientia tsutsugamushi a causal agent of scrub typhus, is an obligate intracellular bacterium that, akin to other rickettsiae, is dependent on host cell-derived nutrients for survival and thus pathogenesis. Based on limited experimental evidence and genome-based in silico predictions, O. tsutsugamushi is hypothesized to parasitize host central carbon metabolism (CCM). Here, we (re-)evaluated O. tsutsugamushi dependency on host cell CCM as initiated by glucose and glutamine. Orientia infection had no effect on host glucose and glutamine consumption or lactate accumulation, indicating no change in overall flux through CCM. However, host cell mitochondrial activity and ATP levels were reduced during infection and correspond with lower intracellular glutamine and glutamate pools. To further probe the essentiality of host CCM in O. tsutsugamushi proliferation, we developed a minimal medium for host cell cultivation and paired it with chemical inhibitors to restrict the intermediates and processes related to glucose and glutamine metabolism. These conditions failed to negatively impact O. tsutsugamushi intracellular growth, suggesting the bacterium is adept at scavenging from host CCM. Accordingly, untargeted metabolomics was utilized to evaluate minor changes in host CCM metabolic intermediates across O. tsutsugamushi infection and revealed that pathogen proliferation corresponds with reductions in critical CCM building blocks, including amino acids and TCA cycle intermediates, as well as increases in lipid catabolism. This study directly correlates O. tsutsugamushi proliferation to alterations in host CCM and identifies metabolic intermediates that are likely critical for pathogen fitness.IMPORTANCEObligate intracellular bacterial pathogens have evolved strategies to reside and proliferate within the eukaryotic intracellular environment. At the crux of this parasitism is the balance between host and pathogen metabolic requirements. The physiological basis driving O. tsutsugamushi dependency on its mammalian host remains undefined. By evaluating alterations in host metabolism during O. tsutsugamushi proliferation, we discovered that bacterial growth is independent of the host's nutritional environment but appears dependent on host gluconeogenic substrates, including amino acids. Given that O. tsutsugamushi replication is essential for its virulence, this study provides experimental evidence for the first time in the post-genomic era of metabolic intermediates potentially parasitized by a scrub typhus agent.

Keywords: Orientia tsutsugamushi; Rickettsiales; amino acid parasitism; central carbon metabolism; intracellular pathogen; nutrient parasitism; obligate intracellular bacterium; rickettsial disease; scrub typhus; untargeted metabolomics.


Conflict of interest statement

The authors declare no conflict of interest.

Figures

Fig 1
Fig 1
O. tsutsugamushi growth is host cell type dependent. (A) Schematic depicting the primary flux of metabolites through central carbon metabolism for HeLa cells versus EA.hy926 cells. O. tsutsugamushi growth dynamics during infection of (B) HeLa and (C) EA.hy926 cells cultured in complete Roswell Park Memorial Institute (RPMI) 1640 or Dulbecco’s modified Eagle’s medium (DMEM), respectively. Growth was determined via quantification of GE every 12 hpi for a total of 84 hpi. Depicted data illustrate means ± SEM (N = 3). (D) O. tsutsugamushi infection progression in HeLa and EA.hy926 cells were visualized by immunofluorescence microscopy at 8, 24, 48, and 72 hpi (N = 4). Representative immunofluorescence images are presented. Host cell nuclei are stained with 4′,6-diamidino-2-phenylindole (DAPI) (cyan) and O. tsutsugamushi immunolabeled with TSA56 antibody (red). Scale bar, 40 µm.
Fig 2
Fig 2
O. tsutsugamushi infection does not alter CCM flux. To assess the influence of exogenously supplied CCM metabolites on O. tsutsugamushi intracellular replication, EA.hy926 cells were infected with O. tsutsugamushi and cultured in a medium containing a concentration gradient of (A) glucose or (B) glutamine. O. tsutsugamushi yields were measured at 72 hpi. Bars represent means ± SEM. Symbols depict independent experiments (N = 4–5). Filled bars denote control conditions. (C) Assessment of overall flux through CCM can be determined by monitoring the catabolism of glucose and glutamine, which both generate lactate, as depicted in the schematic. To determine whether O. tsutsugamushi infection alters the rate at which host cells catabolize carbon sources, media (D) glucose, (E) glutamine, and (F) lactate concentrations were measured for uninfected and O. tsutsugamushi-infected EA.hy926 cells at 24, 48, and 72 h/hpi, as compared to media alone. Bars represent means ± SEM. Symbols depict independent experiments (N = 3–5).
Fig 3
Fig 3
O. tsutsugamushi-infected cells exhibit reduced CCM metabolic activity. To assess CCM energy production as a proxy for metabolic activity, (A) ATP concentrations and (B) mitochondrial activity using an MTT assay were measured in uninfected and O. tsutsugamushi-infected EA.hy926 cells at 24, 48, and 72 h/hpi. Bars represent means ± SEM and circles depict independent experiments (N = 5–7). *, P < 0.05 (paired Student’s t test).
Fig 4
Fig 4
O. tsutsugamushi infection reduces Intracellular glutamine and glutamate pools. Intracellular concentrations of (A) glucose, (B) glutamine, and (C) glutamate in uninfected or O. tsutsugamushi-infected EA.hy926 cells were quantified at 24, 48, and 72 h/hpi. Data are presented as means ± SEM. Circles depict independent experiments (N = 7). *, P < 0.05 (paired Student’s t test).
Fig 5
Fig 5
O. tsutsugamushi exhibits comparable replication in host cells maintained under reduced nutrient conditions. (A) Host proliferation, as measured by direct cell counts, was quantified for uninfected EA.hy926 cells cultivated in ctrlDMEM and redDMEM at 24 h post-treatment. To assess whether redDMEM provides a nutritionally reduced environment at the onset of infection, intracellular and extracellular (B) glucose and (C) glutamine in addition to intracellular (D) glutamate concentrations were measured for uninfected EA.hy926 cells at 24 h post-treatment, as compared to ctrlDMEM. Bars represent means ± SEM. Circles depict independent experiments (N = 5). (E) O. tsutsugamushi growth in EA.hy926 cells cultured in ctrlDMEM versus redDMEM was assessed by quantifying GE at 8, 24, 48, and 72 hpi. Circles represent means ± SEM (N = 5). *, P < 0.05 (paired Student’s t test). (F) O. tsutsugamushi intracellular proliferation was visualized by immunofluorescence microscopy at 8, 24, 48, and 72 hpi (N = 4). Representative immunofluorescence images are presented. Host cell nuclei are stained with DAPI (cyan) and O. tsutsugamushi immunolabeled with TSA56 antibody (red). The dashed line regions at 72 hpi are magnified in the solid line demarcated insets to highlight visual differences in the O. tsutsugamushi microcolony area. Scale bar, 40 µm.
Fig 6
Fig 6
Impaired host glycolysis or glutaminolysis fails to restrict O. tsutsugamushi intracellular proliferation. (A) Host proliferation, as measured by direct cell counts, was quantified for uninfected EA.hy926 cells cultivated in redDMEM supplemented with a competitive glucose inhibitor, 2-DG, or glutaminase inhibitor, BPTES, at 24 h post-treatment. To assess if redDMEM supplemented 2-DG or BPTES further reduces the nutritional environment, intracellular and extracellular (B) glucose, and (C) glutamine in addition to intracellular (D) glutamate concentrations were measured in uninfected EA.hy926 cells at 24 h post-treatment, as compared to redDMEM. Bars represent means ± SEM. Circles depict independent experiments (N = 4–5). *, P < 0.05 (paired Student’s t test). (E) O. tsutsugamushi-infected EA.hy926 cells were grown in the presence or absence of 2-DG or BPTES and bacterial growth was measured by quantifying GE at 8, 24, 48, and 72 hpi. Symbols represent means ± SEM (N = 3). (F) Representative immunofluorescence micrographs are provided per condition as a qualitative assessment of O. tsutsugamushi intracellular proliferation (N = 4). Host cell nuclei are stained with DAPI (cyan) and O. tsutsugamushi immunolabeled with TSA56 antibody (red). Scale bar, 40 µm.
Fig 7
Fig 7
Changes in host CCM metabolic intermediates during O. tsutsugamushi infection. Untargeted metabolomics was performed on uninfected or O. tsutsugamushi-infected EA.hy926 cells at 8, 48, and 72 h/hpi. Median metabolite Z-scores (N = 7) are presented in a heatmap and ordered per biosynthetic pathway.
Fig 8
Fig 8
Host cell amino acid abundances are significantly altered during O. tsutsugamushi infection. To identify significantly altered metabolites in O. tsutsugamushi-infected EA.hy926 cells as compared to uninfected cells volcano plots were generated for (A) 8-, (B) 48-, and (C) 72-hpi GC-MS data sets. Dark gray circles denote metabolites not significantly altered; blue circles denote metabolites with a significant P value; and yellow circles denote metabolites with a significant P value and FC. The dashed line indicates a P value cutoff of 0.1. The region shaded light gray represents an FC cutoff of −1.25 > FC > 1.25.
Fig 9
Fig 9
Working model of the host CCM response during O. tsutsugamushi infection. During infection with O. tsutsugamushi, EA.hy926 cells exhibit increased levels of amino acid and, to a lesser extent, lipid oxidation. These signatures are likely a response to a shift in the metabolic state of the host as a result of the burden placed on critical CCM metabolites due to O. tsutsugamushi proliferation. Results from direct metabolite quantifications at 48 hpi are denoted by a minus sign (unchanged) or down arrow (reduced). Results from untargeted metabolomics at 48 hpi are denoted as bolded text (P < 0.1) and color (fold change). P, phosphate; CoA, coenzyme A; αKG, alpha-ketoglutarate; KIC, ketoisocaproic acid.

Similar articles

Cited by

References

    1. Carpenter BM, Whitmire JM, Merrell DS. 2009. This is not your mother’s repressor: the complex role of fur in pathogenesis. Infect Immun 77:2590–2601. doi:10.1128/IAI.00116-09 - DOI - PMC - PubMed
    1. Cassat JE, Skaar EP. 2012. Metal ion acquisition in Staphylococcus aureus: overcoming nutritional immunity. Semin Immunopathol 34:215–235. doi:10.1007/s00281-011-0294-4 - DOI - PMC - PubMed
    1. Cassat JE, Skaar EP. 2013. Iron in infection and immunity. Cell Host Microbe 13:509–519. doi:10.1016/j.chom.2013.04.010 - DOI - PMC - PubMed
    1. Bovarnick MR. 1960. Incorporation of acetate-1-C14 into lipid by typhus rickettsiae. J Bacteriol 80:508–512. doi:10.1128/jb.80.4.508-512.1960 - DOI - PMC - PubMed
    1. Tesh MJ, Morse SA, Miller RD. 1983. Intermediary metabolism in Legionella pneumophila: utilization of amino acids and other compounds as energy sources. J Bacteriol 154:1104–1109. doi:10.1128/jb.154.3.1104-1109.1983 - DOI - PMC - PubMed

Publication types

LinkOut - more resources