. 2024 Nov 4;223(11):e202401167.
doi: 10.1083/jcb.202401167. Epub 2024 Sep 26.

Arf1-dependent LRBA recruitment to Rab4 endosomes is required for endolysosome homeostasis

Affiliations

Arf1-dependent LRBA recruitment to Rab4 endosomes is required for endolysosome homeostasis

Viktória Szentgyörgyi et al. J Cell Biol. .

Abstract

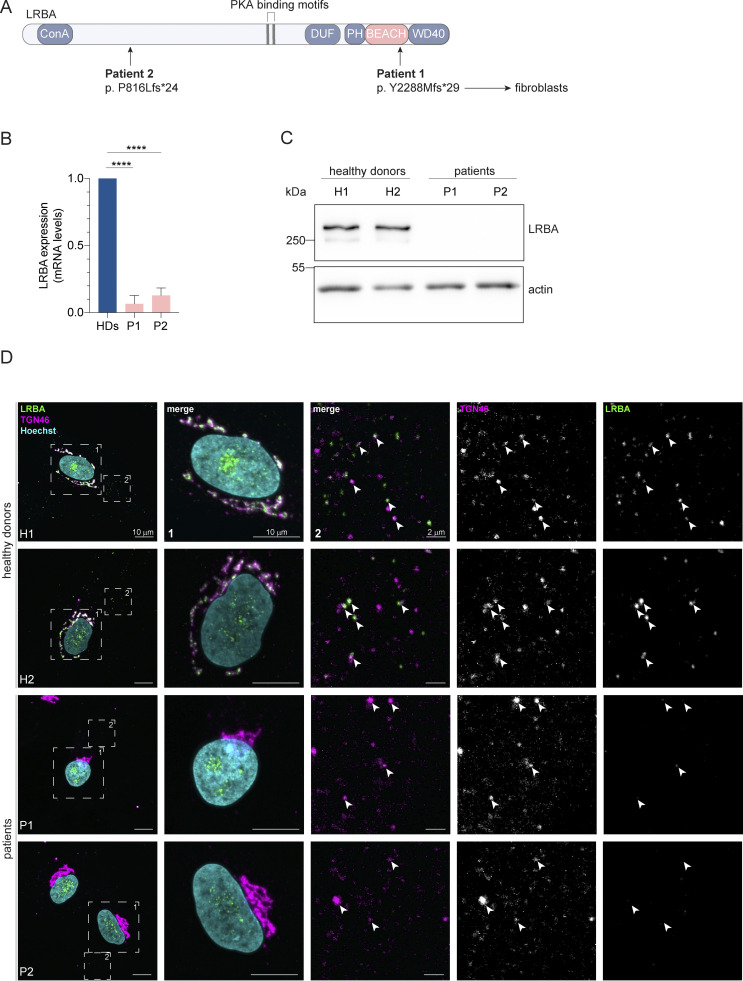
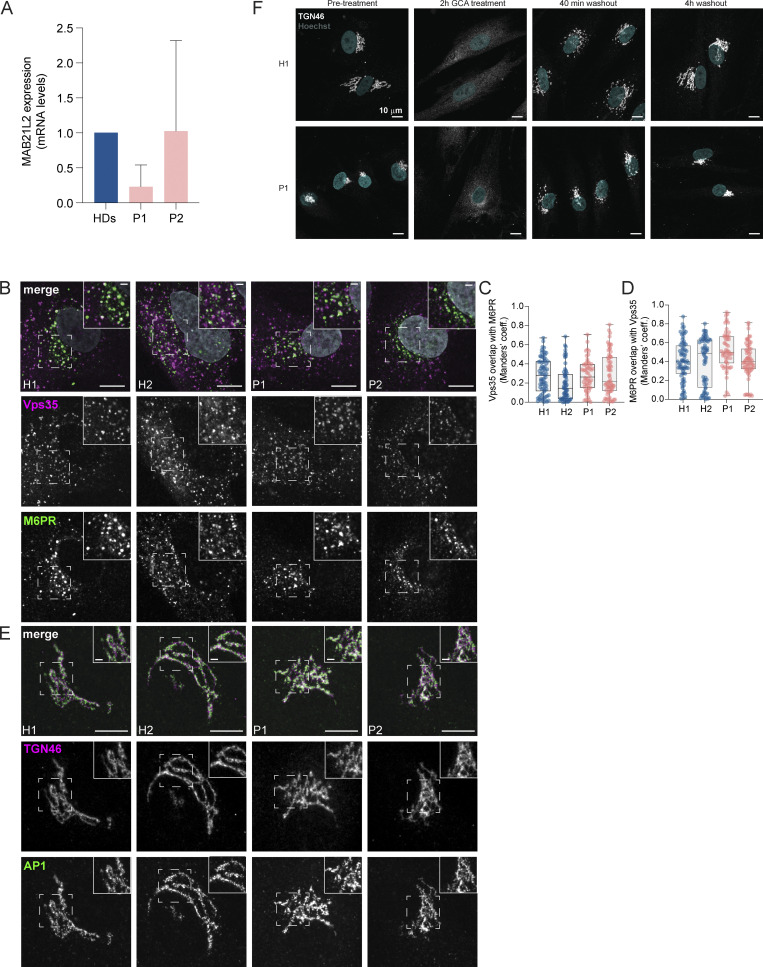
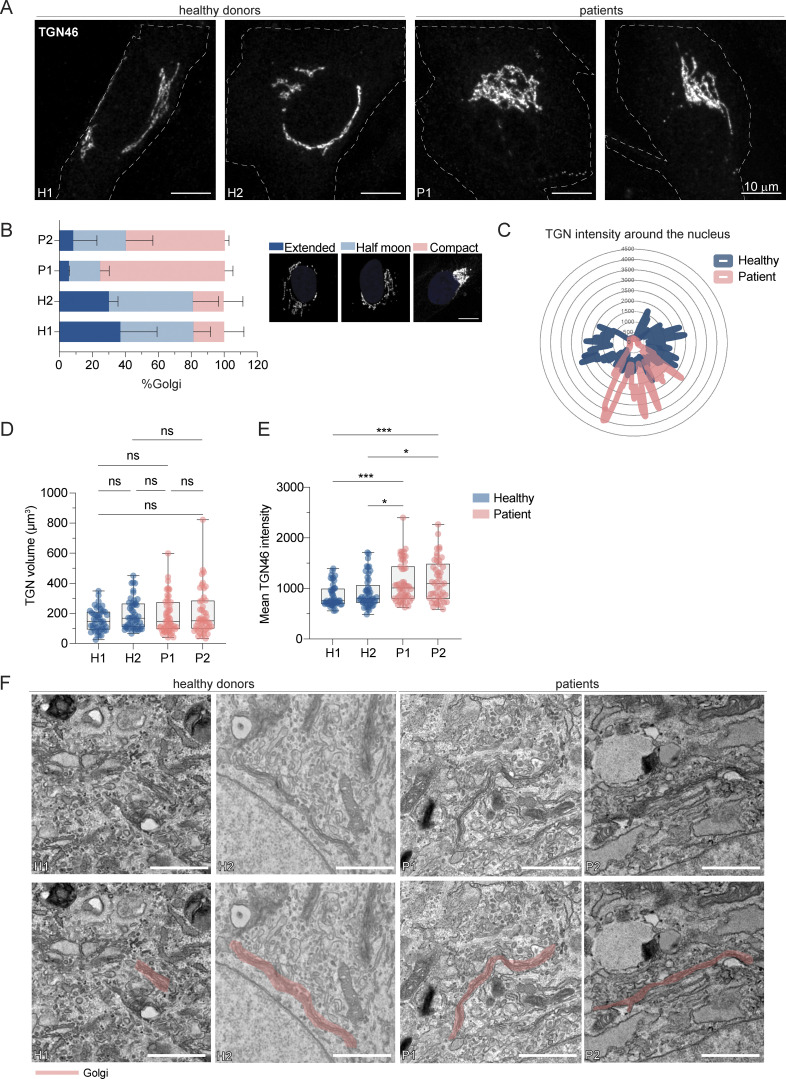
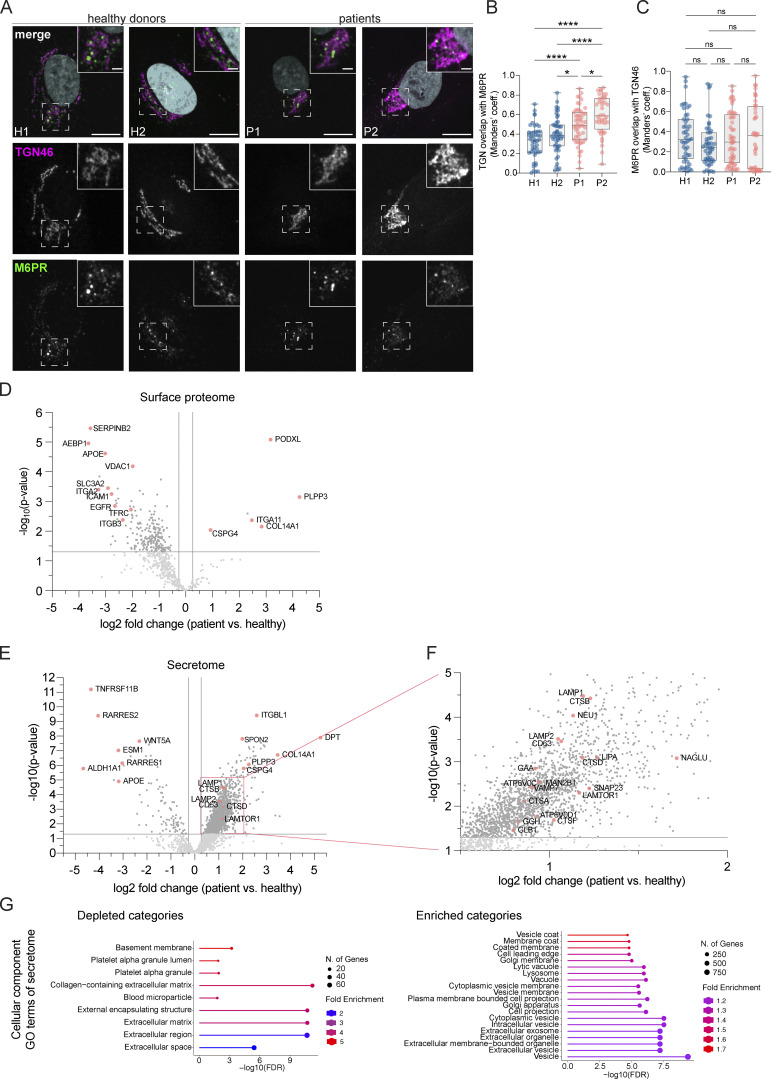
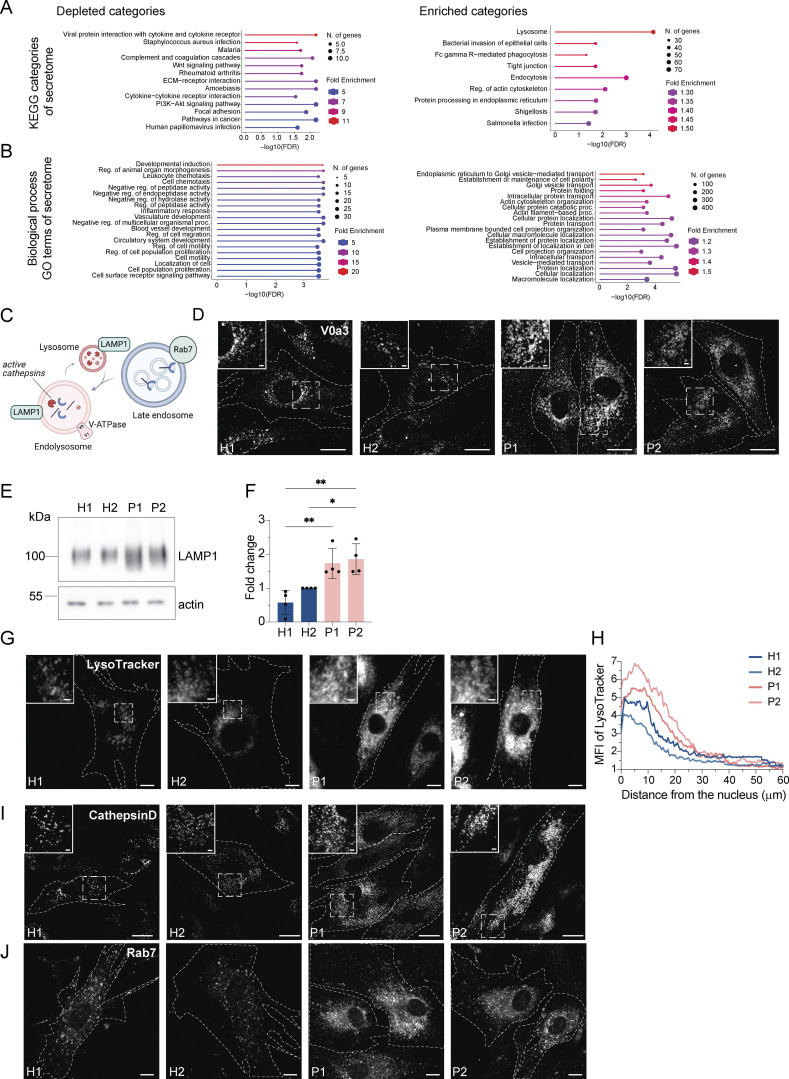
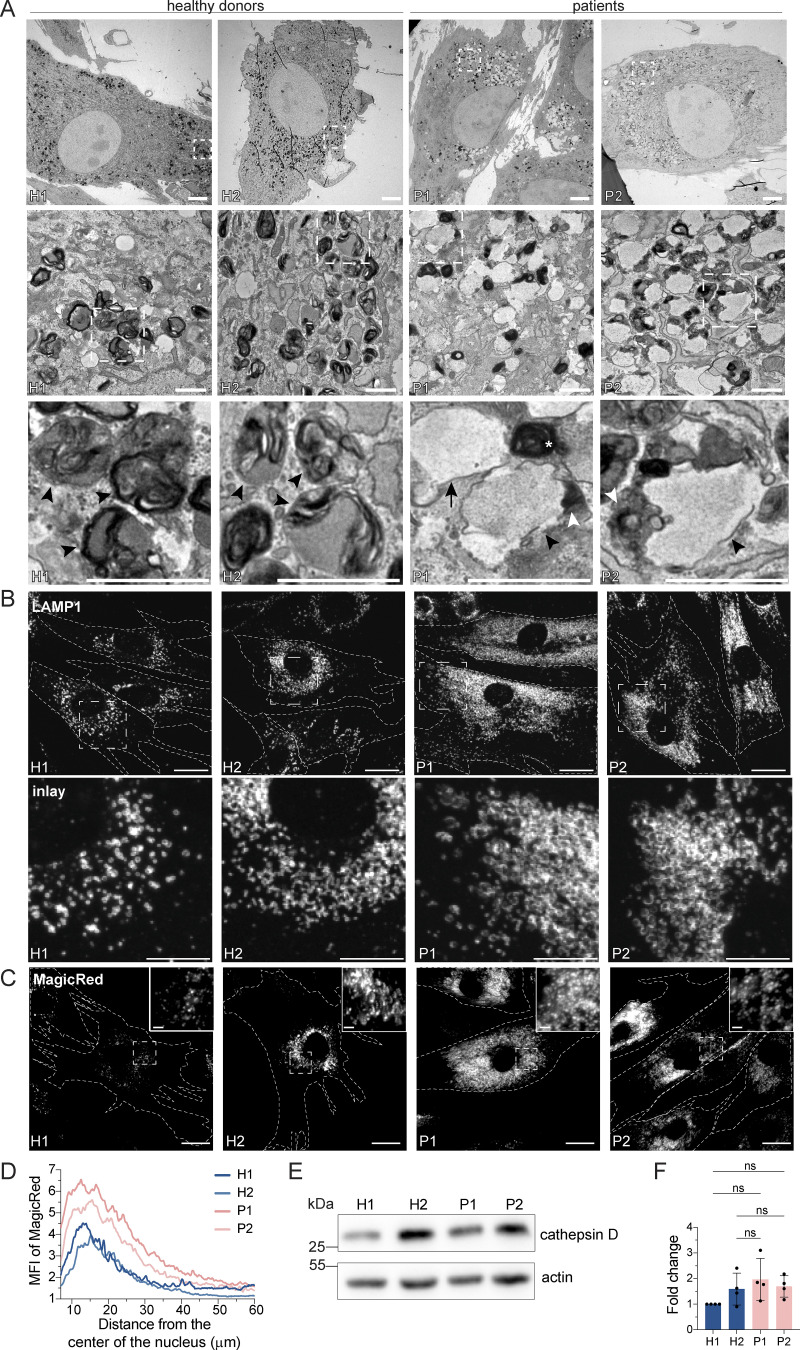
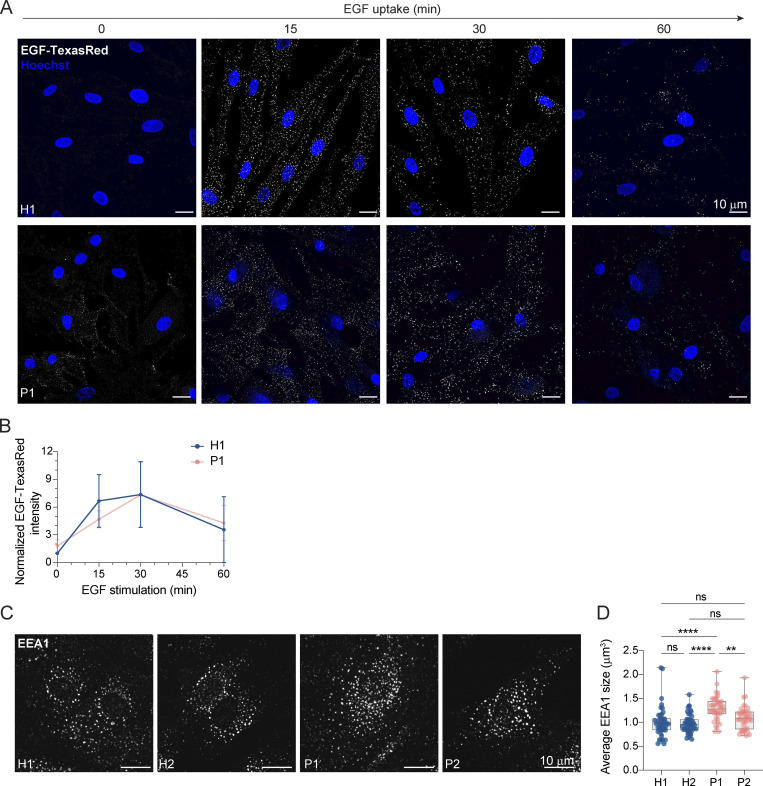
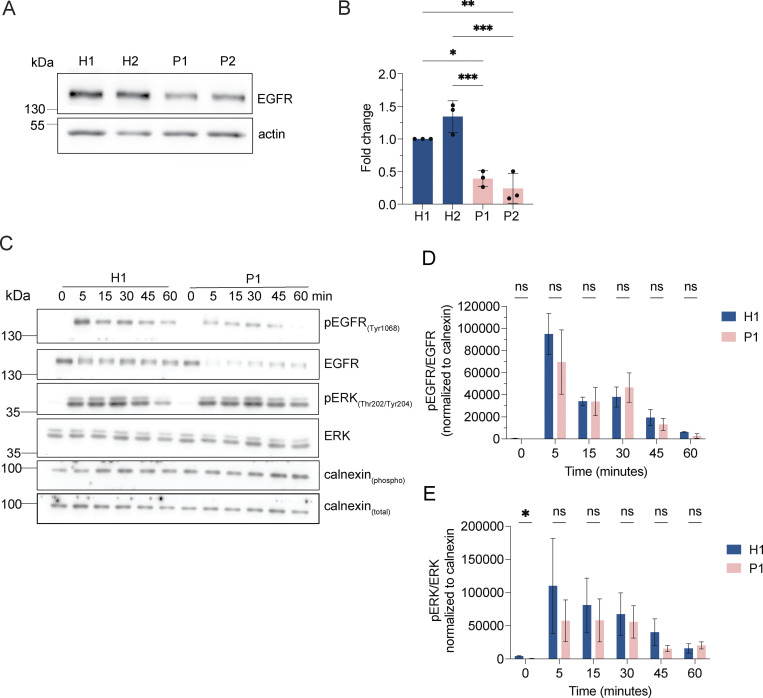
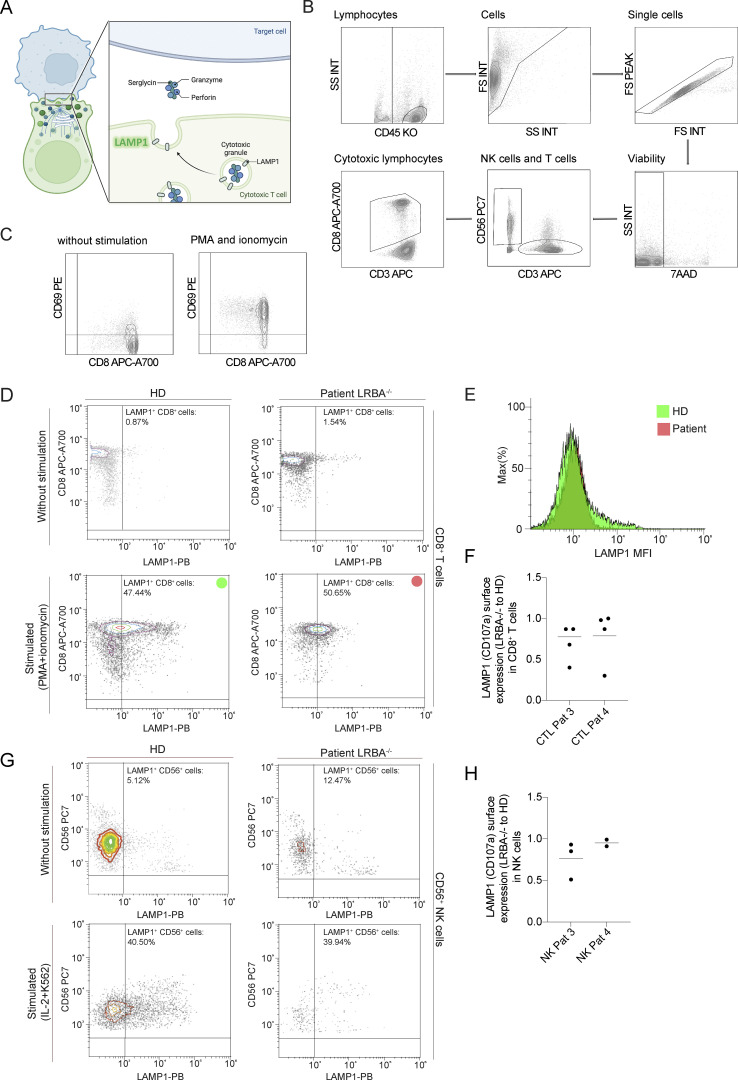
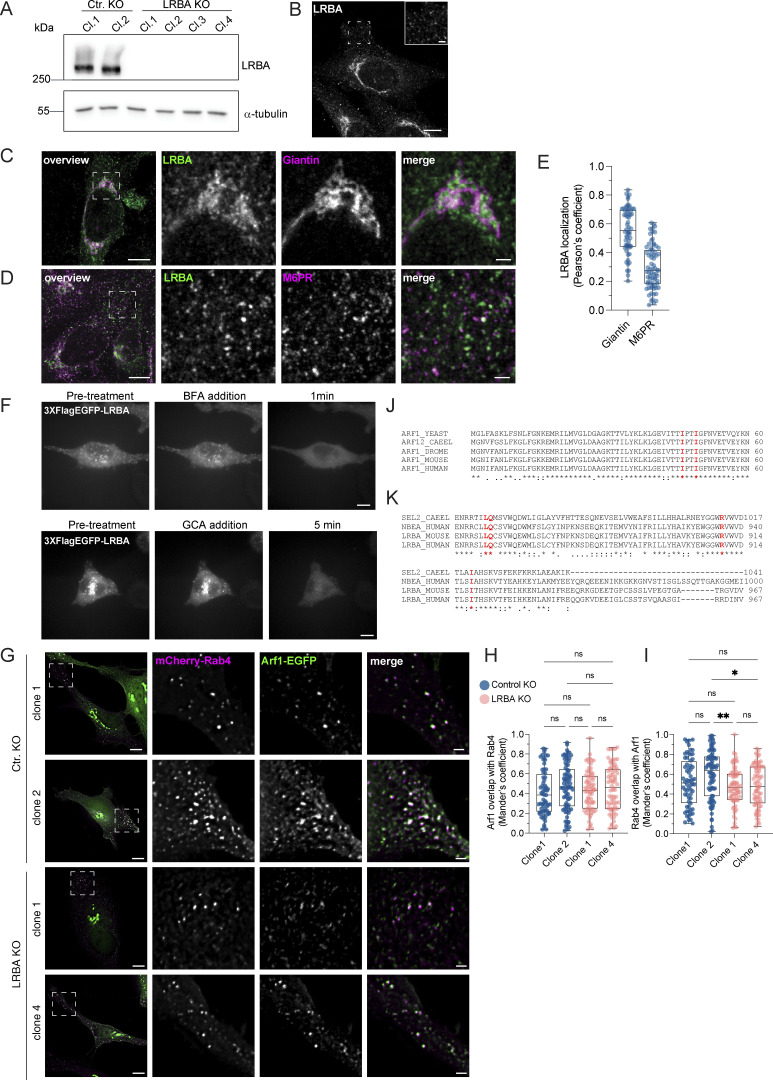
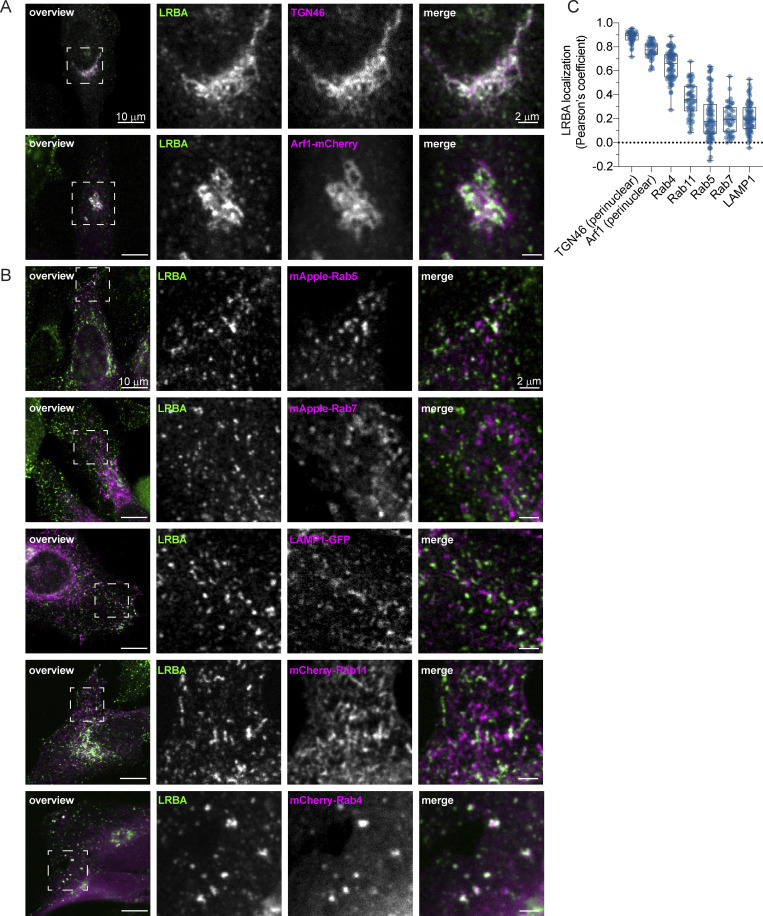
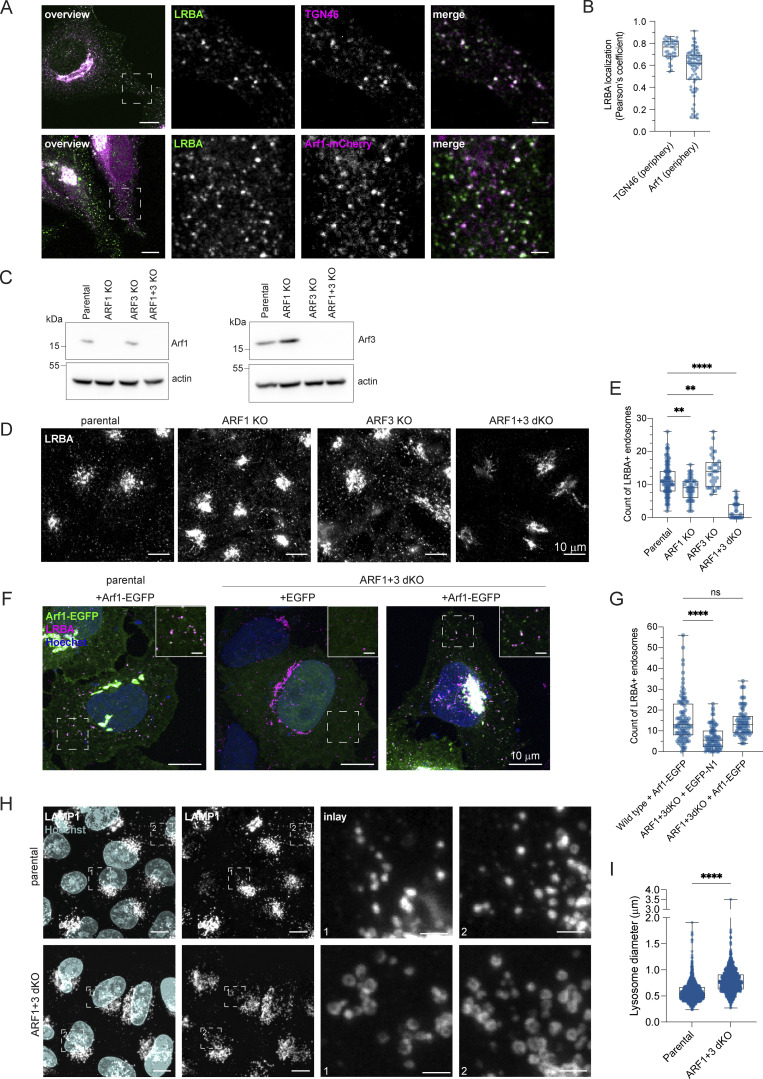
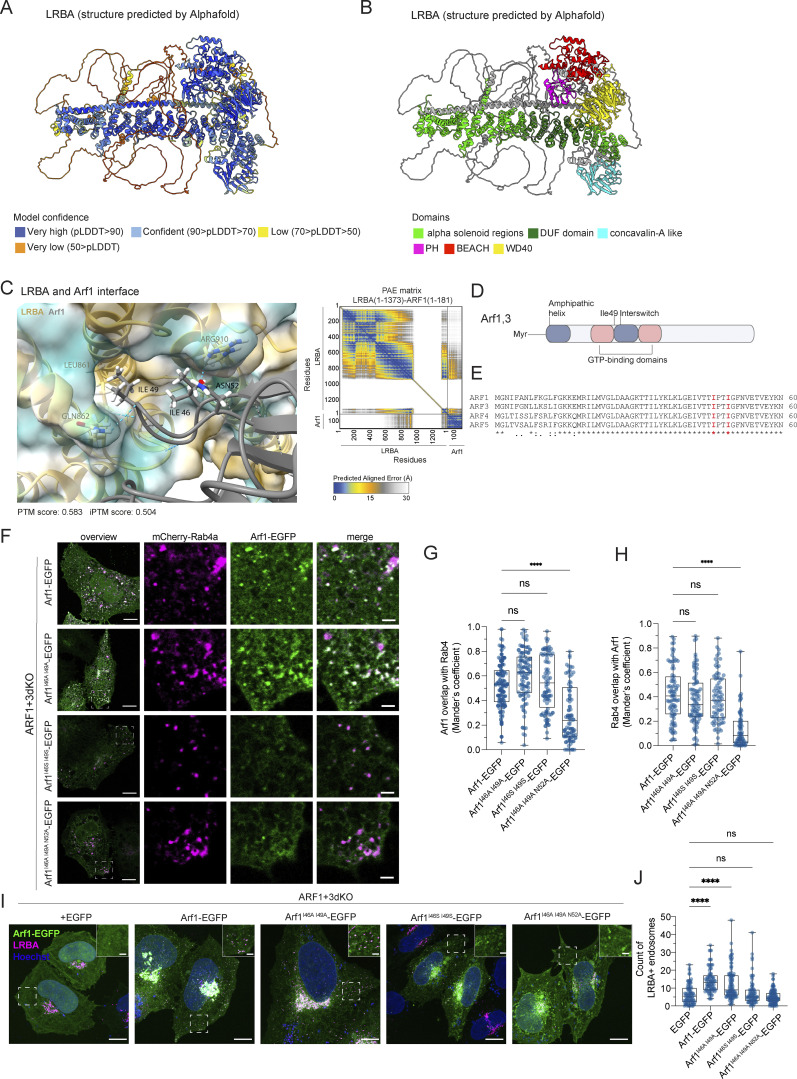
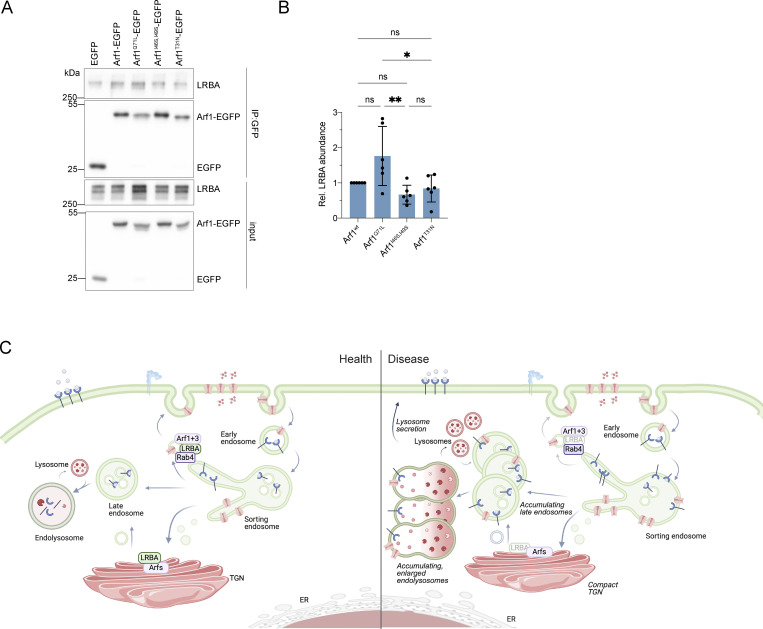
Deleterious mutations in the lipopolysaccharide responsive beige-like anchor protein (LRBA) gene cause severe childhood immune dysregulation. The complexity of the symptoms involving multiple organs and the broad range of unpredictable clinical manifestations of LRBA deficiency complicate the choice of therapeutic interventions. Although LRBA has been linked to Rab11-dependent trafficking of the immune checkpoint protein CTLA-4, its precise cellular role remains elusive. We show that LRBA, however, only slightly colocalizes with Rab11. Instead, LRBA is recruited by members of the small GTPase Arf protein family to the TGN and to Rab4+ endosomes, where it controls intracellular traffic. In patient-derived fibroblasts, loss of LRBA led to defects in the endosomal pathway promoting the accumulation of enlarged endolysosomes and lysosome secretion. Thus, LRBA appears to regulate flow through the endosomal system on Rab4+ endosomes. Our data strongly suggest functions of LRBA beyond CTLA-4 trafficking and provide a conceptual framework to develop new therapies for LRBA deficiency.


Conflict of interest statement

Disclosures: The authors declare no competing interests exist.

Figures

Figure 1.
Figure 1.
Distinct point mutations in the LRBA gene of two LRBA-deficient patients cause mRNA decay and loss of the protein. (A) Schematic of LRBA protein structure with annotated domains. The genetic mutations carried by the two LRBA-deficient patients investigated in this study are shown. Dermal fibroblasts obtained from these patients were used in this study. (B) LRBA mRNA levels in the two patient and two healthy donor (HD) fibroblast cell lines were determined by qRT-PCR. Mean and standard deviation are shown from n = 4 biological replicates; one-way ANOVA using Dunnett’s multiple comparison, ****P < 0.0001. (C) Immunoblot analysis of LRBA presence in fibroblasts of two HDs and two patient donors using polyclonal LRBA antibody and actin as a loading control. (D) Colocalization of LRBA and TGN46 in fibroblasts of HDs. LRBA is absent in patient-derived fibroblasts. Cells were fixed, immunostained with TGN46 and LRBA antibodies, and imaged using a confocal microscope. Squares show magnification of the perinuclear area (1) and the periphery (2). The labeling of the single channels represents the color of the channel on the merged image. H1: HD 1, H2: HD 2, P1: patient 1, P2: patient 2. Source data are available for this figure: SourceData F1.
Figure S1.
Figure S1.
LRBA does not regulate Golgi assembly. (A) The nested MAB21L2 gene expression levels in LRBA deficient fibroblasts. MAB21L2 mRNA levels in two patient-derived and three HD fibroblast lines were determined by qRT-PCR. Mean and standard deviation are shown from n = 3 biological replicates. HDs versus P1 (P = 0.4805) and HDs versus P2 (P = 0.9990); one-way ANOVA using Tukey’s multiple comparison. (B) Colocalization analysis of Vps35 and M6PR in two HDs and two patient-derived fibroblast cell lines. Representative confocal immunofluorescence images of single focal planes. Squares show the magnified area. Inlays are shown in the top right corner of the images. The labeling of the single channels represents the color of the channel on the merged image. Scale bar, 10 μm, inlays 2 μm. (C and D) Colocalization between Vps35 and M6PR was measured using Mander’s colocalization index. Mean and minimum to maximum are shown, box ranges from the first (Q1–25th percentiles) to the third quartile (Q3–75th percentiles) of the distribution; H1 = 73 cells, H2 = 63 cells, P1 = 56 cells, P2 = 68 cells from n = 3 biological replicates. (C) Mander’s coefficient of Vps35 overlap with M6PR. (D) Mander’s coefficient of M6PR overlap with Vps35. (E) Immunofluorescence analysis of TGN46 and AP1 colocalization in two HDs and two patient-derived fibroblast lines. Representative confocal images of single focal planes. Squares show the magnified area. Inlays are shown in the top right corner of the images. The labeling of the single channels represents the color of the channel on the merged image. Scale bar, 10 μm, inlays 2 μm. (F) Golgi reassembly is not regulated by LRBA. H1 and P1 cells were grown on coverslips and treated with GCA for 2 h to vesiculate the Golgi. After 2 h, GCA was washed out and the cells were incubated with complete growth media for indicated time points for Golgi reassembly. Cells were then fixed and their Golgi was visualized by endogenous TGN46 staining and their nuclei by Hoechst staining. Representative maximum Z-projected images are shown.
Figure 2.
Figure 2.
LRBA deficiency promotes TGN compaction in patient-derived cells. (A) TGN morphology analysis of two HDs and two patient-derived fibroblast lines visualized by the immunostaining of TGN46. Patient-derived cells show compacted TGN morphology. Representative confocal images from n = 3 biological replicates. Cell outlines are marked with a dashed line. H1: HD 1, H2: HD 2, P1: patient 1, P2: patient 2. (B) Measurements of TGN morphology (extended–dark blue, half moon–light blue, compact-pink) based on images taken in (A). Percentage of cells belonging to each category and standard deviation are shown; H1 = 47 cells, H2 = 47 cells, P1 = 53 cells, P2 = 49 cells from n = 3 biological replicates. The legend shows a representative image for each morphology category. (C) Representative TGN46 signal distribution around the nucleus in H1 and P1 cells. (D and E) Quantification of (D) TGN volume and (E) mean TGN46 intensity based on images taken in A. Mean and minimum to maximum are shown, the box ranges from the first (Q1–25th percentiles) to the third quartile (Q3–75th percentiles) of the distribution. All data points are shown.; H1 = 46 cells, H2 = 49 cells, P1 = 51 cells, P2 = 47 cells from n = 3 biological replicates; Kruskal–Wallis test using Dunn’s multiple comparison, ***P = 0.0007 (H1 versus P1), ***P = 0.0005 (H1 versus P2), *P = 0.0248 (H2 versus P1), *P = 0.0170 (H2 versus P2). (F) TEM images of two HDs and two patient-derived fibroblasts show intact Golgi cisternae. In the lower row, pink masks highlight Golgi stacks. Scale bar, 1 µm.
Figure 3.
Figure 3.
Golgi-endosome traffic and secretion are only slightly altered in LRBA deficiency. (A) Colocalization analysis of TGN46 and M6PR in two HDs and two patient-derived fibroblast lines. Representative confocal immunofluorescence images of single focal planes. Squares show the magnified area. Inlays are shown in the top right corner of the images. The labeling of the single channels represents the color of the channel on the merged image. Scale bar, 10 μm, inlays 2 μm. (B and C) Colocalization between TGN46 and M6PR was measured using Mander’s colocalization index. Mean and minimum to maximum are shown, box ranges from the first (Q1–25th percentiles) to the third quartile (Q3–75th percentiles) of the distribution. H1 = 47 cells, H2 = 47 cells, P1 = 52 cells, P2 = 40 cells from n = 3 biological replicates. (B) Mander’s coefficient of TGN46 overlap with M6PR. One-way ANOVA using Tukey’s multiple comparison, ****P < 0.0001, *P = 0.0432 (H2 versus P1), *P = 0.0324 (P1 versus P2). (C) Mander’s coefficient of M6PR overlap with TGN46, Kruskal–Wallis test using Dunn’s multiple comparison. (D) Scatter plot of LRBA deficient versus healthy donor fibroblasts’ protein abundances in the cell surface proteome determined with cell surface biotinylation and LC-MS analysis. Datapoints above P value scores of 0.05 are indicated in light grey. Highlighted, significantly altered proteins (P < 0.05) are indicated in pink colors. (E) Volcano plot of patient/healthy donor protein abudances in the secretome determined by LC-MS analysis. (F) Inlay of volcano plot shown in panel E. (G) Gene ontology analysis of enriched and depleted cellular component categories in the patients’ secretome.
Figure S2.
Figure S2.
Enlarged (endo)lysosomal structures are acidified and contain active cathepsin D. (A) Gene ontology analysis of enriched and depleted KEGG categories in the patients’ secretome. (B) Gene ontology analysis of enriched and depleted biological processes in the patients’ secretome. (C) Scheme showing Rab7+ late endosome fusing with LAMP1+ lysosomes and becoming endolysosomes. Endolysosomes are acidified and contain active cathepsins in their lumen and vacuolar-ATPase and LAMP1 in their membrane. (D) Visualization of endolysosomes by immunostaining the V0a3 subunit of the lysosomal V-ATPase. Healthy and LRBA-deficient fibroblasts were fixed and stained with V0a3 antibody. Representative confocal images. Cell outlines are marked with a dashed line. Inlays are shown in the top left corner of the images. Scale bar, 10 μm, inlays 2 μm. (E) Immunoblot analysis of LAMP1 protein levels in two healthy and two LRBA-deficient patient-derived fibroblast lines. Actin was used as a loading control. (F) Quantification of LAMP1 levels based on immunoblots shown on panel E from n = 4 biological replicates; one-way ANOVA using Tukey’s multiple comparison; *P = 0.0279, **P = 0.0036 (H1 versus P1), **P = 0.0017 (H1 versus P2). (G) Accumulation of acidified endolysosomes in LRBA-deficient fibroblasts. Fibroblasts were seeded onto imaging chambers, stained with LysoTracker Green and imaged live at 37°C and 5% CO2 atmosphere. Maximum Z-projection of wide-field images are shown. Cell outlines are marked with a dashed line. Inlays are shown in the top left corner of the images. Scale bar, 10 μm, inlays 2 μm. (H) Quantification of the LysoTracker Green intensity along the nucleus-cell periphery axis. A line ROI was drawn from the edge of the nucleus to the cell periphery and LysoTracker Green intensity was measured. Values were normalized to the maximum of each cell and averaged per experiment. The normalized mean of n = 3 biological replicates is plotted along the axis; H1 = 30 cells, H2 = 30 cells, P1 = 30 cells, P2 = 30 cells were analyzed. (I) Cathepsin D is present in accumulating, enlarged (endo)lysosomes. Healthy and LRBA-deficient fibroblasts were fixed and stained with endogenous cathepsin D antibody. Representative confocal images from n = 3 biological replicates. Cell outlines are marked with a dashed line. Inlays are shown in the top left corner of the images. Scale bar, 10 μm, inlays 2 μm. (J) Immunofluorescence analysis of Rab7+ late endosomes in two HDs and two patient-derived fibroblast lines. Representative confocal images. Cell outlines are marked with a dashed line. Scale bar, 10 μm. Source data are available for this figure: SourceData FS2.
Figure 4.
Figure 4.
LRBA-deficient fibroblasts accumulate enlarged endolysosomes. (A) TEM analysis of accumulating endolysosomes in patient-derived cells. Squares show magnification of the endolysosomal structures. HDs showed electron-dense endolysosomes (black arrowheads). In contrast, in patient-derived cells, endolysosomes (black arrowheads) showed restricted degradative (electron-dense) domains (white arrowheads). Lysosomes (white star) and endosomes (black arrow) are shown. Two HDs and two patient-derived fibroblast lines were embedded and analyzed. Scale bar, 5 μm, inlays in the third row 1 μm. (B) Immunofluorescence analysis of accumulating, enlarged (endo)lysosomes in patient-derived cells. Fibroblasts were fixed with methanol and stained for LAMP1. Cell outlines are marked with a dashed line. Squares show magnification of the (endo)lysosomes. Representative confocal images are shown from n = 3 biological replicates. Scale bar, 20 μm, inlays 10 μm. (C) Analysis of cathepsin B activity in LRBA-deficient fibroblasts. LRBA-deficient patient-derived and healthy fibroblasts were plated onto imaging chambers and their lysosomes were visualized with Magic Red (indicating cathepsin B activity) and imaged live at 37°C, 5% CO2. Representative wide-field images are shown from n = 3 biological replicates. Cell outlines are marked with a dashed line. Squares show the magnified area. Inlays are shown in the top right corner of the images. Scale bar, 20 μm, inlays 2 μm. (D) Quantification of the MagicRed intensity along the nucleus-cell periphery axis. A line ROI was drawn from the nucleus to the cell periphery and Magic Red intensity was measured. Values were normalized to the maximum of each cell and averaged per experiment. The mean of three biological replicates is plotted along the axis; H1 = 45 cells, H2 = 53 cells, P1 = 51 cells, P2 = 49 cells were analyzed. (E) Western blot analysis of matured cathepsin D (heavy chain) protein levels in healthy and patient-derived fibroblasts using actin as a loading control. (F) Quantification of cathepsin D levels based on immunoblots shown on panel E from n = 4 biological replicates mean ± SD; one-way ANOVA using Tukey’s multiple comparison. Source data are available for this figure: SourceData F4.
Figure 5.
Figure 5.
Lysosomal degradation is unimpaired in LRBA deficiency. (A) EGF-TexasRed uptake and degradation assay show unimpaired degradation in LRBA deficiency. H1 and P1 fibroblasts were serum-starved for 3 h and then were incubated on ice with EGF-TexasRed for 30 min. Cells were then washed 3× with ice-cold PBS and incubated with unlabeled EGF for indicated time points at 37°C. Cells were rinsed with ice-cold PBS, fixed with 4% PFA, and mounted in the presence of Hoechst dye to visualize nuclei. Overview confocal images of EGF-TexasRed signal are shown for each time point. Background signal has been subtracted using Gaussian blurring and image subtraction in Fiji. Maximum intensity projection of confocal Z-stacks. (B) Measurement of EGF-TexasRed fluorescence intensity based on images shown in A. Integrated density of EGF-TexasRed per cell was measured, averaged and normalized to H1 levels at 0 time point for each experiment; H1(0 min) = 38 cells, H1(15 min) = 58 cells, H1(30 min) = 67 cells, H1(60 min) = 44 cells, P1(0 min) = 36 cells, P1(15 min) = 51 cells, P1(30 min) = 45 cells, P1(60 min) = 50 cells were analyzed from n = 3 biological replicates. Mean and SD is shown. (C) Immunofluorescence analysis of EEA1-positive early endosomes in healthy and LRBA-deficient patient-derived fibroblasts. Maximum intensity projection of confocal Z-stacks. (D) Measurement of the average size of early endosomes per cell was measured. Mean and minimum to maximum are shown, box ranges from the first (Q1–25th percentiles) to the third quartile (Q3–75th percentiles) of the distribution. All data points are shown. H1 = 43 cells, H2 = 44 cells, P1 = 40 cells, P2 = 40 cells were analyzed from n = 3 independent experiments; Kruskal–Wallis test using Dunn’s multiple comparison. ****P < 0.0001, **P = 0.0093.
Figure S3.
Figure S3.
LRBA does not regulate EGFR signaling attenuation. (A) EGFR protein levels are reduced in LRBA-deficient fibroblasts. Immunoblot analysis of EGFR in two healthy and two LRBA-deficient patient-derived fibroblast lines. Actin was used as a loading control. The same blot has been re-probed with LRBA antibody and is shown in Fig. 1 C, therefore the loading control (actin) is identical on the two images. (B) Quantification of EGFR levels based on immunoblots shown on panel A from n = 3 biological replicates; one-way ANOVA using Tukey’s multiple comparison; *P = 0.0124, **P = 0.0034, ***P = 0.0008 (H2 versus P1), ***P = 0.0003 (H2 versus P2). (C) Immunoblot analysis of EGFR signaling kinetics in H1 and P1 fibroblasts. Cells were serum-starved overnight in DMEM and then incubated with 2 μg/ml EGF in serum-free DMEM for the indicated time points. Cells were then rinsed with ice-cold PBS and lysed with M-PER lysis buffer supplemented with protease and phosphatase inhibitors. For addressing EGFR signaling, an antibody against EGFR and its phosphorylation site Tyr1068 was used. We also detected the downstream ERK phosphorylation with the Thr202/Tyr204 phosphorylation sites specific antibody. Calnexin was used as loading control. (D) Quantification of pEGFR levels and kinetics upon EGF stimulation based on immunoblots shown in A. pEGFR and EGFR levels were measured and normalized to calnexin loading controls (pEGFRnorm, EGFRnorm). Then pEGFRnorm values were normalized to EGFRnorm values and plotted over time. Two-way ANOVA using Šidák’s multiple comparisons test. (E) Quantification of pERK levels and kinetics upon EGF stimulation based on immunoblots as shown in A. pERK and total ERK levels were measured and normalized to calnexin loading controls (pERKnorm, ERKnorm). Then pERKnorm values were normalized to ERKnorm values and plotted over time. Two-way ANOVA using Šidák’s multiple comparisons test. *P = 0.0448. Source data are available for this figure: SourceData FS3.
Figure S4.
Figure S4.
Degranulation of CD8+ T cells and NK cells is unimpaired in LRBA deficiency. (A) Scheme of immunological synapse formation and lytic/cytotoxic granule exocytosis in cytotoxic T cells. Upon target cell recognition an immune synapse is formed which induces a strong polarization in T cells. The microtubule-organizing center (MTOC) is trafficked to the immunological synapse bringing other organelles like the Golgi network, endosomes, and lytic granules to the synapse. Lytic granules are lysosome-related organelles containing canonical lysosomal proteins (LAMP1), granzyme and perforin. During degranulation, the lytic granules are fused with the plasma membrane. Upon release, perforin mediates the generation of pores in the plasma membrane of the target cell allowing granzymes to access the cytoplasm and induce apoptosis. The degranulation process exposes LAMP1 on the cell surface and can be used as a marker for degranulating cells. Scheme was created with Biorender. (B) Gating strategy of CD8+ T cells and NK cells in the degranulation assay. Gating strategy for cytotoxic lymphocytes and NK cells is shown on the sample of a HD. Leukocytes and lymphocytes are defined in an SSC/CD45 gate. Lymphocyte populations are visualized again in an SSC/FSC gate. Single cells are discriminated from doublets in an FS peak/FSC gate. Viable cells are gated as 7AAD negative cells in a viability gate. NK cells are defined as CD3 and CD56+ cells. Cytotoxic lymphocytes are defined as CD3+ and CD8+. SSC, side scatter, FSC, forward scatter. (C) CD69 was used as a common marker for lymphocyte activation upon stimulation. An example of CD69 gating in CD8+ cells from a HD is shown. (D) Flowcytometric analysis of LAMP1(CD107a) surface expression in CD8+ T cells of a healthy individual (HD) and an LRBA-deficient patient (LRBA−/−) in mononuclear cells (PMCS) isolated from peripheral blood samples. Upon stimulation with PMA+ ionomycin, there is a significant increase in LAMP1 expression. Dot blots show the CD8+LAMP1+ population marked with a green circle for the healthy and red circle for the affected individual. (E) The mean fluorescence intensity (MFI) was calculated for each sample, given as green (HD) and red (patient) histograms. (F) Patient-derived CD8+ T cells degranulate almost as efficiently as healthy cells. Degranulation is given by the ratio of LAMP1 surface expression for each LRBA deficient patient and the healthy control in each degranulation assay as these where available at different time points. (G) For the NK cells the stimulation included IL-2 and co-culture with K562 cells, resulting in a subpopulation of NK cells (%) expressing LAMP1 in a healthy donor and patient. Dot plots show the percentage of the CD56+LAMP1+ population (top right quadrants). (H) Patient-derived NK cells degranulate almost as efficiently as healthy cells. Degranulation is given by the ratio of LAMP1 surface expression for each LRBA-deficient patient and the healthy control in each degranulation assay as these were available at different time points.
Figure S5.
Figure S5.
LRBA is endogenously expressed in HeLa cells and recruited to endosomes by Arfs. (A) Immunoblot analysis of LRBA presence in HeLa cells of two control and four LRBA KO clones using polyclonal LRBA antibody and α-tubulin as a loading control. (B) LRBA is localized at the perinuclear region and on vesicular structures in HeLa cells. Immunofluorescence analysis of endogenous LRBA in fixed HeLa cells. Scale bar, 10 μm, inlay 2 μm. (C) LRBA partly colocalizes with the cis-Golgi in HeLa cells. Immunofluorescence staining of endogenous LRBA and the cis-Golgi marker giantin in fixed HeLa cells. Squares show magnification of the perinuclear area. The labeling of the single channels represents the color of the channel on the merged image. Scale bar, 10 μm, inlays 2 μm. (D) LRBA does not colocalize with M6PR in HeLa cells. Immunofluorescence analysis of endogenous LRBA and endogenous M6PR colocalization in fixed HeLa cells. Squares show magnification of the perinuclear area. The labeling of the single channels represents the color of the channel on the merged image. Scale bar, 10 μm, inlays 2 μm. (E) Colocalization measurement of LRBA with giantin and M6PR. To measure LRBA colocalization with giantin one ROI at the perinuclear region was analyzed. To measure colocalization with M6PR, two ROIs per cell at the cell periphery were analyzed and the Pearson’s coefficient was measured using the JACoP plugin in Fiji. Mean and minimum to maximum are shown, box ranges from the first (Q1–25th percentiles) to the third quartile (Q3–75th percentiles) of the distribution. All data points are shown. Giantin = 60 cells, M6PR = 35 cells. (F) LRBA puncta disperse upon treatment with ArfGEF inhibitors. Live-cell imaging of 3xFlagEGFP-LRBA upon BFA (top panels) and GCA (lower panels) treatment for indicated timepoints. Scale bar, 10 μm. (G) Arf1 is recruited onto Rab4+ endosomes in the absence of LRBA. Control KO and LRBA KO HeLa cells were transfected with mCherry-Rab4 and Arf1-EGFP and cells were imaged live using a wide-field microscope at 37°C, 5% CO2 atmosphere. Deconvolved images of single stacks are shown. Squares show magnification of the perinuclear area. The labeling of the single channels represents the color of the channel on the merged image. Scale bar, 10 μm, inlays 2 μm. (H and I) Colocalization measurement of Arf1-EGFP and mCherry-Rab4 in control and LRBA KO HeLa cells. Two ROIs per cell were analyzed and Mander’s coefficients were measured using the JACoP plugin in Fiji. Arf1 overlap with Rab4 (M1) is shown in H, Rab4 overlap with Arf1 (M2) is shown in I. All data points are shown. Ctr. KO clone1 = 32 cells, Ctr. KO clone2 = 39 cells, LRBA KO clone1 = 36 cells, LRBA KO clone 4 = 36 cells from n = 3 biological replicates; (H) one-way ANOVA using Tukey’s multiple comparison. (I) Kruskal–Wallis test using Dunn’s multiple comparisons test, **P = 0.0071, *P = 0.0201. (J) The amino acids isoleucine 46 and 49 of Arf1 and Arf3 were predicted to interact with LRBA. Both amino acids are conserved across species. The amino acid sequences of the yeast, C. elegans (CAEEL), Drosophila melanogaster (DROME), mouse and human Arf1 and human Arf3 were aligned. Labels: (*) conserved sequence; (:) conservative mutation; (.) semiconservative mutation; (−) gap. Sequence alignments were performed using Clustal Omega. (K) The amino acids leucine 861, arginine 910, and isoleucine 918 of LRBA were predicted to interact with Arf1 and Arf3. All three amino acids are conserved across species. The amino acid sequences of the C. elegans SEL-2 (SEL2-CAEEL), the mouse and the human LRBA, and the human neurobeachin (NBEA) were aligned. Labels: (*) conserved sequence; (:) conservative mutation; (.) semi-conservative mutation; (-) gap. Sequence alignments were performed using Clustal Omega. Source data are available for this figure: SourceData FS5.
Figure 6.
Figure 6.
LRBA colocalizes with the TGN and with Rab4+ endosomes in HeLa cells. (A) Colocalization analysis of LRBA with TGN46 and Arf1 in HeLa cells. For the colocalization analysis with the TGN, HeLa cells were fixed with 4% PFA and stained for TGN46 and endogenous LRBA. For colocalization analysis with Arf1, HeLa cells were transfected with ARF1-mCherry, fixed with 4% PFA, and stained for endogenous LRBA. Squares show magnification of the perinuclear area. The labeling of the single channels represents the color of the channel on the merged image. (B) Colocalization analysis of LRBA and different endosomal markers. LRBA colocalizes with Rab4 and is found in juxtaposition to Rab11 recycling endosomes and to Rab5 early endosomes. HeLa cells were transfected with mApple-Rab5, mApple-Rab7, LAMP1-GFP, mCherry-Rab11, mCherry-Rab4, respectively, and stained for endogenous LRBA. Representative confocal images of single focal planes are shown. Squares show the magnified areas. The labeling of the single channels represents the color of the channel on the merged image. (C) Colocalization measurements of LRBA and intracellular organelles. To measure LRBA colocalization with TGN46 and with Arf1 at the Golgi, one ROI at the perinuclear region was analyzed. For the endosomal markers, two ROIs per cell at the cell periphery were analyzed and the Pearson’s coefficient was measured using the JACoP plugin in Fiji. Mean and minimum to maximum are shown, box ranges from the first (Q1–25th percentiles) to the third quartile (Q3–75th percentiles) of the distribution. All data points are shown. TGN46(perinuclear) = 40 cells, Arf1 (perinuclear) = 39 cells, Rab4 = 34 cells, Rab11 = 26 cells, LAMP1 = 35 cells, Rab5 = 35 cells, Rab7 = 21 cells from n = 3 biological replicates.
Figure 7.
Figure 7.
LRBA is recruited onto endosomes by Arf1 and Arf3. (A) Colocalization analysis of LRBA and TGN46 or Arf1 on endosomes in HeLa cells. For the colocalization analysis with the TGN, HeLa cells were fixed with 4% PFA and stained for endogenous TGN46 and LRBA. For colocalization analysis with Arf1, HeLa cells were transfected with ARF1-mCherry, fixed with 4% PFA and stained for endogenous LRBA. Squares show magnification of the perinuclear area. The labeling of the single channels represents the color of the channel on the merged image. Scale bar, 10 μm, inlays 2 μm. (B) Colocalization measurements of LRBA with TGN46 and Arf1 at the cell periphery. To measure LRBA colocalization with TGN46 one ROI per image, with Arf1 two ROIs per image were analyzed and the Pearson’s coefficient was measured using the JACoP plugin in Fiji. Mean and minimum to maximum are shown, the box ranges from the first (Q1–25th percentiles) to the third quartile (Q3–75th percentiles) of the distribution. All data points are shown. TGN46 (periphery) = 40 cells, Arf1 (periphery) = 35 cells from n = 3 biological replicates. (C) Immunoblot analysis of Arf1 and Arf3 expression in parental, ARF1 KO, ARF3 KO, and ARF1+3 dKO HeLa cells. Actin was used as a loading control. (D) LRBA is absent from endosomes in ARF1 and ARF3 dKO HeLa cells. Note that LRBA is still present on the Golgi. Parental, ARF1 KO, ARF3 KO, and ARF1+3 dKO HeLa cells were seeded on coverslips, fixed, and stained for endogenous LRBA. Maximum intensity projections of confocal images are shown. (E) The number of LRBA+ endosomes in parental, ARF1 KO, ARF3 KO, and ARF1+3 dKO cells was measured using two ROIs per cell. Mean and minimum to maximum are shown, box ranges from the first (Q1–25th percentiles) to the third quartile (Q3–75th percentiles) of the distribution. All data points are shown. Parental = 95 cells, ARF1 KO = 49 cells, ARF3 KO = 32 cells, and Arf1+3 dKO = 34 cells were analyzed from n = 3 biological replicates; one-way ANOVA using Dunnett’s multiple comparison, **P = 0.0010 (parental versus ARF1 KO), **P = 0.0097 (parental versus ARF3 KO), ****P < 0.0001. (F) Arf1-EGFP re-expression rescues LRBA+ endosomes absent in ARF1+3 dKO cells. Parental HeLa cells were transfected with Arf1-EGFP, and ARF1+3 dKO cells were transfected either with EGFP as a control or with Arf1-EGFP. Cells were then fixed and stained for endogenous LRBA and with Hoechst. Maximum intensity projection of confocal Z-stacks is shown. Rectangles show the magnified area in the upper right corner. Scale bar on inlays 2 µm. (G) The number of LRBA+ puncta are counted based on data in F. Two ROIs at the cell periphery per cell are analyzed. Mean and minimum to maximum are shown, box ranges from the first (Q1–25th percentiles) to the third quartile (Q3–75th percentiles) of the distribution. All data points are shown. Parental = 49 cells, EGFP rescue = 42 cells, Arf1-EGFP rescue = 39 cells were analyzed from n = 3 biological replicates; Kruskal–Wallis test using Dunn’s multiple comparison, ****P < 0.0001. (H) (Endo)lysosomal structures are enlarged in ARF1+3 dKO cells. Parental and ARF1+3 dKO HeLa cells were seeded on coverslips, fixed, and stained for LAMP1 and with Hoechst. Maximum intensity projections of confocal Z-stacks. Squares show magnification of the (endo)lysosomes. Scale bar, 10 μm, inlays 2 μm. (I) Quantification of lysosome diameter based on images shown in H. The diameter of round lysosomes was measured manually in Fiji. Mean and minimum to maximum are shown, box ranges from the first (Q1–25th percentiles) to the third quartile (Q3–75th percentiles) of the distribution. Parental = 60 cells, ARF1+3 dKO = 64 cells were analyzed from n = 3 biological replicates. All data points are shown. Mann–Whitney test, ****P < 0.0001. Source data are available for this figure: SourceData F7.
Figure 8.
Figure 8.
Structure of LRBA and potential interaction site with Arfs as predicted by Alphafold. (A and B) Alphafold monomer prediction of human LRBA structure. Model confidence values (A) and domains (B) are indicated with colors. (C) Predicted interaction sites between LRBA (amino acids 1–1373) and Arf1 (amino acids 1–181) using Alphafold multimer. PAE plot shows the confidence scores of the interaction. The LRBA–ARF1 model has PTM and iPTM scores of 0.583 and 0.504, respectively. (D) Schematic of Arf1/3 structure and its domains. The conserved amino acid isoleucine 49 of Arf1/3 is shown since most of our models indicated that it could potentially interact with LRBA. (E) The predicted LRBA interaction site of Arf1, isoleucine 46 and 49 are conserved among human Arf1, Arf3, Arf4, and Arf5. Sequence alignments were performed using Clustal Omega. Labels: (*) conserved sequence; (:) conservative mutation; (.) semi-conservative mutation; (-) gap. (F) Colocalization analysis of mutated Arf1-EGFP constructs with Rab4+ endosomes. ARF1+3dKO HeLa cells were transfected with mCherry-Rab4a and with Arf1-EGFP constructs. Confocal images of single focal planes. Scale bar, 10 μm, inlays 2 μm. (G and H) Colocalization measurement of Rab4 and Arf1 mutants determined by Mander’s coefficients. Arf1I46A, I49A-EGFP and Arf1I46S, I49S-EGFP are still efficiently recruited to Rab4+ endosomes. Arf1I46A, I49A, N52A-EGFP recruitment to Rab4 endosomes is strongly reduced compared with wild-type Arf1-EGFP. Arf1-EGFP = 42 cells, Arf1I46A, I49A-EGFP = 43 cells, Arf1I46S, I49S-EGFP = 38 cells, and Arf1I46A, I49A, N52A = 36 cells were analyzed from n = 3 biological replicates, one-way ANOVA using Tukey’s multiple comparison test; ****P < 0.0001. (I) Arf1I46S, I49S-EGFP fails to rescue LRBA+ puncta in ARF1+3 dKO cells. ARF1+3 dKO cells were transfected with EGFP, Arf1-EGFP, Arf1I46A, I49A-EGFP, Arf1I46S, I49S-EGFP or with Arf1I46A, I49A, N52A-EGFP, fixed and stained for endogenous LRBA and with Hoechst. Scale bar, 10 μm, inlays 2 μm. (J) Quantification of the number of LRBA+ puncta based on images as shown on panel I. Two ROIs at the cell periphery per cell were analyzed. Mean and minimum to maximum are shown, box ranges from the first (Q1–25th percentiles) to the third quartile (Q3–75th percentiles) of the distribution. All data points are shown. EGFP = 42 cells, Arf1-EGFP = 39 cells, Arf1I46A, I49A-EGFP = 48 cells, Arf1I46S, I49S-EGFP = 36 cells, Arf1I46A, I49A, N52A = 49 cells were analyzed from n = 3 independent experiments; Kruskal–Wallis test using Dunn’s multiple comparison, ****P < 0.0001. EGFP and Arf1-EGFP measurements are identical to the one shown in Fig. 7 G as the data were obtained in the same experiment.
Figure 9.
Figure 9.
Arf1 coimmunoprecipitates with LRBA. (A) Coimmunoprecipitation analysis of Arf1-EGFP, Arf1Q71L-EGFP (constitutively active [CA]), Arf1I46S I49S-EGFP binding mutant and Arf1T31N-EGFP (dominant-negative [DN]). Arf1-EGFP constructs were pulled-down using GFP-trap magnetic beads. The eluted proteins were immunoblotted and Arf1 constructs were detected using polyclonal GFP antibodies. LRBA was detected by the polyclonal LRBA antibody. Wild-type and the constitutively active Arf1 interact with LRBA. This interaction is reduced with the Arf1I46S I49S-EGFP and Arf1T31N-EGFP DN mutant. (B) Quantification of immunoblots as shown on panel (A) from n = 6 biological replicates, one-way ANOVA using Tukey’s multiple comparison test, **P = 0.0040, *P = 0.0163. (C) Model of endosomal trafficking in the presence and in the absence of LRBA. Source data are available for this figure: SourceData F9.

References

    1. Abo, T., Roder J.C., Abo W., Cooper M.D., and Balch C.M.. 1982. Natural killer (HNK-1+) cells in Chediak-Higashi patients are present in normal numbers but are abnormal in function and morphology. J. Clin. Invest. 70:193–197. 10.1172/JCI110592 - DOI - PMC - PubMed
    1. Alangari, A., Alsultan A., Adly N., Massaad M.J., Kiani I.S., Aljebreen A., Raddaoui E., Almomen A.-K., Al-Muhsen S., Geha R.S., and Alkuraya F.S.. 2012. LPS-responsive beige-like anchor (LRBA) gene mutation in a family with inflammatory bowel disease and combined immunodeficiency. J. Allergy Clin. Immunol. 130:481–488.e2. 10.1016/j.jaci.2012.05.043 - DOI - PMC - PubMed
    1. Allan, C., Burel J.-M., Moore J., Blackburn C., Linkert M., Loynton S., Macdonald D., Moore W.J., Neves C., Patterson A., et al. . 2012. OMERO: Flexible, model-driven data management for experimental biology. Nat. Methods. 9:245–253. 10.1038/nmeth.1896 - DOI - PMC - PubMed
    1. Alter, G., Malenfant J.M., and Altfeld M.. 2004. CD107a as a functional marker for the identification of natural killer cell activity. J. Immunol. Methods. 294:15–22. 10.1016/j.jim.2004.08.008 - DOI - PubMed
    1. Ansari, M.Y., Ball H.C., Wase S.J., Novak K., and Haqqi T.M.. 2021. Lysosomal dysfunction in osteoarthritis and aged cartilage triggers apoptosis in chondrocytes through BAX mediated release of Cytochrome c. Osteoarthritis Cartilage. 29:100–112. 10.1016/j.joca.2020.08.014 - DOI - PMC - PubMed

MeSH terms

LinkOut - more resources